
Abstract
This study investigates the correlations between the three measures of written receptive vocabulary size and second language (L2) depth of vocabulary knowledge to find the most reliable test of vocabulary size. Moreover, the corresponding relationship is examined for the higher and lower word-frequency bands of the three tests to find whether the correlation between the two constructs differs as a function of frequency level and task format. In so doing, Vocabulary Levels Test (VLT), the monolingual and bilingual Persian versions of the Vocabulary Size Test (VST), and Word Associates Test (WAT) were administered to 122 high-proficient undergraduate English as a foreign language (EFL) learners. Results of Pearson correlations and linear regression analyses indicated that (a) the VLT had the highest correlation with the participants’ scores on the WAT; (b) although all the three tests of vocabulary size could significantly predict L2 depth of vocabulary knowledge, the VLT was the strongest predictor; (c) the higher word-frequency levels of the three VSTs in general, and the VLT in particular, were more predictive of L2 vocabulary depth; and (d) the 3,000-word-frequency level of the VLT, in particular, had the highest contribution to the performance on the WAT. The overall findings point to the superiority of the VLT among the three measures of vocabulary size.
Keywords
Introduction
The field of applied linguistics has developed and introduced a more complicated realization of the nature of vocabulary knowledge (Schmitt, Ng, & Garras, 2011). Vocabulary is a multidimensional and complex phenomenon and “the exact nature of lexical knowledge has always perplexed researchers and teachers” (Schmitt, 2014, p. 913). To clarify this complexity, vocabulary researchers have developed different frameworks (Henriksen, 1999; Nation, 2001; Read, 2000, 2007), which consist of a few related aspects. One of the well-known categorizations has divided vocabulary knowledge into breadth and depth of word knowledge that have been identified as the two most prominent dimensions in second language (L2) vocabulary research (Gyllstad, 2013).
Breadth of vocabulary knowledge refers to the size or number of words that language learners know at a particular time (Nation, 2001). It is also called the quantity of word knowledge that does not take into account the associations of a lexical unit. In other words, breadth of knowledge is “an estimate of how many words testees have in their lexicons” (Schmitt, 1999, p. 191). Depth of vocabulary knowledge, however, refers to the quality of word knowledge. Schmitt (2008) argued that to know a word “a learner must also know a great deal about each item in order to use it well” (p. 333). This means that for a word to be considered “learned,” a learner should not only acquire the form-meaning link of a lexical unit (as in vocabulary size) but also needs to be aware of its network (vocabulary depth). This network involves two types of relations: syntagmatic and paradigmatic (Schoonen & Verhallen, 2008). While the first type refers to the linear relations a lexical unit could have with other words in a sentence (e.g., desk-pencil, desk-notebook, and desk-study), the latter are hierarchical relations that are characterized by class inclusion (e.g., tree-pine, tree-plant). Read (1993) also defined vocabulary depth as the knowledge of syntagmatic, paradigmatic, and analytic relations among words, which are built by semantically related words such as antonyms, synonyms, superordinates/subordinates, hypernyms/hyponyms, and collocations.
Vocabulary size, as David (2008) believed, is the aspect of vocabulary knowledge that has gained more attention in L2 vocabulary research. Nguyen and Nation (2011) further believed that vocabulary size is a critical aspect of overall language knowledge that is necessary for effective language use. Schmitt (2014) also reviewed the most recent research on breadth and depth of vocabulary knowledge and pointed out that “most measurement and discussion of vocabulary to date have focused on size” (p. 915). While research on vocabulary size has focused on both receptive and productive aspects, the receptive dimension has been in the spotlight more than the productive aspect. The reason may lie behind the fact that knowing a large receptive vocabulary is vital for language use (Nation, 2006). Moreover, productive vocabulary, as argued by Fitzpatrick (2007), is more difficult to measure, whereas the receptive dimension is easier to assess and analyze (David, 2008).
Various instruments have been developed and/or validated to assess language learners’ breadth or size of vocabulary (see, for example, Laufer, Elder, Hill, & Congdon, 2004; Laufer & Goldstein, 2004; Laufer & Nation, 1999; Nation, 1993; Schmitt, Schmitt, & Clapham, 2001) prominent among which are the Vocabulary Levels Test (hereafter referred to as VLT), the monolingual version of Vocabulary Size Test (hereafter referred to as VST), and the bilingual versions of the VST.
The VLT was first developed by Nation (1983) to assess the size of word knowledge at 2,000, 3,000, 5,000, 10,000, and university word levels. The test was then revised and validated by Schmitt et al. (2001), and its reliability was reexamined by Xing and Fulcher (2007). The words in the VLT were taken from the Thorndike and Lorge (1944) list, Kučera and Francis (1967), the General Service List (GSL; West, 1953), and Academic Word List (AWL; Coxhead, 2000). More recently, a modified version of the VLT—New Vocabulary Levels Test (hereafter referred to as NVLT)—has been developed and validated by Webb, Sasao, and Ballance (2017). The NVLT measures vocabulary size at the 1,000-, 2,000-, 3,000-, 4,000-, and 5,000-word-frequency levels. The first two word lists were mostly derived from the spoken text rather than the written text to make the items more appropriate for the students who learn English as a foreign language (EFL; Webb & Sasao, 2013). The 3,000 to 5,000 word levels were based on the British National Corpus (BNC; Nation, 2012) and the Corpus of Contemporary American English (COCA).
The VST was first developed by Nation and Beglar (2007) to measure the first 1,000 to the 14th 1,000 word families of English extracted from the BNC. The test was later validated by Beglar (2010) using Rasch analysis and based on Messick’s (1989, 1995) validation framework. Shortly afterward, bilingual versions of the VST were developed and began to gain momentum, in addition to the original monolingual version of the test. The bilingual versions of the VST, in which the multiple-choice options of the items are in the native language of the test takers, have been developed for different languages including Japanese, Korean, Vietnamese, Mandarin, Russian, and Persian (see Elgort, 2013; Karami, 2012; Nguyen & Nation, 2011; Stewart, 2009; Zhao & Ji, 2016). All these three measures of written receptive vocabulary size have been widely used in L2 vocabulary research.
The construct of depth of vocabulary knowledge has been measured through a couple of receptive and productive task types. In comparison with measures of vocabulary size, “less progress has been made, both in defining depth as a construct and in developing tests for practical use” (Read, 2007, p. 105). Read (2000) classified the underlying approaches behind tests of vocabulary depth into two types of developmental and dimensions. The first one uses scales to rate the mastery of a word (e.g., 0 = no knowledge to 5 = full mastery). Vocabulary Knowledge Scale (VKS; Paribakht & Wesche, 1997) is a well-known productive test of vocabulary depth that uses this approach. Based on a 6-point elicitation scale from “I don’t remember having seen this word before” to “I can use this word in a sentence,” the test combines receptive self-report options with productive ones requiring the examinees to write a synonym, L1 translation, or a sentence. The VKS, however, suffers from a number of limitations, including unverified knowledge of the target word at the first two stages of the scale and lack of consistency between the constructs of knowledge assessed in the six stages of the scale, which makes it multidimensional (see Schmitt, 2010, for more details).
The dimensions approach involves specifying various component types of word knowledge one can have about a word, and then computing the test taker’s mastery of those types. The best known test utilizing this method is the Word Associates Format (WAF), also called the Word Associates Test (hereafter referred to as WAT), which was first developed by Read (1993). Built on the concept of word association and lexical network, the WAT “measures knowledge of multiple aspects of vocabulary knowledge to reveal how well words are known” (Webb & Sasao, 2013, pp. 268-269). The WAT has been used by many researchers as a measure of vocabulary depth (e.g., Akbarian, 2010; Dabbagh & Janebi Enayat, 2017; Gyllstad, 2007; Janebi Enayat & Babaii, 2017; Nassaji, 2006; Qian, 1999, 2002; Schoonen & Verhallen, 2008; D. Zhang, 2012) and has been suggested for research, pedagogical applications, and standardized testing such as Test of English as a Foreign Language (TOEFL) examination (Qian & Schedl, 2004).
The Right Measure of Vocabulary Size
VSTs are important for several reasons (Beglar, 2010; Nation & Beglar, 2007; Nguyen & Nation, 2011). First, they can serve as appropriate diagnostic tests that let the teachers know how many words their students already know and which words or word-frequency levels they need to focus on more. Second, measures of receptive vocabulary size can be used for all general and skill-based language courses to place the learners into different vocabulary proficiency groups. Third, VSTs can be used for research purposes and to classify the learners into proficiency levels. Fourth, measuring vocabulary size of the learners is important to record and examine the progress of the learners’ vocabulary knowledge over time. Fifth, they can be used to “determine the degree to which a course or program is meeting lexical objectives, and better understand the impact of educational reform on vocabulary growth” (Beglar, 2010, p. 102). Accomplishing all these purposes requires a measure of vocabulary size that has the least limitations and problems and has the appropriate level of reliability and validity.
As previously mentioned, three measures of written receptive vocabulary size have been developed and validated and are increasingly used in studies on L2 vocabulary research. The VLT and VST have been identified as valid and reliable measures of vocabulary size (Akbarian, 2008; Beglar, 2010; Nation & Beglar, 2007; Schmitt et al., 2001; Xing & Fulcher, 2007). In addition, bilingual versions of both VLT and VST have been developed and recommended as appropriate alternatives to the monolingual versions (Elgort, 2013; Karami, 2012; Nation, 2007; Nguyen & Nation, 2011; Stewart, 2009; Zhao & Ji, 2016).
Read (2013) reviewed the studies on development and validation of L2 vocabulary measures and reported that Schmitt et al. (2001) conducted a comprehensive validation research to revise the VLT, previously developed by Nation (1983), and validated the new version with “over 800 learners in five different countries” (p. 48). Read and Chapelle (2001) also identified the VLT as a popular measure of vocabulary size that is available, simple, and convenient. Moreover, Cameron (2002) compared VLT with the Yes/No test (Meara, 1992), which is also a measure of vocabulary size, and found that the VLT was a much better test of vocabulary size. Abdullah, Puteh, Azizan, Hamdan, and Saude (2013, p. 353) pointed out that “this test has been so widely used to measure ESL learners’ vocabulary size” and many studies have used it to measure the vocabulary size of their participants (e.g., Akbarian, 2010; Alavi & Akbarian, 2012; Dabbagh & Janebi Enayat, 2017; Janebi Enayat & Babaii, 2017; Qian, 2002; Shiotsu & Weir, 2007; Stæhr, 2009; L. J. Zhang & Anual, 2008). Webb and Sasao (2013) further believed that the VLT is “perhaps the best known and most widely used vocabulary test” (p. 264).
Similarly, the VST has recently gained momentum after it was developed by Nation and Beglar (2007) and validated by Beglar (2010). Although it does not have a strong and supported literature as the VLT, it has been argued to be more comprehensive than its former counterpart (Elgort, 2013). Nation and Beglar (2007) claimed that, unlike VLT, which is a diagnostic measure, the VST is “a proficiency measure used to determine how much vocabulary learners know” (p. 10). The authors believe that their test has filled the gaps in the VLT in which not all the word-frequency levels are examined. Beglar also pointed out that the VST could be applied to measure the progress of a learners’ vocabulary learning over time.
In spite of the fact that the VST was validated and identified as a more comprehensive measure of vocabulary size, some problems and limitations were attributed to this test such as having complex options, and, accordingly, the bilingual versions were suggested to be developed for different languages to compensate for the negative effects of the monolingual version. It is worth mentioning that the VLT has also attracted its own criticism such as not being comprehensive and using rather old word-frequency lists (Webb & Sasao, 2013). Consequently, the L2 vocabulary field is facing a serious challenge and question: Which measure of vocabulary size is more appropriate, reliable, and/or valid after all? In fact, as Beglar (2010) believed, “currently, no well-accepted test of written receptive vocabulary size for non-native speakers of English exists despite the fact that such a test could serve a number of important roles in foreign language curricula” (p. 2).
The Interconnection Between Breadth and Depth: A Possible Yardstick
Henriksen (1999) pointed out that vocabulary size and depth are interconnected as “an understanding of the relations among the items is a prerequisite for a more precise understanding of each individual item” (p. 313). Meara and Wolter (2004) further argued that “vocabulary size is not a feature of individual words: rather it is a characteristic of the test taker’s entire vocabulary” (p. 87). They compared and contrasted two different views of the interconnection between vocabulary breadth and depth. The first one, which they call “a list model,” conceptualizes the words as bars that can be short (with less depth) or long (with more depth). Meara and Wolter contend that in this view, there is not any “intrinsic” relationship between vocabulary breadth and depth as adding more words has no implications for the other words in the lexicon. The second model, by contrast, visualizes the individual words or vocabulary size as nodes and the connections between the nodes as word associations or vocabulary depth. This model, as they argue, views the two aspects of vocabulary knowledge as interconnected where increase in vocabulary size has implications for the rest of the network and leads to an increase in depth of vocabulary knowledge. Ishii and Schmitt (2009) also viewed the two dimensions of vocabulary size and depth as integrated and contended that one would not make sense without the other. They thus attempted to develop a new vocabulary test battery by combining the size and depth tests in a practical manner and interpreting the corresponding scores in an integrative way. N. Schmitt (personal communication, May 9, 2008, cited in Gyllstad, 2013) further argued that “every size test is in fact also a depth test” (p. 25). This could be due to the fact that “the more words someone knows, the finer the networks and deeper the word knowledge” (Vermeer, 2001, p. 222).
The interconnection between vocabulary size and depth would mean that simply knowing the L1 translation of a word (as in the bilingual version of the VST) does not show that the learner knows the word. Accordingly, the bilingual versions of the VST may not be appropriate measures of vocabulary size as they disregard the interconnection between vocabulary size and depth. In other words, being able to know the elements of the meaning of a target word, which are usually presented in the L2 definitions or associates of the word, should be considered as part of the breadth of vocabulary knowledge.
The interconnection between the two dimensions of vocabulary knowledge, as measured through the VLT and WAT, has been reported in a number of studies (e.g., Akbarian, 2010; Gyllstad, 2007; Huang, 2006; Noro, 2002; Nurweni & Read, 1999; Qian, 1999, 2002; D. Zhang, 2012). This relationship could be justified by taking into account the popularity of the VLT (Abdullah et al., 2013; Read & Chapelle, 2001; Webb & Sasao, 2013), as a measure of vocabulary size, and the aforementioned interconnection between the two aspects of vocabulary size and depth (Henriksen, 1999; Ishii & Schmitt, 2009; Meara & Wolter, 2004; Schmitt, 2014). The interconnection between the two tests, however, may not mean that a test taker’s score on the VLT is a precise indication of both size and depth of vocabulary knowledge as the items on the VLT or any other tests of receptive vocabulary size are purported to measure form/meaning recognition knowledge in a decontextualized manner, and not purposefully designed to target depth of vocabulary knowledge. The ability of such item formats such as the multiple matching (as in the VLT) and multiple choice (as in the VST) to represent any deeper knowledge than just the form-meaning link has been recently investigated by Kremmel and Schmitt (2016) who found that scores obtained from these recognition formats could not be interpreted as providing information about examinee’s knowledge of the target words’ derivatives and collocations.
The interconnection between the two tests of size and depth could possibly mean that the two dimensions are actually the same construct (Vermeer, 2001) and should not be taught or even measured separately (Akbarian, 2010). Another interpretation is that tests of depth of vocabulary knowledge, such as WAT, are not really tests of vocabulary depth; they are rather size tests masquerading as depth tests (Akbarian, 2010; Milton, 2009). The nature of this interconnection is, therefore, still complicated and various interpretations have been proposed (Schmitt, 2014). Part of this ambiguity resides in the lack of an explicit statement from the VST developers specifying “what correct answers on their tests entail and what degree of depth they represent” (Schmitt, 2014, p. 943).
If we reconsider the above-mentioned two models proposed by Meara and Wolter (2004) for the interconnection between vocabulary size and depth, we can come to a clearer interpretation. They criticize the view that conceptualizes the words with more depth as longer bars and words with less depth as shorter bars and contend that, in this model, adding new words (vocabulary size) does not have any implications for the other words, as explained above. They thus propose a model in which all the words are associated with each other and adding new words enhance the overall depth of vocabulary knowledge. Kremmel and Schmitt’s (2016) empirical study seems to follow the first model of Meara and Wolter as they investigated the extent that different item formats, including the ones used in the VLT and VST, could give information about the target words’ collocations, which is one element of depth of vocabulary knowledge. If we take this view into account, the score on a given VST item can give us little information about the depth of knowledge of the corresponding word. What different item formats can show is, as Laufer et al. (2004) explained, the “strength” and not “depth” of knowledge as the latter “includes features in addition to meaning, e.g., grammatical properties, collocations, pronunciation, etc.” (p. 209). If we take into account the second model of Meara and Wolter, the tests of VLT and WAT could be related at the construct level and not necessarily at the test item level. In other words, the specific items on the VLT do not tell us anything about the depth of the corresponding target words, but we could infer that the test taker would have a specific knowledge of vocabulary depth.
Another point of disagreement in the interconnection between vocabulary size and depth is the strength of the correlation for lower and higher frequency words. It has been reported that there is little difference between vocabulary size and depth for higher frequency words while there is often a gap between the two aspects of vocabulary knowledge for lower frequency words (Schmitt, 2014). Shimamoto (2000), for example, examined the relationship between the scores of Japanese university students on the VLT and four measures of vocabulary depth including recognition of paradigmatic associations and collocation. The relationship was found to be weaker for learners who had larger vocabularies. In other words, vocabulary depth seemed to lag behind as vocabulary size increased. Similarly, Noro (2002) examined the relationship between the VLT and WAT and found that the size and depth scores correlated more strongly for the students with lower proficiency. Henriksen (2008) also compared the vocabulary size and depth of EFL students and the relationship was found to be stronger for younger grades than the advanced students.
Although the correlation between the VLT and WAT has been well established in the literature, no study has yet examined this relationship for the other more recent tests of vocabulary size, that is, VST and its bilingual versions. In this study, we used the proposed model of Meara and Wolter (2004) and raised the assumption that the correlation between the three measures of vocabulary size and depth of vocabulary knowledge would serve as a yardstick to identify the more reliable test. Moreover, the nature of this relationship was compared for higher and lower word-frequency bands of the three tests. Accordingly, the following research questions were addressed in this study:
Method
Participants
The participants of this study were 122 male and female undergraduate students majoring in English literature, translation studies, and teaching English as a foreign language. They were selected using convenience sampling from Gonbad Kavous University and Golestan University, which are two state universities in Iran. The students ranged from freshmen to seniors and their age ranged from 18 to 26. All the participants were native speakers of Persian. They were highly proficient in English as determined by whether they passed the cutoff score on the 2,000-word-frequency level in the VLT (following Akbarian, 2010). Table 1 shows a brief profile of the participants.
Profile of the Participants.

Note. EL = English literature; TS = translation studies; TEFL = teaching English as a foreign language.
Instruments
VLT
This test was designed by Nation (1983) and later revised and validated by Schmitt et al. (2001). It measures learners’ knowledge of single meanings of content words at four word-frequency levels (2,000, 3,000, 5,000, and 10,000). The VLT is “a reformatting of the synonym or definition to word-matching tasks often found in standard multiple-choice questions” (Culligan, 2015, p. 6). The test takers need to match the definitions on the right side of the cluster with the target words on the left (see Figure 1). Participants are asked not to guess the meaning of the words if they do not know them but are advised to attempt an answer if they think they know the word. Qian (1999) obtained a reliability of .92 for the measure. This study used Version 2 of this test, which was revised and validated by Schmitt et al. (2001).
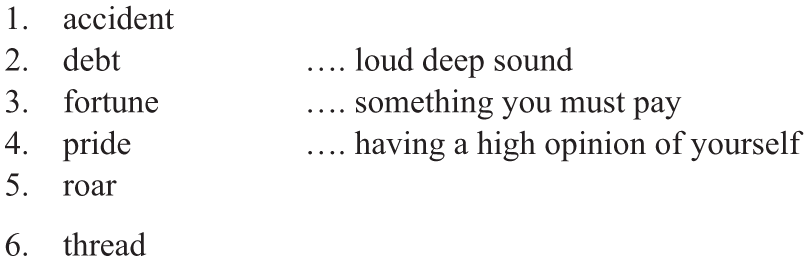
A VLT sample item.
VST
The VST was developed by Nation and Beglar (2007) “to provide a reliable, accurate, and comprehensive measure of second language English learners’ written receptive vocabulary size from the first 1000 to the fourteenth 1000-word families of English” (Beglar, 2010, p. 103). The test consists of 10 items for each level, totally making a 140-item test. The test has a multiple-choice format with each item having four options. The monolingual version of the test has been validated by Beglar (2010) who reported a high degree of validity and reliability using Rasch analyses which focused on Messick’s (1989, 1995) validation framework. Figure 2 shows an example item from the 12th 1,000 level used in the VST.
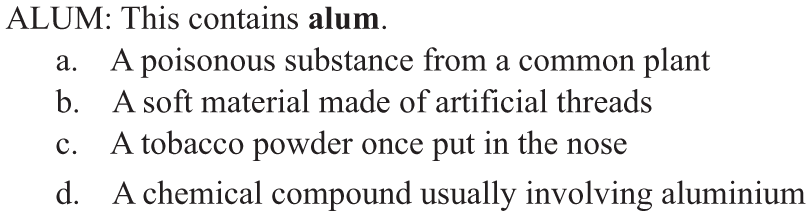
An example item from the VST.
Bilingual Persian version of VST
The bilingual Persian version of the VST was developed and validated by Karami (2012) with 190 English learners. The author used factor analysis to check the unidimensionality of the test and found that it measured a single construct, which was presumed to be word knowledge. The test was also reported to have high reliability index (α = .97). One-way between-subjects ANOVA was used to compare the performance of three groups of students with low-, mid-, and high-proficiency levels. The results indicated that there were significant mean differences between the performance of the three groups, and the bilingual Persian VST could distinguish learners of different levels of proficiency. An example item from the 12th 1,000 level is shown in Figure 3. This is the same item shown above for the monolingual version of the VST.

An example item from the bilingual Persian version of VST.
WAT
This test is based on the main relations of syntagmatic, paradigmatic, and analytic relationships between two lexical units (Batty, 2007), which was developed by Read (1993) at Victoria University of Wellington to measure the receptive aspect of depth of vocabulary knowledge. The building block of this test was the concept of word association and lexical network. It was developed to measure three vocabulary elements: synonymy, polysemy, and collocation (Qian, 2002). The test has been revised and validated since first developed (e.g., Laufer et al., 2004; Qian, 1999; Schmitt et al., 2011). The internal consistency of the test has been assessed using the split half reliability method that splits the test into two equal parts and examines the correlation between the two halves. Its split half reliability has been reported to be .89 (Nassaji, 2006; Qian, 2002). The test consists of 40 items, each one presenting a stimulus adjective and two boxes each containing four words. The left box shows the synonymous words, and the right box the collocations of the stimulus word. The participants have to choose four words that are semantically related to the prompt word (see Figure 4). In the given example item, the examinees should select “right” and “true” from the left box because they are synonyms for the target word. From the right box, they have to select “answer” and “time” which could be collocated with the target word. The pattern of the students’ responses is, however, not fixed and three situations are possible to reduce the guessing effect: (a) the left and right boxes both contain two correct answers; (b) the left box contains one correct answer, and the right box contains three correct answers; and (c) the left box contains three correct answers, and the right box contains only one correct answer. (Qian, 2002, p. 524)

A WAT sample item.
The four related words are selected to represent three semantic relations: analytic, syntagmatic, and paradigmatic (Read, 1993).
Procedures
To collect the data needed for the purposes of this study, several steps were taken. First, the WAT was administered to find the participants’ depth of vocabulary knowledge. Second, the VLT, VST, and bilingual Persian version of the VST were administered to find the students’ size of vocabulary knowledge using the three tests. All the four measures of vocabulary depth and size were administered in the classroom context, using the paper-based formats. Each test was administered separately and the time allotted for each one was 30 to 45 min. The WAT and VLT were taken on two occasions with a 1-week time interval while the monolingual and bilingual versions of the VST were taken in one sitting with only a break in between to control the testing effect. There was no penalty for incorrect answers for any of the tests given. The cutoff score for mastering the 2,000-word-frequency level of the VLT, which was used to determine the English proficiency of the participants, was taken as 24 out of 30 (N. Schmitt, personal communication, May 9, 2008).
Data Analysis
The obtained data were analyzed using Pearson correlation and linear regressions (enter and stepwise methods) in SPSS, Version 20.
Results
Descriptive Statistics
Table 2 shows the descriptive statistics for all the variables, that is, the scores of the students on the VLT, the monolingual VST, the bilingual Persian VST, and the WAT. The results show that, overall, the mean score of the participants on the bilingual version of the VST (M = 60.97, SD = 17.85) was more than the monolingual one (M = 48.99, SD = 15.04). The table indicates that the scores of the participants on all the four measures of vocabulary knowledge enjoyed appropriate Cronbach’s alpha estimate of reliability. The descriptive statistics for each word-frequency level of the three tests of vocabulary size are also shown in Table 3 for further comparison. It shows that the mean score of the participants on the 2,000-word level of the VLT was around 28, which indicates high-proficiency level (Akbarian, 2010).
Descriptive Statistics for All the Tests (n = 122).
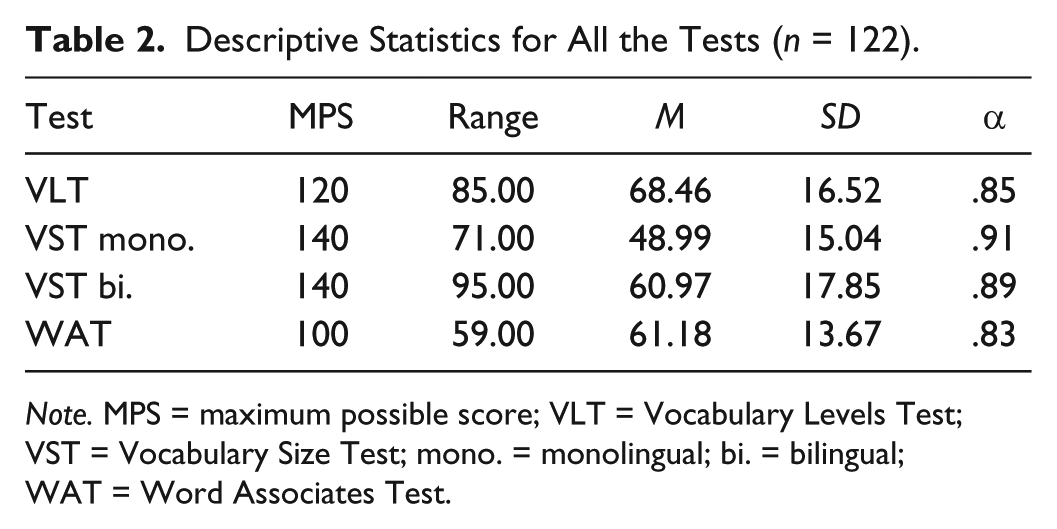
Note. MPS = maximum possible score; VLT = Vocabulary Levels Test; VST = Vocabulary Size Test; mono. = monolingual; bi. = bilingual; WAT = Word Associates Test.
Descriptive Statistics for All the Word-Frequency Levels of the Three VSTs.

Note. VSTs = Vocabulary Size Tests; MPS = maximum possible score; VLT = Vocabulary Levels Test; K = 1,000; M. = monolingual; B. = bilingual.
Correlations Between the Three VSTs
Before checking the relationship between the three tests of vocabulary size and L2 depth of vocabulary knowledge, as measured through the WAT, the correlations between the measures of vocabulary size—namely, VLT, monolingual, and bilingual Persian versions of the VST—were studied to have a good idea of to what extent the construct each measure taps into overlaps with, or differs from, one another. The results, as indicated in Table 4, showed that all the three tests were significantly correlated with each other. The VLT and monolingual version of the VST had the lowest, but still significant, correlation among the measures of vocabulary size (r = .596, p < .001), whereas the correlation between the monolingual and bilingual versions of the VST was the highest (r = .711, p < .001). The relationship between the VLT and bilingual Persian version of the VST was moderate but statistically significant as well (r = .677, p < .001).
Pearson Correlation Between the Three Measures of Vocabulary Size.

Note. VST = Vocabulary Size Test; M. = monolingual; B. = bilingual; VLT = Vocabulary Levels Test.
Significant at p = .001.
Correlations Between VSTs and WAT
The second research question of this study addressed the correlations between the three measures of vocabulary size and the EFL students’ depth of vocabulary knowledge. For this purpose, Pearson correlation analyses were run for the scores of the participants on the VLT, Persian bilingual version of the VST, monolingual VST, and WAT.
As indicated in Table 5, the correlations between the three tests of vocabulary size and L2 depth of vocabulary knowledge were significant for all the three measures, including the VLT (r = .642, p < .001), the monolingual version of the VST (r = .409, p < .001), and the bilingual Persian version of the VST (r = .601, p < .001). However, the results of Pearson correlations showed that this relationship was more statistically significant for the VLT.
Pearson Correlation Between the Three Measures of Vocabulary Size and Vocabulary Depth.

Note. VLT = Vocabulary Levels Test; VST = Vocabulary Size Test.
Significant at p = .01.
Predictive Ability of VSTs in WAT
The third research question of this study was concerned with the predictive ability of the three measures of vocabulary size in L2 depth of vocabulary knowledge. To answer this question, simple and multiple linear regression analyses were run using the enter and stepwise methods.
Table 6, which shows the results of simple linear regressions using the enter method, indicates that all the three measures of vocabulary size could significantly predict the EFL students’ depth of vocabulary knowledge. The VLT could explain more than 41% of the variance in the participants’ performance on the WAT (R2 = .413, F = 84.294, p < .001). It could significantly predict L2 depth of vocabulary knowledge with β = .642, t = 9.181, p < .001. In addition, the monolingual version of the VST, although less vigorously, could explain more than 16% of the variation in the scores on the WAT (R2 = .167, F = 24.076, p < .001). The prediction made by this measure was statistically significant as well (β = .409, t = 4.907, p < .001). Similarly, the bilingual Persian version of the VST could explain around 36% of the variance in the dependent variable (R2 = .361, F = 67.710, p < .001). The scores of the participants on this test could significantly predict the L2 depth of vocabulary knowledge with β = .601, t = 8.229, p < .001. The overall results, however, showed that the scores of the students on the VLT could explain the variance in the WAT over and above the other two measures of vocabulary size. A multiple linear regression analysis was also conducted using the stepwise method to find the stronger predictor of L2 depth of vocabulary knowledge among the three measures of vocabulary size.
Simple Linear Regression Analysis for the Three Measures of Vocabulary Size in L2 Vocabulary Depth (Using the Enter Method).

Note. L2 = second language: VLT = Vocabulary Levels Test; WAT = Word Associates Test; VST = Vocabulary Size Test; M. = monolingual; B. = bilingual.
Predictors: (Constant), VLT.
Predictors: (Constant), VST monolingual.
Predictors: (Constant), VST bilingual.
Significant at p = .01.
Using the stepwise method, a significant model emerged for the predictive ability of the VLT. As the results of Table 7 display, the only measure of vocabulary size which entered Model 1 was the VLT. This model could explain 41% of the variance in the WAT (R2 = .413, F = 84.294, p < .001), which was statistically significant. This test of vocabulary size was, therefore, a stronger predictor of L2 depth of vocabulary knowledge with β = .642, t = 9.181, p < .001. The second model in which the bilingual Persian version of the VST was added to the VLT could explain 46% of the variation in the scores of the participants on the WAT (R2 = .463, F = 51.379, p < .001). In other words, the bilingual version of the VST could add only 5% to the variance explained by the VLT. The VLT and bilingual VST, as single variables, could significantly predict the students’ depth of vocabulary knowledge (β = .435, t = 4.771, p < .001; β = .306, t = 3.355, p < .01, respectively). Overall, the results indicated that the VLT was the strongest predictor variable for the L2 depth of vocabulary knowledge among the three measures of vocabulary size.
Multiple Linear Regression Analysis for the Three Measures of Vocabulary Size in L2 Vocabulary Depth (Using the Stepwise Method).

Note. L2 = second language; VIF = variance inflation factor; WAT = Word Associates Test; VLT = Vocabulary Levels Test; B. = Bilingual; VST = Vocabulary Size Test.
Predictors: (Constant), VLT.
Predictors: (Constant), VLT, VST Bilingual.
Significant at p = .01. **Significant at p = .001.
Correlations Between the Two Variables for Higher and Lower Frequency Levels
The fourth research question examines whether the correlations between the three measures of vocabulary size and depth of vocabulary knowledge differ for higher and lower word-frequency levels. For this purpose, the correlations between the WAT and the first 5,000 frequency levels (i.e., 1,000, 2,000, 3,000, 4,000, and 5,000) of the two versions of the VST, their last less frequent word levels (i.e., from 6,000- to 14,000-word-frequency levels), the most frequent word levels of the VLT (i.e., the 2,000, 3,000, and 5,000), and its single 10,000-word-frequency level were compared. Table 8 indicates that, overall, the correlations between the most frequent words of the three tests of vocabulary size and WAT were relatively stronger than the corresponding relationship for the less frequent words. More specifically, the correlation between WAT and high-frequency words of the VLT (r = .647, p < .001) was more significant than the one between WAT and the 10,000-word-frequency level (r = .474, p < .001). The relationship between the WAT and the most 5,000 frequency bands of the VST was also stronger than the less frequent words (r = .421 > .346, p < .001). This difference, however, was less evident for the bilingual version of the VST (r = .555 > .546, p < .001). The overall results showed that the correlation between the high word-frequency levels of the VLT and WAT was the highest among the three measures of vocabulary size.
Pearson Correlations Between Vocabulary Depth and the High- and Low-Frequency Words of the Three VSTs.

Note. VSTs = Vocabulary Size Tests; VLT = Vocabulary Levels Test; M. = monolingual; B. = bilingual.
Significant at p = .001.
To have a more reliable understanding of the relationship between the three tests of vocabulary size and WAT and the way that the strength of correlation changes as a function of task format (i.e., multiple matching items in the VLT and multiple-choice items in the VST), the correlations between the WAT and the related frequency scores of both VLT and VST (i.e., 2,000, 3,000, and 5,000) were compared. The results, as given in Table 9, showed that the correlations between the VLT and WAT were stronger than the other two measures for all the three frequency bands. As for the 2,000-word frequency, the correlation for the VLT (r = .578, p < .001) was higher than the monolingual (r = .384, p < .001) and bilingual (r = .334, p < .001) VST. Similarly, the relationship between the 3,000 frequency level of the VLT (r = .604, p < .001) and WAT was the strongest among the three tests. The table also shows that, for the 5,000 frequency band, the correlation between the VLT and WAT (r = .552, p < .001) was higher than that of the monolingual and bilingual versions of the VST (r = .341, p < .001; r = .487, p < .001, respectively).
Pearson Correlations Between Vocabulary Depth and the Three Comparable Frequency Bands of the VSTs.

Note. VSTs = Vocabulary Size Tests; VLT = Vocabulary Levels Test; M. = monolingual; B. = bilingual.
Significant at p = .001.
Predictive Ability of Higher and Lower Frequency Levels in WAT
The last research question of this study investigated the differences in the predictive ability of the higher and lower frequency bands of the three tests of vocabulary size in L2 depth of vocabulary knowledge. For this purpose, multiple linear regression was run (using the stepwise method), the results of which are given in Table 10. The findings showed that the higher word-frequency bands in the VLT (i.e., 2,000, 3,000, and 5,000) was the only subtest out of the six high and low subtests of the three tests of vocabulary size that could enter the model. The participants’ overall scores on these higher frequency levels could explain around 42% of the variance in the WAT (R2 = .419, F = 86.391, p < .01). Another model emerged in which both the high-frequency bands of the VLT and bilingual VST were entered as the predictor variables. This second model, in which the higher frequency word levels of the bilingual Persian version could add around 5% of variance, could not significantly predict the dependent variable (R2 = .473, F = 53.484, p > .05). As a single variable, however, the students’ scores on the most frequent word lists of the bilingual VST could significantly predict the scores on the WAT (β = .282, t = 3.519, p < .01).
Multiple Linear Regression Analysis for the Higher and Lower Frequency Words in L2 Vocabulary Depth.

Note. L2 = second language; VIF = variance inflation factor; WAT = Word Associates Test; VLT = Vocabulary Levels Test; B. = bilingual; VST = Vocabulary Size Test.
Predictors: (Constant), High VLT.
Predictors: (Constant), High VLT, High VST Bilingual.
Significant at p = .01.
Another multiple linear regression analysis was run using the stepwise method to investigate the contribution of the three overlapping word-frequency bands of the three measures of vocabulary size (i.e., the 2,000, 3,000, and 5,000 levels) to the test takers’ performance on the WAT. As displayed in Table 11, four models emerged in the analysis, two of which were not statistically significant. The first model, in which only the 3,000-word-frequency band of the VLT was entered as the predictor variable, could explain 36.5% of the variation in the WAT (R2 = .365, F = 69.099, p < .001). This frequency level could significantly predict the dependent variable with β = .604, t = 8.313, p < .001. The 3,000-word-frequency level of the bilingual Persian version of the VST was added to the 3,000 frequency band of the VLT in the second model, which could significantly explain nearly 45% of the variance in the WAT (R2 = .449, F = 48.536, p < .001). The new level could thus add about 8% to the variation explained by the 3,000 level of the VLT. The contribution of this new subtest was also statistically significant (β = .307, t = 4.256, p < .001.). The last two models, however, could not significantly predict the examinees’ performance on the WAT (Model 3: R2 = .484, F = 36.920, p > .05; Model 4: R2 = .508, F = 30.170, p > .05). Models 3 and 4 showed that adding the 2,000-word frequency of the VLT and monolingual VST, respectively, could not add further significant predictive ability to the previous subtests. Independently, however, the 2,000 frequency bands of the VLT (β = .253, t = 2.826, p < .01) and monolingual VST (β = .164, t = 2.367, p < .01) could significantly predict L2 depth of vocabulary knowledge, as measured through the WAT.
Multiple Linear Regression Analysis for the Three Comparable Frequency Bands of the VSTs in L2 Vocabulary Depth.

Note. VSTs = Vocabulary Size Tests; L2 = second language; VIF = variance inflation factor; WAT = Word Associates Test; VLT = Vocabulary Levels Test; B. = bilingual; M. = monolingual.
Predictors: (Constant), VLT 3K.
Predictors: (Constant), VLT 3K, VST bilingual 3K.
Predictors: (Constant), VLT 3K, VST bilingual 3K, VLT 2K.
Predictors: (Constant), VLT 3K, VST bilingual 3K, VLT 2K, VST monolingual 2K.
Significant at p = .01. **Significant at p = .001.
Discussion
The present study used the correlations between the three measures of vocabulary size (namely, the VLT, the monolingual version of the VST, and the bilingual Persian version of the VST) and the L2 depth of vocabulary knowledge as a yardstick to identify the more reliable VST. For this purpose, Pearson correlations and linear regressions were run for the scores of the 122 EFL students on the three size tests as well as the WAT. The overall results showed that while all the three tests of vocabulary size were correlated with and could significantly predict the L2 depth of vocabulary knowledge, the VLT was the strongest predictor for the dependent variable. Moreover, the analyses for the higher and lower word-frequency levels of the three tests provided evidence for the stronger contribution of higher frequency words of the VSTs in general, and VLT in particular, to the students’ performance on the WAT. The contribution of the 3,000-word frequency of the VLT, in particular, was more evident.
The significant correlations between the three tests of vocabulary size indicate that they tap into the same construct, which is the breadth of vocabulary knowledge. This is further indicative of the concurrent validity of the three measures of vocabulary size. Culligan (2015) believed that “strong correlations of the scores with each other provide evidence of the concurrent validity of the measures” (p. 603). The results showed that the correlation between the monolingual and bilingual versions of the VST was the highest, which could be interpreted as appropriate validity for the bilingual Persian VST developed by Karami (2012). The higher mean score of the students on the bilingual version is consistent with Elgort (2013), who compared the English-only and English-Russian versions of the VST and found that the test takers achieved significantly higher scores on the bilingual VST.
The findings provided evidence for the indisputable interconnection between the vocabulary size and depth, which are the two aspects of the construct of vocabulary knowledge. This is moderately consistent with the findings of previous studies that found by far stronger correlations between the two dimensions (e.g., Akbarian, 2010; Farvardin & Koosha, 2011; Gyllstad, 2007; Henriksen, 2008; Horiba, 2012; Milton, 2009; Zareva, 2005). Akbarian (2010), for instance, using regression analysis, found that the VLT could explain more than 70% of the variance in the WAT and vice versa. The larger correlation found in Akbarian’s study could be due to the fact that he did not administer the 10,000-word-frequency level of the VLT as it was perceived to be beyond the language proficiency of the participants who were Iranian learners of English for specific/academic purposes (ESP/EAP). The results of this study, also, showed that the correlations between the higher frequency words of the three size tests and WAT were stronger than the lower frequency words. These results, as well as the difference between the correlations found in this study and Akbarian’s (2010), therefore, could provide backing for the conclusion drawn by Schmitt (2014) from his review that for higher frequency words, “there is often little difference between size and a variety of depth measures” whereas for lower frequency words, “there is often a gap between size and depth, as depth measures lag behind the measures of size” (p. 941). The findings further support Shimamoto (2000), Noro (2002), and Henriksen (2008) who reported a weaker relationship between vocabulary size and depth for lower frequency words.
Gyllstad (2007) also used the same measures for vocabulary size and depth and found high correlation between the two variables. In fact, based on these studies, the L2 lexicons “become more organized as vocabulary size grows,” and, therefore, “depth conceptualized as lexical organization appears strongly related to vocabulary size” (Schmitt, 2014, p. 939). The high correlations between the measures of vocabulary size and L2 depth of word knowledge also support the findings of Tseng and Schmitt (2008) and D. Zhang (2012), which, using structural equation modeling (SEM)—a latent variable regression that controls for measurement errors and allows a set of relationships to be examined simultaneously—found that the scores on the VLT and WAT were correlated with each other. This relationship between vocabulary size and depth can be further justified with reference to Meara and Wolter (2004) who believed that the two constructs of vocabulary size and depth are interrelated in a way where learning more new words (size) enhance the lexical association between words (depth).
The less vigorous correlation between the two aspects of vocabulary knowledge for larger vocabulary sizes and lower frequency words, as mentioned above, led Schmitt (2014) to argue that “for higher frequency words, and for learners with smaller vocabulary sizes, there is often little difference between size and a variety of depth measures” (p. 941). The vocabulary size and depth relationship, as pointed out by Schmitt (2014), often faces a gap for lower frequency words. The nature of this interrelationship can assist us to discuss the different strengths of correlations between the three measures of vocabulary size and L2 vocabulary depth, as found in this study. The VLT, which had the highest correlation with and predictive power for the scores on the WAT, measures the students’ knowledge of content words at four word-frequency levels (2,000, 3,000, 5,000, and 10,000). However, the VST and its bilingual versions measure knowledge of the first 14th 1,000-word families. As Schmitt and Schmitt (2014) argued, the vocabulary boundary of 9,000 and beyond should be considered as low frequency. Accordingly, the VST assesses knowledge of more low-frequency words than the VLT in which the only low-frequency word level is 10,000. The lower predictive power of the monolingual and bilingual versions of the VST can, therefore, be the result of measuring more low-frequency words. This was also evident in the comparisons between the higher and lower frequency levels of the three size tests which showed that the higher frequency words in all the three tests were more correlated with the vocabulary depth of the participants than the lower frequency words. More proficient test takers with larger vocabulary size have the opportunity to show their knowledge of low-frequency words on the VST over and above that of the VLT. This level of vocabulary size, however, is less correlated with measures of vocabulary depth, as reviewed above. The results found for the VLT are, therefore, consistent with the studies that showed a higher correlation between knowledge of higher frequency words and L2 depth of vocabulary knowledge (e.g., Henriksen, 2008; Noro, 2002; Shimamoto, 2000). The findings, however, do not support Nurweni and Read (1999) and Akbarian (2010) who found that the relationship between vocabulary size and lexical organization was closer for students with larger vocabulary size and/or knowledge of lower frequency words.
The results further indicated that the correlation between the higher word-frequency levels of the VSTs was higher for the VLT. Even among the overlapping high word-frequency levels of the three measures, the frequency bands of the VLT in general, and the 3,000-word frequency in particular, were more correlated with and could predict performance on the WAT. This might be due to the different task format of the VLT, which uses multiple matching items, compared with the two versions of the VST, which use multiple-choice items. The first type, as found by Stewart and White (2011), is likely to lead to an average score inflation of 16% due to guesswork, while for the second type, it could be as high as 25% for most of the frequency levels (Stewart, 2014). Stewart (2014) concluded that “with four multiple-choice options rather than six, the VST may be even more susceptible to guessing effects than the VLT” (p. 279). Therefore, the students’ score on the higher frequency levels of the VLT could be a more precise estimate of their vocabulary size than the two versions of the VST.
In a more recent study, Schmitt and Schmitt (2014) reassessed the frequency and vocabulary size and argued that the “high-frequency English vocabulary should include the most frequent 3,000 word families” (p. 484) as the distributions of word frequency (Nation, 2006) show that beyond this level, the frequency of occurrence falls off to a great extent. The highest contribution of the 3,000-word-frequency level, as this study found, could also provide backing for this new classification. The authors based their evidence on the study by Nation (2006) and questioned the appropriacy of the boundaries. Schmitt and Schmitt (2014) reported that the vocabulary size and text coverage, as mentioned in Nation (2006), show that “from about the 6,000 level onwards, the additional coverage for each 1,000 band of vocabulary is very small indeed, at just a fraction of a percentage point” (p. 492). The coverage for the 6,000 level is 0.70%, 0.32% for the 10,000 level, and 0.10% for the 14,000 level. The authors believe that the low-frequency vocabulary beyond the 9,000 level is “not typically useful enough to warrant an explicit focus” (p. 498). This has clear implications for measures of vocabulary size and raises the question of whether or not to include levels beyond the 6,000- or 10,000-word frequency in the tests. The development and administration of these frequency levels seem to be inappropriate and lack practicality. It would be a waste of time and energy for the test takers, particularly the lower proficiency levels. In fact, the newly developed test of vocabulary size—the NVLT (Webb et al., 2017)—eliminated the 10,000-word level on the grounds that “the five most frequent levels may represent the greatest range in vocabulary learning for the majority of L2 learners” (Webb & Sasao, 2013, p. 266). The VLT, therefore, seems to be more realistic in measuring the vocabulary size of the learners as it does not test vocabulary size beyond the 10,000 level. Moreover, the results of this study further showed that this measure was more correlated with the L2 depth of vocabulary knowledge because, as previous studies have found, knowledge of higher word-frequency levels is more correlated with measures of vocabulary depth.
Conclusion
This study demonstrated that among the three measures of vocabulary size, the VLT had the highest correlation with the L2 depth of vocabulary knowledge. It further showed that the VLT had the most predictive power for the dependent variable. The higher word-frequency levels of the three tests in general, and the VLT in particular, were predictive of the students’ performance on the WAT, which measures the L2 learners’ knowledge of different elements of vocabulary knowledge such as synonyms (paradigmatic links), collocations (syntagmatic links), and meaning components (analytic relations). The findings also demonstrated that the 3,000-word-frequency level, which has been identified as the high-frequency English vocabulary that includes a high rate of coverage (nearly 90% of the written and spoken text; Schmitt & Schmitt, 2014), significantly contributed to the performance on the WAT.
The overall results have implications for teachers, test developers, and researchers. The use of the VLT is recommended for measuring the vocabulary size of L2 students, especially those with lower levels of language proficiency and knowledge of higher word-frequency levels. However, for students with higher language proficiency and larger vocabulary sizes, using the VST, particularly the bilingual versions, is suggested as it measures the knowledge of lower frequency vocabulary. Notwithstanding, it should be noted that because, as this study found, lower word-frequency levels do not correlate with L2 depth of vocabulary knowledge, taking all the fourteen 1,000-word-frequency levels of the VST would not be necessary for the test takers. In other words, depending on the proficiency level of the students and/or participants, the teachers and researchers should consider administering only a limited number of the word-frequency levels of the bilingual versions of the VST.
A number of limitations may have constrained the generalizability of the findings, which should be taken into account by future studies. First, the language proficiency of the participants was mostly the same as they were all university students who had been homogenized by passing the university entrance examination and further identified as having high lexical proficiency by passing the cutoff score of the 2,000-word frequency of the VLT. Future studies could find the interaction of the three measures of vocabulary size with L2 depth of vocabulary knowledge for students with varying levels of language proficiency. This can show more reliable results concerning the suitability of each of the three tests of vocabulary size for students with different levels of language proficiency. In addition, the data of this study were collected from a convenience sample of 122 undergraduate students. Future research can thus use a more representative sample and be conducted in other contexts using larger groups of participants. In addition, as the WAT does not measure all aspects of vocabulary knowledge, such as derivatives and affixes, further studies can investigate the relationship of the VSTs with tests like the Word Part Levels Test (WPLT) developed and validated by Sasao and Webb (2017).
Footnotes
Declaration of Conflicting Interests
The author(s) declared no potential conflicts of interest with respect to the research, authorship, and/or publication of this article.
Funding
The author(s) received no financial support for the research, authorship, and/or publication of this article.