
Abstract
Although water is an essential commodity with virtually no substitute, poor bill payment on the part of water utility customers is constraining the effort of water utility companies, especially those in developing countries to sustain and expand its provision. In this backdrop, this article investigates the interrelationship and impact of a set of attitudinal and institutional factors on the bill payment behavior of water utility customers of Ghana. A conceptual model of payment behavior is developed and tested using data from a cross-sectional survey of households in the Greater Accra Region of Ghana (GARG) and the billing records of Ghana Water Company Limited (GWCL). Among the constructs considered in the analysis, service quality, corporate image, and monitoring and control are found to be the major determinants of customer satisfaction toward the water utility, which in turn, together with the direct influence of monitoring and control measures and transaction time at bill payment points, explains a significant part of the total variation in water customers’ bill payment behavior. We provide in-depth discussion and policy implications of our findings.
Introduction
Water and sanitation are important ingredients for sustainable development. In particular, water is needed for food, energy, and industrial production (United Nations Water [UN-Water], 2016; World Health Organization [WHO], 2016). Despite the importance of water to people, it is estimated that by 2050, at least one in four people, especially in developing countries, will be affected by infrequent water supply (Marson & Savin, 2015; United Nations Development Programme [UNDP], 2016)—a situation that will potentially undermine people’s health and dignity, and consequently exacerbate the already precarious economic conditions in those countries.
In recognition of this looming danger, the United Nations General Assembly in its recently adopted sustainable development agenda, known as the Sustainable Development Goals (SDGs), correctly sets out to “ensure availability and sustainable management of water and sanitation for all” (SDG 6; UNDP, 2015). However, until the much-needed investments are made in the water sectors of developing countries, this goal is unlikely to be met. For example, the UNDP (2015) reports that, until adequate investments are made in water infrastructure, it will be difficult for water utilities to ensure universal access to safe and affordable drinking water for all by 2030.
Water utilities in developing countries are often capital constrained, and hence, their service provisions as well as required investment in infrastructure largely depend on customers’ patronization as reflected in their timely payment of water bills. If customers default on their payments and/or are unable to pay their bills in a timely manner, the water utilities in these countries are more likely to face serious cash flow problems in maintaining sustainable water services (Sualihu & Rahman, 2014b). In this backdrop, it is imperative that water utilities fully appreciate the factors that affect the patronage behavior of their customers to avoid delayed or irregular payment of water bills. However, little empirical research exists in the literature investigating the factors influencing customer decisions when it comes to paying water bills in time (Mugabi, Kayaga, Smout, & Njiru, 2010). In this article, we aim to contribute to this strand of the literature by analyzing the influence of a set of attitudinal and institutional factors on the bill payment behavior of water utility customers of Ghana, a lower middle-income country.
Following the lead from the service marketing literature, previous studies (viz., Kayaga, Franceys, & Sansom, 2004) have tried to understand the effect of different attitudinal variables such as service value, service quality, corporate image, and customer satisfaction on customers’ loyalty toward water utility and their bill payment behavior. However, in the context of the theory of planned behavior (TPB; Ajzen, 1991), Mugabi et al. (2010) suggest that, in addition to customers’ general attitude toward bill payment, some service issues that are largely within the control of water utility managers may also affect their timely bill payment. Therefore, our approach in this article is more integrated, in the sense that, we study the effect of some key attitudinal variables and service issues (which are mainly institutional in nature) simultaneously to understand the variation in water customers’ bill payment behavior. To this end, we first undertake a review of related literature to identify a set of important attitudinal and institutional constructs that is not only potentially useful in explaining the actual payment behavior but also quite amenable to the influence of the water utility. The rationale for these selection criteria is that, by isolating the factors under its influence, the water utility would be able to implement more realistic strategies to promote timely bill payment. Subsequently, based on the background knowledge from the literature, we propose and test a conceptual relationship among the factors considered in the study.
Literature Review
A water utility’s failure to collect bills on a timely basis may result from a range of factors; some of which may be viewed as entirely under the control of the utility (such as the billing issues and monitoring and control activities), some only partially under the control of the utility (such as the willingness of water customers), and some others completely beyond the control of the utility (such as the social and demographic profile of the customers). To be consistent with the focus of the study, this section reviews related literature that helps identify some factors that a water utility may influence at least to some meaningful extent.
Customer Satisfaction and Behavioral Intentions
Customer satisfaction is a consequence of purchase and consumption arising from the buyer’s comparison of the rewards and costs of the purchase in relation to the expected consequences (Bolton & Drew, 1991). Customers are able to tell whether or not they are satisfied with a product by comparing the benefits they get from using the product relative to its costs (Bolton & Drew, 1991). Oliver (1980) notes that customer satisfaction or dissatisfaction arises from the difference between prior expectations and actual performance (Oliver, 1980). Bolton and Drew (1991) argue that expectations, performance appraisals, and disconfirmation are possible determinants of customer satisfaction or dissatisfaction, and conclude that customers’ assessments of continuously provided services, such as water utilities, may depend on only performance evaluations. Therefore, in the context of this study, we measure customer satisfaction based on the customers’ evaluation of the performance of the water utility.
In a comprehensive study on the relationship among and between the major consumer judgmental constructs in the context of a service industry, Cronin, Brady, and Hult (2000) show that customer satisfaction is positively associated with behavioral intentions. The authors’ findings are borne out by the results of several other prior and subsequent studies on customer satisfaction and various indicators of behavioral intentions such as customer loyalty, repurchase intention, and switching behavior (e.g., Andreassen & Lanseng, 1997; Caruana, 2002; Richard & Zhang, 2012; Srivastava & Sharma, 2013). Therefore, in the context of a utility company, it may be argued that the more consumers are satisfied with service provision, the more likely they are to pay their bills on time. Sualihu and Rahman (2014b) conclude that higher customer satisfaction is associated with higher bill payment. As such, it is hypothesized that customer satisfaction is likely to be positively associated with customers’ behavioral intentions, ceteris paribus.
Service Value and Customer Satisfaction
In her exploratory study, Zeithaml (1988) suggests that “perceived value is the customer’s overall assessment of the utility of a product based on perceptions of what is received and what is given” (p. 14). If perceived service is comparable with the concept of perceived product value, then service value can be considered to involve the trade-off between a customer’s evaluation of the benefits of using a service and its cost (Bolton & Drew, 1991). Whereas the benefits are made up of physical attributes, service attributes, and technical support available from the supplier, the costs are the sacrifices the consumer makes when making the purchase (Kayaga et al., 2004; Ravald & Grönroos, 1996).
Given that service value is crucial for customers in all successful exchange transactions (Holbrook, 1994), other things remaining unchanged, customer perception of improved value in a service encounter is expected to lead to increased customer satisfaction and more favorable behavioral intentions. In line with this argument, Brand, Cronin, and Routledge (1997) conclude that there is a positive correlation between service value and customer satisfaction. Similarly, Cronin et al. (2000) also present evidence of the role of service value as a causal antecedent of customer satisfaction. In addition, because perceived benefits from using a service are likely to be influenced by service quality attributes, some studies also emphasize the role of service value as a mediating variable in the relationship between service quality (discussed shortly) and customer satisfaction (e.g., Bolton & Drew, 1991; Lee, Lee, Lee, Park, & Moon, 2004). Thus, service value is likely to influence customer satisfaction positively, ceteris paribus.
Service Quality and Customer Satisfaction
Much of the research on customers’ attitude toward services has focused on perceived service quality (e.g., Dabholkar, Sheperd, & Thorpe, 2000; Wang & Shieh, 2006). Perceived quality is seen as a customer’s assessment of the overall excellence or superiority of the service (Zeithaml, 1988). Accordingly, perceived service quality is the degree to which a service meets or exceeds customers’ expectations. Following Kayaga et al. (2004), we use a blend of technical quality and functional quality indices to measure service quality. Whereas technical quality is what a customer receives in his or her interaction with the service firm, functional quality describes how service is delivered to the consumer.
There seems to be a broad consensus emerging in the services management literature that service quality is a major determinant of overall customer satisfaction. Indeed, numerous studies document a significant positive relationship between these two judgmental constructs in the context of, for example, the commercial airline industry (Ostrowski, O’Brien, & Gordon, 1993); a variety of consumer service firms (Anderson, Fornell, & Lehmann, 1994; Fornell, 1992); the banking, pest control, dry cleaning, and restaurant services (Cronin & Taylor, 1992); the photographic services (Dabholkar et al., 2000); the professional accounting services (Hong & Goo, 2004); and the university library services (Wang & Shieh, 2006). We are not, however, aware of any study in the context of water utility services that empirically tests the effect of customers’ service quality judgment on outcome variables such as satisfaction and subsequent behavioral intentions. Therefore, service quality is more likely to positively influence customer satisfaction, ceteris paribus.
Corporate Image and Customer Satisfaction
Corporate image is the way an organization is presented to or perceived by its members and the public (Andreassen & Lindestad, 1998). Dowling (1986) notes that corporate image can be aided by the information (communications) provided by the firm, as well as managerial attitudes and philosophy. Accordingly, it enables a company to engage more effectively in maintaining and improving the relationship with its customers, and thereby helps to improve customers’ attitude toward the company. An improved customer attitude is expected to reflect favorably on customer satisfaction and behavioral intentions.
Srivastava and Sharma (2013) report a positive association between corporate image and customer satisfaction in the context of Indian telecommunication industry, suggesting that higher corporate image results in a greater customer satisfaction, which in turn leads to high repurchase intention and less switching behavior. Similarly, Richard and Zhang (2012) also report that corporate image has a positive effect on customer commitment and customer satisfaction in the New Zealand travel service industry. Thus, in this study, corporate image is likely to positively influence customer satisfaction, ceteris paribus.
Billing Issues and Payment Behavior
Most utility companies provide bundle of services to their clients (Grönroos, 1984) and the water utility is no exception. Hence, issues relating to tariff setting, meter reading, billing, and payment options form an important part of facilitating and support services for water utilities. In an exploratory study of five small urban water utilities in Uganda, Mugabi, Kayaga, and Smout (2007b) identify that bill delivery, dependability or correctness of meter reading and bills, clarity of bills, flexibility, and choice in payment options are among the main factors that customers believe to be the facilitators of, or barriers to, timely payment of their water bills. These issues, which we may collectively term as the billing issues, if not managed properly, may easily add to customer dissatisfaction and eventually lead to more delayed payments (or outright nonpayments) and poorer revenue performance for the utility. Chipofya, Hoko, and Gustaff (2009) argue that utilities do not achieve efficiency in billing because they do not employ appropriate billing practices. If so, then one could argue that it is the reason for the abysmal bill payment on the part of consumers (Sualihu & Rahman, 2014a).
In addition to behavioral and institutional constructs such as those reviewed in the preceding paragraphs, Mugabi et al. (2007b) and others (e.g., Kayaga, Calvert, & Sansom, 2003; Waldron, 2011) argue that some other institutional factors, namely, transaction time of customers at the bill payment points and monitoring and control measures on the part of water utilities, may also play critical independent roles in determining customers’ satisfaction level and their bill payment behavior. For example, a reduction in the transaction time at bill collection centers is likely to increase customers’ satisfaction levels and encourage water utility clientele to pay off their bills on time. Sualihu and Rahman (2014b) find that a reduction in transaction time at bill collection centers does not only increase the satisfaction level of customers but also reduces the number of days it takes utility customers, on average, to pay off their bills after presentment. Furthermore, it is also argued that if utility companies step-up their monitoring and control roles, they are likely to detect faults such as metering errors and burst pipes, and fix them on time (Waldron, 2011). This would not only increase the level of customer satisfaction toward the water utility but also reduce the unusual delays in customers’ bill payment. Therefore, transaction time and monitoring and control are more likely to negatively influence bill payment behavior.
Framework of Analysis
Timely payment of bills can be viewed as a clear manifestation of patronage intention of water customers. Several research perspectives suggest customers’ behavioral intention to patronize to be the primary predictor of their actual patronizing behavior. Many researchers, especially in service marketing literature, rely on the expectation confirmation theory (Oliver, 1980) to explain patronizing behavior, and suggest customer satisfaction as the most important driver of the customer’s favorable behavioral intention (see, for example, Cronin et al., 2000). Although this framework contributes significantly to understanding customers’ patronage behavior, it is clearly based solely on customer’s evaluative judgment on previous service encounters.
The TPB (Ajzen, 1991), however, recognizes that actual behavior in many contexts may not entirely be dependent on an individual’s volitional behavioral intentions, but may be influenced by factors that are external to one’s volitional control. Specifically, the theory suggests that customer behavior is guided by behavioral intention as well as perceived behavioral control, whereas behavioral intention is jointly determined by customer’s attitude toward the behavior, subjective norm (perceived social influences on intended behavior), and perceived behavioral control (perceived ease or difficulty in carrying out intended behavior). Clearly, to the extent customer satisfaction helps form the attitude toward the behavior, the TPB appears consistent with the expectation confirmation model, but it enriches consumer behavior analysis with the inclusion of potentially important social influences and perceived behavioral control. Previous repatronage literature indeed finds that, in influencing behavioral intention, the attitude toward the behavior, especially formed through previous consumption experiences (customer satisfaction) is more relevant and predominant than the general attitude toward the behavior (e.g., Kim, 2010; Lai & Chen, 2011).
Although the TPB identifies the role of subjective norm in determining behavioral intention, some researchers argue this to be the weakest component of the theory (Armitage & Conner, 2001). In practical applications, including that in the analysis of patronage intentions, the connection between subjective norm and behavioral intention is often quite mixed (Bagozzi & Dholakia, 2002; Choo, Ahn, & Petrick, 2016). In contrast, the role of perceived behavioral control appears overriding in influencing patronage intentions such as the intention to pay water bills. For instance, although a water customer has positive attitude and perceived social pressure to pay bills on time, he or she may find it difficult to carry out his or her intention due to lack of monitoring and control on the part of water utility, billing irregularities, or prolonged transaction time at payment centers. A number of previous studies have demonstrated that patronage intentions will be higher when an individual holds greater control over performing patronage behavior (e.g., Hansen, 2008; Liao, Chen, & Yen, 2007; Mugabi et al., 2010).
In this article, we draw on the essence of both the expectation confirmation theory and the TPB and examine the effect of Ghana Water Company Limited (GWCL) customers’ volitional behavioral intention and nonvolitional behavioral control on their bill payment behavior. In keeping with the literature reviewed in the previous section, relevant predictor variables having a direct and/or indirect effect on payment behavior are postulated to be service quality, service value, corporate image, utility billing, monitoring and control, transactional time, and customer satisfaction. These variables are presumed to be associated with each other as shown in Figure 1.
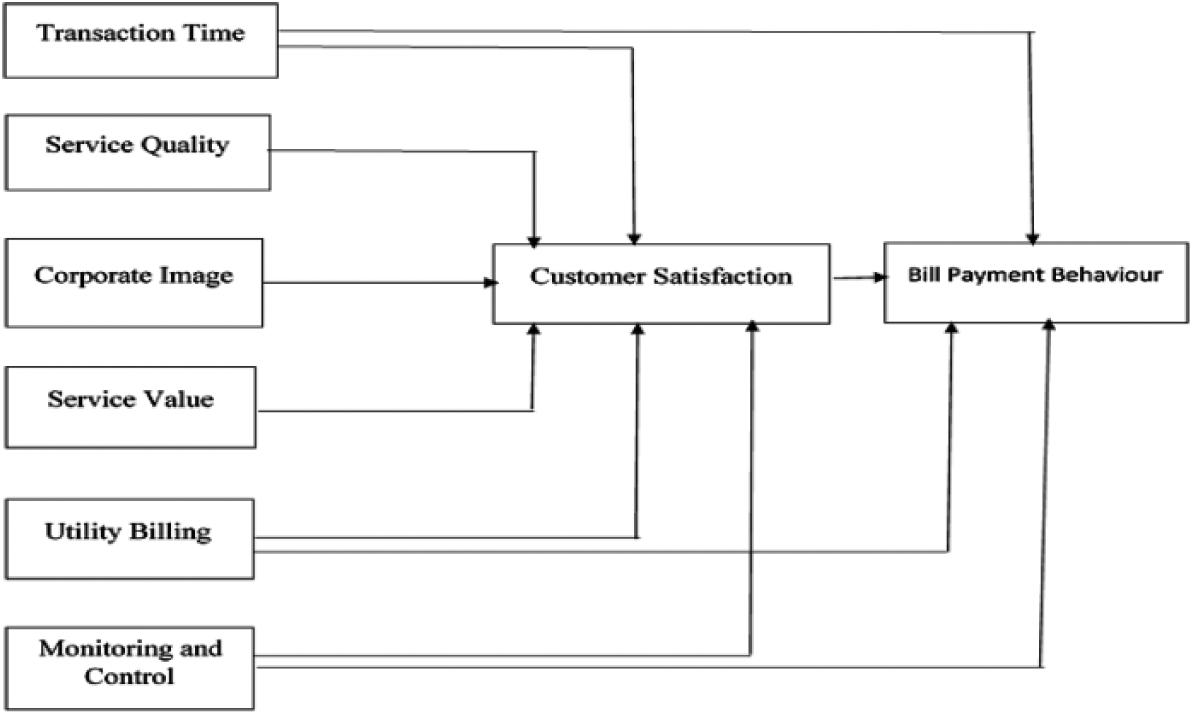
Conceptual framework of the study.
As is evident in Figure 1, customer satisfaction in this study is conceptualized as an outcome of the influences of other predictor variables, which in turn is expected to affect customers’ behavioral intentions as reflected in their decisions to pay water bills on time. However, in line with the TPB, customers’ bill payment behavior is not assumed to be entirely under their volitional control (customer satisfaction) but is allowed to be influenced (directly and indirectly) by nonvolitional external institutional factors such as curtailing the transaction time at bill payment centers and an intensive monitoring and control mechanism and appropriate billing system on the part of water utilities.
Research Objectives
Consistent with the conceptual framework of analysis, three specific objectives guide our study—(a) identifying the principal factors that influence customer satisfaction of water services in the Greater Accra Region of Ghana (GARG), (b) determining whether endogenously determined customer satisfaction levels translate into an expedient actual bill payment behavior, and (c) examining whether, in addition to their indirect influence through customer satisfaction, institutional variables such as billing issues, transaction time, and monitoring and control have a direct effect on customers’ bill payment behavior.
Method
Data Source
A sample of 150 households is obtained from GARG out of a population of 228,165. The operational areas of the GWCL in the GARG are divided into three, namely, Accra East, Accra West, and Tema regions, with customer populations of 84,698, 80,582, and 62,885, respectively. Of the three regions, the Accra East region is randomly selected, and, the sample for the study is then obtained from the list of customers of the Accra East region using a systematic sampling technique, which is considered very appropriate in a household survey (Cooper & Schindler, 2003). To do this, we randomly begin with a household from the list of customers and then systematically sample every 565th (84,698/150) household from the population of customers (i.e., total list of customers) until a sample of 150 households was obtained. Therefore, in a sense, a two-stage sampling technique is used. The billing systems of the customers in the region are computerized, and that makes the sampling process quite simple and easier to be carried out.
The Questionnaire
A self-developed survey questionnaire is used in the study. To develop the instrument, a literature review is conducted to determine the constructs that are necessary to be included in the instrument. In addition to using the literature review, the engagement of the personnel of the Customer Service Directorate (CSD) of the GWCL helps in the design of the instrument. In a pilot study, the questionnaire is sent out to 60 customers of the GWCL in the GARG. The data obtained from the pilot study help in assessing the validity and reliability of the instrument before it is used for the main study. The questionnaire has a total of 46 items divided into seven sections: The first section contains two questions for transaction time (one item) and monitoring and control (one item). For example, the questions for transaction time and monitoring and control read like “How long on average does it take you to pay your bill at payment centers?” and “How many times on average does the staff of the GWCL visit your premise and neighborhood?”, respectively. The remaining six sections capture data on quality of service (13 items), customer satisfaction (10 items), corporate image (five items), utility billing (five items), and service value (six items) as well as background information (five items). As we have indicated in the preceding section on variable construction, “a 5-point Likert-type scale with classifications from 1 (strongly disagree) to 5 (strongly agree) is used to capture data for the constructs of service quality, customer satisfaction, corporate image, utility billing and service value” (Sualihu & Rahman, 2014b, p. 483). The composite scores are then used for the regression analysis.
The reliability of the five scales of Customer Satisfaction (CS), Service Quality (SQ), Corporate Image (CI), Utility Billing (UB), and Service Value (SV) is examined using the Cronbach’s coefficient alpha. The results show alpha coefficients corresponding to these constructs are .761, .811, .855, .906, and .754, respectively. Notably, these coefficients are all greater than .7, which is considered good and acceptable (Sekaran, 2000). The composite scores of these constructs are used to run the regression analyses. Construct validity of the scales is established via exploratory factor analysis, and the dimensions extracted using the principal components method. Customer satisfaction is grouped into three subdimensions: one subdimension describing satisfaction toward “billing” and the other two describing satisfaction toward “service” and “response.” Likewise, three factors are extracted from service quality construct: one subdimension describing quality toward “employee behavior” and the remaining two describing quality related to “service” and “resources.” The corporate image construct yields one factor and is labeled “trust.” Utility billing generates two factors and they are labeled as “monetary” and “billing.” The service value construct yields two factors, which are labeled as “trust” and “service.”
Data Collection Procedure
The data are collected using a survey questionnaire. Of the 150 questionnaires sent out, we got 122 of them back. We adopted approaches such as sending regular reminders to the survey participants and providing appropriate assistance to those respondents who had difficulty in reading and/or understanding the items on the questionnaire. That resulted in the relatively higher response rate (81.33%). Our computation of the dependent variable (mean bill payment period [MBPP]), which reflects the bill payment behavior, is based on customers’ billing and payment history sourced directly from the GWCL.
With respect to the respondents’ background data, out of the 122 respondents who answer and return their questionnaires, 44.26% are males whereas 55.74% are females. Another 65.48% of the respondents claim they are educated, whereas 34.52% claim they are uneducated. 1 Also, 27.05% of the respondents report they are aged between 18 and 35 years (young adults), whereas 55.74% and 17.21% report they are aged between 36 and 60 years (adults) and above 60 years (elderly), respectively; 24.60% of the respondents have an annual income of less than GH¢ 1,000 and 20.50% have an annual income level of more than GH¢ 5,000.
Ethical Consideration
All social science research involves ethical issues. This is because research involves collecting data from people and about people, and their rights and concerns in the research process must be respected at all times (Sekaran, 2000). Ethical considerations of confidentiality and voluntary and informed consent are consciously upheld throughout the research. For instance, on the issue of the voluntary and informed consent, letters are given out to the respondents informing them about the rationale for the research, the roles they are expected to play and how the information they provide is going to be used. Questionnaires are then distributed to only those who agree to participate in the research. Besides, for the sake of confidentiality, instead of using house numbers to identify respondents, special codes are given to them to make them anonymous. Finally, the research is not sponsored by any funds from the GWCL or its affiliates.
Empirical Specification
In line with the conceptual framework (Figure 1), we estimate the following empirical model so as to appreciate the nature and extent of the influence of each of the previously defined constructs on customer satisfaction and how the latter is reflected in their bill payment behavior.


where
Variable Construction.

Source. Authors’ design.
Note. CS = customer satisfaction; SV = service value; SQ = service quality; CI = corporate image; UB = utility billing; MBPP = mean bill payment period; GWCL = Ghana Water Company Limited.
Because
Empirical Results
We begin by reporting the results of some preliminary analyses of the survey instrument and data. Specifically, before estimating the empirical specification of our interest, we provide some relevant descriptive and diagnostic statistics on the constructs we use in our regression model.
Descriptive Statistics
The descriptive statistics of the data in Table 2 provide information about the sample characteristics as captured by mean, standard deviation, minimum and maximum values, and coefficient of variation (CV) of the variables. The dependent variable in our regression model, MBPP, has a mean value of approximately 208 days. The MBPP shows a minimum value of approximately 20 days and a maximum value of 365 days. Clearly, there is a wide variation of MBPP across customers. This is supported by a relatively high value of CV of about 49%. Except for TT and MC, all variables show only a reasonable amount of variation relative to their respective mean values. The high values of CV for TT (60.91%) and MC (68.11%) are an indication of very diverse customer experiences in terms of waiting times at different bill payment points and monitoring and control activities on the part of the GWCL.
Descriptive Statistics.

Source. Authors’ computation.
Note. MBPP, TT, and MC are measured in days, minutes, and times in a year, respectively. Each of the other independent variables has been measured using a 5-point Likert-type scale, and their composite scores are used for the analysis. TT = transaction time; MC = monitoring and control; SQ = service quality; CS = customer satisfaction; CI = corporate image; UB = utility billing; SV = service value; MBPP = mean bill payment period.
Correlations depicting the magnitude and direction and linear pairwise relationship between the variables under consideration are provided in Table 3. Consistent with our conceptual framework, the mediating variable (CS) has the expected signs with each of the six predictor variables and, except for MC, they are all significant at 5% level or better. Similarly, we note that CS and TT correlate with the dependent variable (MBPP) with expected sign and the correlation coefficients are at 5% level. Although MC is found to have an expected negative correlation with MBPP, the relationship is not significant. The correlation matrix of Table 3 also helps to examine the issues of multicollinearity between the predictor variables. If the variables are highly correlated with the correlation coefficient being close to 1, then it becomes extremely hard to evaluate the true effects of the predictor variables. Accordingly, we assess the issue of multicollinearity in Table 4, and find that, although there is no notable evidence of high correlation between MC and TT or with other predictors, there are some traces of rather high and significant correlation coefficients among the other predictor variables. For instance, SV shows a positive correlation of .723 and .740 with SQ and CI, respectively.
Pearson Correlation Matrix.
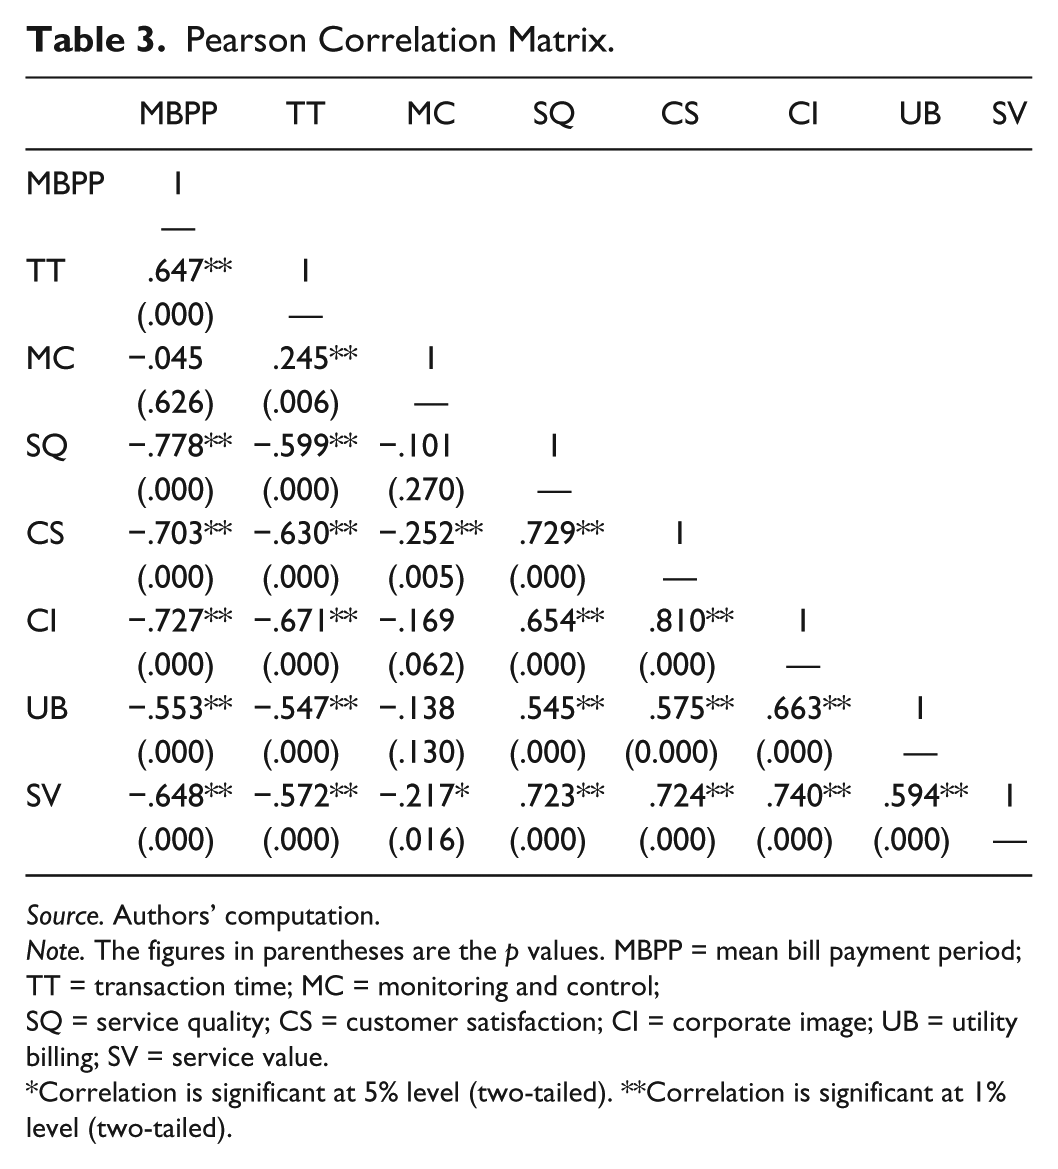
Source. Authors’ computation.
Note. The figures in parentheses are the p values. MBPP = mean bill payment period; TT = transaction time; MC = monitoring and control; SQ = service quality; CS = customer satisfaction; CI = corporate image; UB = utility billing; SV = service value.
Correlation is significant at 5% level (two-tailed). **Correlation is significant at 1% level (two-tailed).
Multicollinearity Diagnostics.

Source. Authors’ computation.
Note. VIF = variance inflation factor; TT = transaction time; MC = monitoring and control; SQ = service quality; CS = customer satisfaction; CI = corporate image; UB = utility billing; SV = service value.
Based on the high correlations between some of the variables, for example, SV with SQ and CI, we decide to investigate the issue further using the variance inflation factor (VIF), and its inverse referred to as the tolerance, for each of the predictor variables (see Table 4). Large VIF values show a high degree of collinearity or multicollinearity among the predictor variables used in a regression analysis (Hair, Black, Babin, & Anderson, 2014). Notably, our collinearity diagnostics do not show high VIF (or tolerance), as the values for the predictor variables are all below 10 (or 0.10).
Main Results
We present the findings of estimating the system of equations comprising regression Equations 1 and 2 in Tables 5 and 6, respectively. Reported results in Table 5 show that, although all the predictor variables have an expected sign of the association with CS, only MC, SQ, and CI have a statistically significant influence on CS at 1% level or better. Controlling for the effects of the other variables, the coefficient value on MC implies that an additional monitoring and control measure (measured by average number of inspections) reduces the satisfaction level of a typical water customer by 0.338 units. Likewise, significant SQ and CI coefficients imply that the CS of a customer increases by 0.258 and 1.029 units for each unit of increase in the service quality and corporate image indices, respectively. Absolute values of reported standardized coefficients show that one standard deviation change in CI results in the highest effect on CS followed by SQ and MC, respectively. Finally, the results in Table 5 suggest that the predictor variables collectively explain much of the variance in the CS (adjusted R2 = 73.0%), the significance of which is established by the overall test of the goodness of model fit (F = 93.500, p < .001).
First-Stage OLS Regression Results.

Source. Authors’ computation.
Note. The dependent variable is customer satisfaction. OLS = ordinary least square; TT = transaction time; MC = monitoring and control; SQ = service quality; CI = corporate image; UB = utility billing; SV = service value.
Significance at 5% level of significance. **Significance at 1% level of significance.
Second-Stage OLS Regression Results.

Source. Authors’ computation.
Note. The dependent variable is the MBPP. OLS = ordinary least square; TT = transaction time; MC = monitoring and control; CS = customer satisfaction; UB = utility billing; MBPP = mean bill payment period.
Significance at 5% level of significance. **Significance at 1% level of significance.
Estimation results of regression Equation 2 are summarized in Table 6. Consistent with the predictions underlying our conceptual framework, we find that all the variables except UB (TT, MC, and CS) statistically significantly (at the 5% alpha level or better) affect customers’ MBPP in expected directions. More specifically, the coefficient value on TT suggests that, controlling for the effects of the other predictors, a water customer’s MBPP increases by more than one third of a day (0.334) for an increase in transaction time by 1 min. Likewise, the coefficient value on MC implies that, ceteris paribus, each additional inspection of customers’ facilities has the potential to decrease MBPP by approximately 10 days (10.036). In addition, the MBPP of a water customer drops by approximately 9 days (9.112) when the customer satisfaction index increases by one unit. The absolute values of standardized coefficients suggest that one standard deviation change in CS results in the highest effect on MBPP, followed by that in MC and TT, respectively. The adjusted R2 value (70.63%) coupled with a significant overall F-test statistic (F = 139.630 at p < .001) suggests that the variables considered together explain much of the variations in MBPP of the GWCL customers. Finally, given our conceptual framework, two institutional variables TT and MC are presumed to have both direct and indirect effects on MBPP. In contrast, however, our empirical results in Tables 5 and 6 suggest that, whereas MC has both a direct effect and an indirect effect mediated through CS, the entire effect of TT on MBPP is of direct nature.
Discussion of Results
The results presented in Tables 5 and 6 show that MC, CI, and SQ are the major determinants of CS toward the water utility, which in turn, together with TT and MC, explains a significant part of the total variation in water customers’ bill payment behavior. The variables, in order of their direct impact on customers’ MBPP, are CS, MC, and TT, respectively.
The results indicate that, although TT does not have an influence on CS, it has significant effect on MBPP. Therefore, the entire effect of TT on MBPP is direct and no part of the effect works indirectly through its influence on CS. This finding implies that even though customers may not form a favorable attitude toward the utility company, a reduction in TT has the potential to induce customers to pay their bills early. Unlike TT, however, we find MC variable to have both a direct and an indirect (through CS) effect on MBPP. Interestingly, these two effects work in opposite direction. As part of its direct effect, increased MC activity by the water utility helps curtail MBPP to a significant extent. However, given an observed negative relationship between CS and MBPP, as part of its indirect effect through CS, increased MC tends also to prolong MBPP. 2 A positive indirect effect of MC on MBPP is not entirely surprising. Quite typical of experiences in other developing countries, many water customers in Ghana may not like their facilities to be inspected regularly for fear of being found out to be guilty of illegal connections, meter defilement, and bill accumulation. These customers are, therefore, not comfortable with frequent monitoring and control by GWCL.
Our study shows a significant positive relationship between SQ and CS. Consistent with the findings of many others (e.g., Babakus & Boller, 1992; Cronin & Taylor, 1992), this result suggests that service quality may indeed play a key role in creating a satisfied and loyal customer base for water services in Ghana. In contrast, however, our results with respect to SV seem to contradict what appears to be a consensus in the services literature that perceived service value has a positive effect on overall customer satisfaction. Our finding that SV not having an influence on CS may be due to a possibility that the construct SQ capturing the effect of SV in explaining CS. Consistent with Zeithaml’s (1988) model, several studies have shown that SQ leads to SV in a service encounter. Because a customer assesses SV by trading off the quality of service versus its cost in a given situation, the customer’s assessment of SV may largely be driven by SQ for as long as the prices for the service do not freely fluctuate. Like that of many other continuously provided service utilities, GWCL’s price changes are largely infrequent and no such changes occurred at the time of our survey. Another possible reason of the insignificance of SV in explaining CS and MBPP could be related to the general belief and attitude of many customers that the flow of water ought to be free of cost. Given the long history of either free or at least heavily subsidized water services across most low-income countries (see Kayaga et al., 2004), such attitudinal problem and consequent misplaced evaluations of value of water services on the part of customers may have distorted the relationship between SV and CS in our analysis.
The results of the study show a significant positive relationship between corporate image and customer satisfaction, which is consistent with our conceptual framework and some of the recent findings such as that of Richard and Zhang (2012) and Srivastava and Sharma (2013). However, contrary to the prediction of our conceptual framework of analysis, we do not find significant effect of UB in determining customers’ satisfaction level. One possible explanation for billing issues not having an impact on CS could be that the water customers of the GWCL have other more pressing concerns such as those related to infrequent water supply and delays in fixing frequently leaking water pipes, which weigh more in determining the overall customer satisfaction level.
Summary, Conclusions, and Recommendations
In recent years, GWCL has been going through a series of transformational reforms so as to break away from the dependence on government subsidy and to achieve financial independence. However, similar to other water utilities operating, especially in the low-income countries, the company is finding it increasingly difficult to keep its customers current with their water bills. Faced with poor cost recovery because of untimely bill payment from the customers, it has become very much of a burden on the company to continue to provide adequate service and meet an acceptable headline efficiency target (Hassanein & Khalifa, 2006). With this background, the purpose of this study is to examine the effect of a set of behavioral and institutional factors on the bill payment behavior based on a cross-sectional survey of water customers in the GARG.
Customer satisfaction is found to be the most significant direct predictor of the variation in the time taken to settle the water bills followed by monitoring and control measures and transaction time at the bill payment centers, respectively. Although an increase in customer satisfaction and monitoring and control activities induce customers to settle their water bills early, increased transaction time at bill payment centers leads to delayed payments. The conceptual model of the study also considers how the effects of a set of judgmental (service quality, service value, and corporate image) and institutional (utility billing, monitoring and control, and transaction time) variables on customers’ payment behavior are mediated through customer satisfaction. The results indicate that an increase in perceived service quality and corporate image relate positively to the level of customer satisfaction and help curtail the payment period. In contrast, however, increased monitoring and control activities are found to reduce customer satisfaction, which in turn exert an indirect negative influence on customers’ payment behavior. Our results do not support any indirect role of service value, utility billing, and transaction time in customers’ decision to pay water bills in time.
From both theoretical and managerial standpoints, these findings may have several implications. From a theoretical perspective, this study makes an important contribution to the limited literature on the factors influencing customer decision when it comes to paying water bills in time. Although the importance of some customer-centric judgmental factors such as service quality and customer satisfaction has previously been studied in models of customers’ decision to pay in time (namely, Kayaga et al., 2004; Mugabi et al., 2007b), we are not aware of any study that explicitly considers whether certain institutional factors, independently or in combination with typical judgmental factors, have a role to play in customers’ decision process. In addition to customer satisfaction, the inclusion of factors such as billing issues, monitoring and control, and transaction time in this study not only highlights the importance of these institutional factors but also provides a more comprehensive understanding of their effect on both customer satisfaction and behavioral intention as reflected in customer decision to pay water bills in time.
Form managerial perspective, one of the key lessons that can be drawn from this analysis is that cost recovery of water utilities through customers’ timely payment may be influenced by a multitude of factors. An understanding of these diverse factors affecting the payment behavior is extremely useful, especially in the context of capital-constrained water utilities operating in developing countries. The study confirms that customer satisfaction is of paramount importance in inducing customers to pay their water utility bills on a timely basis. Given our results, it seems that any particular cost recovery or bill collection strategy is unlikely to succeed if certain aspects relating to the service and the organization itself (e.g., service quality and corporate image) are not properly taken care of. Our results support the view that service quality is important in creating a satisfied and loyal customer base (Ostrowski et al., 1993). Because perceived service quality originates from customers’ expectations, it is necessary to identify customers’ expectations of service quality and incorporate these expectations into water service delivery process. In addition, we find that the customers not only need to feel satisfied because of a high perceived quality, which fulfills or exceeds their expectations, but also need to perceive some form of positive emotional attachment with the water utility. Therefore, emphasis should also be placed on improving image of the utility in the minds of the customers. Corporate image can support or undermine the value that customers believe they are getting (Abdullah, Al-Nasser, & Husain, 2000), and it is created and developed in customers’ mind through proper communication and experience of service delivery encounters (Srivastava & Sharma, 2013).
In addition, our analysis suggests that, rather than merely concentrating on customer satisfaction improvement, strategies also need to be adopted at the operational level (e.g., improving monitoring and control mechanism and curtailing transaction time). In describing management-related challenges facing water utilities in developing countries, Mugabi, Kayaga, and Njiru (2007a) correctly note that many of those utilities lack effective management information system to allow adequate monitoring and evaluation to achieve operational improvements.
Interestingly, we find that greater monitoring and control activities tend to reduce customer satisfaction level, and thereby have an adverse indirect effect on the time taken to settle water bills. This finding underscores the need for organizing various customer awareness–raising programs on a regular basis so as to help customers understand that water is just another scarce economic resource, and the water service delivery system is an essential but a very cost-intensive process. Such customer sensitization initiatives would not only ensure dissemination of more information on the process of water and sanitation provision but also help to resolve customers’ misunderstandings in appreciating the true value of water services. We also find that there is a wide variation in the number of days that customers take to pay their bills. Although some customers pay their bills within 20 days after presentment, it takes others about a year to pay their bills. This is not a good sign, as the water utility relies on these payments for its operational activities and investments.
Notwithstanding the findings of our study and their associated practical implications, the study has its own limitations. To ascertain the theoretical aspects of the proposed model of bill payment behavior, we have purposefully limited the number of antecedents to seven variables. However, we acknowledge that there may be additional variables that are potentially useful for a better understanding of customers’ attitude and their actual payment behavior, which should also be explored in future studies. In this regard, Mugabi and Kayaga (2010), for example, stress the importance of sociodemographic characteristics of the customer clientele. Another potential limitation of the study relates to the ability of cross-sectional data in establishing causal relationship, which is often questioned in the literature (see, for example, Katz, 2001; Hong & Goo, 2004). Although we have adopted a two-stage least squares approach to establish the causal ordering of the variables based on background knowledge from the existing literature, the adequacy of the proposed model depends critically on the stability (coherence) of results across time and space (Rindfleisch, Malter, Ganesan, & Moorman, 2008; Wunsch, Russo, & Mouchart, 2010). Future replication of the study is, therefore, important for testing whether and to what extent these results extend to the context of water utilities in other countries with similar socioeconomic characteristics. By doing so, the structural equation modeling, although seriously criticized by Shaver (2005), could also be used. To achieve an explicit time ordering of the cause-and-effect relationship, the use of longitudinal data in future studies would be another interesting development.
Footnotes
Declaration of Conflicting Interests
The author(s) declared no potential conflicts of interest with respect to the research, authorship, and/or publication of this article.
Funding
The author(s) received no financial support for the research, authorship, and/or publication of this article.