
Abstract
In this study, the psychometric properties of Children’s Hope Scale (CHS) scores were examined in three different adolescent samples: an academically gifted sample (n = 321), a general education sample (n = 318), and an academically at-risk sample (n = 266). In addition, score invariance across the range of achievement and gender was also examined. Results indicated that CHS scores had high internal consistency and were structurally sound across all three samples. In addition, CHS scores also showed scalar invariance across gender and measurement invariance across achievement levels. These findings suggest that CHS scores can be used and interpreted across the full range of achievement groups and that comparisons between genders can be made on the basis of CHS scores.
Academic achievement is the gold standard for measuring one’s educational standing in the United States (Aud, Fox, & KewalRamani, 2010; Morsch, 2007). As a consequence, much research has been devoted to better understanding academic achievement and to developing interventions that improve academic achievement (e.g., Aronson, Fried, & Good, 2002; Fisher et al., 1981; Hattie, 2009, 2012; Sanders & Rivers, 1996; Steele, 1997; Weis & Speridakos, 2011; Yeager & Walton, 2011). Recently, the role that psychosocial variables play in achievement outcomes has become prominent (see Yeager & Walton, 2011), resulting in a burgeoning literature on which psychosocial variables affect achievement and how they affect achievement. There have also been a growing number of academic interventions that are social-psychologically based (Yeager & Walton, 2011). Despite the increased knowledge in this area, many aspects of how perception-based psychosocial variables affect academic achievement are unknown (see Richardson, Abraham, & Bond, 2012, for a review). For instance, there are few studies that examine the generalizability of the relationship between perception-based constructs and academic achievement.
For example, several studies have shown that higher amounts of hope, a perception-based construct, is associated with increased academic achievement (Feldman & Kubota, 2015; Rand, Martin, & Shea, 2011). In one study of college students, Feldman and Kubota (2015) found that academic hope had a correlation of .69 with academic achievement. However, despite hope’s documented relationship with academic achievement, there is little research on how it relates to academic achievement across the full range of achievement levels. In addition, it is unclear if the effectiveness of achievement interventions developed for hope (e.g., Lopez, 2010; Lopez, Rose, Robinson, Marques, & Pais-Ribeiro, 2009; Lopez et al., 2004) applies to all groups of students, as the relationship between hope and achievement may differ across students with different levels of achievement.
The Children’s Hope Scale (CHS; Snyder et al., 1997) is the most commonly used hope measure. Given that validity of a scale’s scores is sample-specific (Salkind, 2012), and there is currently no evidence that CHS scores are psychometrically sound across students with differing levels of achievement, the literature is in need of a review examining this question. In addition, a study that examines invariance across groups with different achievement levels would indicate if cross-group comparisons can be made. In this article, I first review hope theory and the psychometric properties of CHS scores. Second, I discuss hope in academically gifted populations. Third, I discuss hope in academically at-risk populations. Finally, I present a study examining the psychometric properties of CHS scores in samples of academically gifted, general education, and academically at-risk students.
Hope
According to Snyder (2002), hope is a two-component cognitive motivational process defined as one’s perceived ability to achieve desirable future goals via envisioned routes. Hope is primarily measured using the Adult Trait Hope Scale (ATHS; Snyder et al., 1991) or the CHS (for those aged 8-18; Snyder et al., 1997). One of the two components is pathways, which has two parts: (a) the perceived ability to envision plausible routes (and alternate routes in case of impediment) to desirable future goals, and (b) the ability to quickly and efficiently refine those routes as goal attainment progresses (Snyder, 2002). The other component is agency, that is, one’s perceived capacity to execute envisioned routes to accomplish desirable future goals. Agency encompasses one’s motivation, persistence, and perceived ability (taking into account past goal pursues and outcomes) to accomplish the current goal being pursued (Snyder, 2002).
Pathways
Individuals who score high on the pathways component are able to quickly, decisively, and confidently envision realistic routes to their goals (Snyder, 2002; Woodbury, 1999). In addition, when envisioning routes is particularly difficult (e.g., passing a class after a poor grade on a test), individuals high in pathways engage in positive self-talk and are flexible, which facilitates their ability to envision routes and alternative routes to their goals (Day, Hanson, Maltby, Proctor, & Wood, 2010; Irving, Snyder, & Crowson, 1998; Snyder, LaPointe, Jeffrey Crowson, & Early, 1998). Conversely, individuals low in pathways are indecisive about how to accomplish their goals, envision incoherent routes to goals, and struggle to produce alternate routes to goals (Irving et al., 1998; Snyder, 2002).
Agency
Individuals who score high on the agency component are energized by their goal pursuits (Snyder, 2002). When impediments to accomplishing goals arise, high agency individuals self-motivate, are persistent, and focus their motivation and energy on what they believe is their best course of action to accomplish their goals (Snyder, 1994, 2002; Snyder et al., 1998). In contrast, those individuals who score low on the agency component generally find it harder to start working toward goals, continue toward goals, give up in difficult or stressful times of goal pursuit, and endorse more negative messages during goal pursuit (Lopez, Ciarlelli, Coffman, Stone, & Wyatt, 2000; Snyder et al., 1998).
High Versus Low Hope Individuals
In almost every regard, high hope individuals fare better than their low hope counterparts (Snyder, 2002). For example, Snyder et al. (2002) gave 200 college freshmen the ATHS at the beginning of their first year of college and then followed them for 6 years. They found that the high hope students had higher academic achievement (MGPA = 2.85 [.65] vs. 2.44 [.81]), a higher graduation rate (56.52% vs. 40.27%), and were more than 3½ times less likely to drop out over the course of the study (7.10% vs. 25%). In addition, high hope individuals have higher academic achievement at all levels of education (Snyder et al., 1991; Snyder et al., 1997; Snyder et al., 2002), are better problem-solvers (Chang, 1998), are able to handle and navigate stress better (Chang, 1998), are healthier (Harney, 1990), are better psychologically adjusted (Kwon, 2002), and have higher self-esteem (Gibb, 1990). Finally, high hope individuals generally believe they will succeed, whereas low hope individuals do not (Snyder, Shorey, & Rand, 2006). Thus, having a higher level of hope is meaningful and makes a difference.
Hope and Demographics
Several studies have examined hope score differences across race, gender, socioeconomic status (SES), and age (Snyder et al., 1991; Snyder et al., 1997; Valle, Huebner, & Suldo, 2004). Past studies indicate that hope scores on both the CHS and ATHS do not differ by SES or age (Snyder et al., 1991; Snyder et al., 1997; Valle et al., 2004). However, hope scores sometimes differ by race and gender, although the differences even when statistically significant, have a very small effect size (Snyder et al., 1997; Valle et al., 2004).
The CHS
The first iteration of the CHS (Snyder et al., 1997) consisted of 12 items, six for pathways and six for agency. After item refinement based on feedback from children and adolescents, factor analyses of CHS scores in a sample of 372 (53% male) students aged 9 to 14 resulted in three items from both the agency and pathways components being discarded due to low factor coefficients. Factor analyses of this revised CHS were supportive: agency items had high coefficients on the agency factor (.64-.85) and low coefficients on the pathways factor (.09-.21), pathways items had high coefficients on the pathways factor (.52-.85) and lower coefficients on the agency factor (.02-.41), and the two subscales accounted for 58% of the variance in the scores. The six-item CHS was given five more samples: three school-aged clinical samples of 91, 143, and 170 participants aged 8 to 17 and two samples from public schools in Lawrence, Kansas, of 74 and 322 aged 9 to 13. The results in these samples were similar to those reported in the initial sample. In these additional samples, a similar pattern of factor coefficients was reported. Internal consistency estimates for scores on pathways and agency ranged from .72 to .86 (Mdn = .77), and test–retest correlations over a week and a month were .73 (n = 89, p < .001) and .71 (n = 359, p < .001), respectively. The reported correlations between agency and pathways ranged from .47 to .70 (Mdn = .59).
Convergent validity was established with scores on the Self-Perception Profile for Children (Harter, 1985), the Children’s Attributional Style Questionnaire (Kaslow, Tanenbaum, & Seligman, 1978), and the Child Depression Inventory (Kovacs, 1985). CHS scores correlated positively with students’ perceived competence and control (.22 ≤ r ≤ .59), the propensity to distance one’s self from negative outcomes (r = .24, p < .01), self-worth (.23 ≤ r ≤ .55), and depression (−.27 ≤ r ≤ −.48; Snyder et al., 1997). As evidence of discriminant validity, Snyder et al. (1997) reported that CHS scores did not have meaningful or statistically significant associations with hopelessness (−.24 ≤ r ≤ −.18) or intelligence (.03 ≤ r ≤ .04). Snyder et al. (1997) concluded that CHS scores showed sound psychometric properties across their samples.
Valle et al. (2004) revaluated the CHS using confirmatory factor analysis (CFA) in two samples. In the first sample, made up of 460 socioeconomically and ethnically diverse high school students aged 15 to 19, Valle et al. (2004) reported that fit for the two-factor model, χ2(8) = 56.01, p < .0001, goodness of fit index (GFI) = .961, comparative fit index (CFI) = .949, Tucker–Lewis index (TLI) = .872, root mean square error of approximation (RMSEA) = .135, was significantly better than the fit for the one-factor model, χ2(6) = 73.7, p < .0001, GFI = .948, CFI = .933, TLI = .874, RMSEA = .133,
Giftedness and Hope
Students have been identified as gifted in several different ways (see Subotnik, Olszewski-Kubilius, & Worrell, 2011, for review). Some systems use high intellectual potential measured by scoring higher than a specific IQ cutoff score (National Association for Gifted Children, 2009). Others use multiple indicators, including academic performance and teacher recommendations (Worrell, 2000b). Whatever the basis for classification, studying gifted students allows researchers to see and understand a subset of the population that is performing at a high level, providing researchers with key insights into how processes, concepts, and constructs can go wrong, and how to improve them. A literature search yielded only two studies of hope in gifted samples.
Vialle, Heaven, and Ciarrochi (2007) examined the relationship of personality factors including hope using the CHS, social support, and emotional well-being to academic achievement in 65 gifted (as measured by standardized tests of achievement) and 625 nongifted middle school students. They found that although hope had a higher correlation with academic achievement for gifted students than nongifted students (r = .42 vs. .29, respectively), the difference was not statistically significant (p > .2), and mean hope scores of gifted and nongifted students were not significantly different. In a dissertation study, Holleran (2008) conducted an ethnographic study of six high school students identified as academically gifted by their school. She reported that being gifted actually encumbered these students’ sense of hope, because being identified as gifted changed the standards that they were held to, increased the intensity and level of competition they were thrust into, and intensified failures.
As can be seen, the literature on hope in gifted students is quite limited. Holleran inferred hope from interviews and it is not clear how that version of the construct matches CHS scores. Vialle et al. (2007) did not examine the factor structure or comparability of CHS scores in their two groups, perhaps due to the small number of gifted students, but their findings suggest that higher levels of hope are beneficial across groups, in keeping with the speculation in the literature (e.g., Feldman & Kubota, 2015; Lopez et al., 2004; Snyder, 2002). However, before more research on hope is conducted in gifted populations, it is important to examine if CHS scores are psychometrically sound in high achieving samples.
Academically At-Risk and Hope
Academically at-risk students generally fall into two categories that are not mutually exclusive: (a) those students who have a low level of academic achievement as measured by grade point average (GPA), standardized tests, or class rank, or (b) students who miss a substantial amount of school due to suspension, illness, or other reasons (Bridgeland, DiIulio, & Morison, 2006). Both categories of students are at high risk for dropping out of school entirely (Bridgeland et al., 2006; National Center for Education Statistics, 2001). There are a host of factors that increase the probability of a student being classified as academically at-risk. These include family SES (Lambert, 1988; National Center for Education Statistics, 2001), trauma (Salzinger, Kaplan, Pelcovitz, Samit, & Krieger, 1984), being from an ethnic group that experiences substantial discrimination (Jordan & Cooper, 2003), grade retention (Jimerson, Anderson, & Whipple, 2002), low parental education (National Commission on Children, 1991), health problems (National Commission on Children, 1991), low feelings of school belonging (Mahan & Johnson, 1983), low academic ability (Maxwell, 1997), low motivation (Dev, 1997), and low perceived future prospects (Worrell & Hale, 2001). The benefits of studying academically at-risk students are similar to the benefits to studying academically gifted students; simply put, at-risk students offer insights into why students do not achieve, how underachievement can be prevented, and how interventions can improve achievement.
Although Snyder et al. (2006) underlined the importance of hope for academically at-risk students, there have been few empirical studies that have specifically investigated hope in this population. A search of PsychINFO, ERIC, and Google Scholar returned just one article on hope and achievement in academically at-risk students. Worrell and Hale (2001) conducted a study focusing on how hope for the future affects high school drop-out rates. They found in a sample of 97 academically at-risk students that although frequency of cutting classes, GPA, time spent with friends, negative behaviors, and liking school did not predict drop-out status of these high school students, hope did. Students who had high hope for the future graduated, but those who did not, dropped out. Hope correctly predicted the drop-out status for 78% of the sample.
However, Worrell and Hale (2001) measured hope with three single-item variables that were developed just for their study. Thus, CHS scores have not been examined in academically at-risk samples, which means we do not know if the scores are psychometrically sound in this group. Using the Self-Perception Profile for Adolescents (SPPA; Harter, 1988), Worrell (2000a) showed that although SPPA scores were reliable in a not-at-risk sample, scores on several subscales had internal consistency estimates in the .50 and lower range in at-risk samples. Some researchers have suggested that hope interventions could benefit at-risk samples (Dixson, Keltner, Worrell, & Mello, 2017). The first step is to assess the psychometric properties of CHS scores to see if the scores can be used to generate valid inferences in this group.
The Current Study
In the current study, I examined the psychometric properties of CHS scores in three samples of students drawn from differing achievement levels: academically gifted, general education, and academically at-risk. This examination will provide insight into the utility of the CHS across the range of achievement. As previous research suggests that CHS scores are structurally sound, reliable, and have high factor coefficients (Snyder et al., 1997; Valle et al., 2004), it was hypothesized that CHS scores would exhibit good fit indices, high factor coefficients, and acceptable internal consistency in all three samples. In addition, it was hypothesized that CHS scores would exhibit configural, metric, and scalar invariance across achievement. Finally, although hope scores have been found to differ across gender, in keeping with the assertion that hope scores have the same meaning across gender (Snyder, 2002), it was hypothesized that CHS scores would exhibit configural, metric, and scalar invariance across gender.
Method
Participants and Procedure
Academically gifted students
The academically gifted sample consisted of 321 (60.1% female) gifted students aged 12 to 17 (Mage = 14.39, SD = 1.39) attending a summer program at a major research university in a Western state. Students were classified as gifted on the basis of GPA, standardized test scores, and teacher recommendations. Students were asked to complete surveys at the end of the 6-week program as a part of the program evaluation. Self-reported racial/ethnic groups were African American (1%), Asian American (64.6%), European American (20.5%), Hispanic American/Latino (4.7%), and Other (9.8%). The average SES of this group was 4.43, or middle class (as measured using a self-report 7-point measure of SES, 1 = poor to 7 = wealthy). Hope scores were included on the end of program evaluation survey and their use for research purposes was approved by the university’s Institutional Review Board (IRB).
General education
The general education sample consisted of a diverse sample of 318 (57.1% female) high school students aged 13 to 17 (Mage = 15.11, SD = 0.72) recruited from a large diverse high school in an urban area in a Western state. The school distributed and collected surveys from participants as a part of school improvement program. Self-reported racial/ethnic groups were African American (17.9%), Asian American (9.2%), European American (44.4%), Hispanic American/Latino (12.8%), and Other (15.8%). The average SES of this group was 4.27 on a 7-point scale or middle class.
Academically at-risk students
The academically at-risk sample consisted of 266 (38.7% female) high school students aged 12 to 18 (Mage = 15.94, SD = 1.45) who reported that they had been suspended from school at least once. Students are a subsample of students who were recruited from two large diverse high schools in an urban area in a Western state. The researcher recruited students during a free period during the school day. For those interested, the researchers sent home consent forms to their parents, which were returned to the researchers via the students’ teachers. Self-reported racial/ethnic groups were African American (9.9%), Asian American (4.5%), European American (34.7%), Hispanic American/Latino (16.1%), American Indian (27.7), and Other (7%). The average SES of this group was 3.59 or lower middle class. For participants younger than 18, assent was obtained from the participant and consent was obtained from the participant’s parents. For participants older than 18, consent was obtained from the participant.
Support for the group classification
The classification of students into the three groups were based on program enrollment, prior research, and GPA. Academically gifted students were classified based on their enrollment in a gifted program. Studies have shown that students admitted to and educated in gifted programs have different outcomes than those who do not attend gifted programs (Kulik, 2004; Lubinski, Webb, Morelock, & Benbow, 2001). The academically gifted group had the highest average GPA at 3.88 (SD = 0.36), which was statistically and meaningfully higher than the general education group (p < .001, d = 1.21) and the academically at-risk group (p < .001, d = 2.45). General education students were attending a public high school in a diverse community. The general education group had the second highest average GPA at 3.19 (SD = 0.72), which was significantly and meaningfully higher than the GPA of the academically at-risk group (p < .001, d = .88). Finally, several studies indicate that students who have been suspended from school have less favorable outcomes than those who have not been suspended (e.g., Raffaele Mendez, 2003; Shollenberger, 2015). The average GPA for the academically at-risk group was the lowest at 2.57 (SD = 0.69). None of the students in the general education and at-risk samples were classified as academically gifted and only 14.6% of students in the general education program reported skipping class more than twice a semester.
Measures
Hope was measured in this study using the CHS (Snyder et al., 1997). The CHS is a six-item instrument made up of two 3-item subscales: (a) Pathways, the ability of youth to envision paths to their goals (e.g., “When I have a problem, I can come up with lots of ways to solve it”) and (b) Agency, one’s belief in their ability to persevere on those paths (e.g., “I am doing just as well as other kids my age”). Responses range from 1 (none of the time) to 6 (all of the time), with higher scores indicating either a higher ability to envision paths to one’s goals, or a higher perceived ability to accomplish the goals one has envisioned. Missing data were handled using expectation maximization (25 iterations): 8 (0.4%) CHS scores were imputed for the gifted group, 48 (2.5%) were imputed for the general education group, and 46 (2.9%) were imputed for the academically at-risk group.
Results
Descriptive Statistics
Table 1 contains means, standard deviations, and subscale intercorrelations by sample. Mean hope scores differed by sample. The academically gifted sample reported higher agency scores than the general education sample (p < .001, d = .35) and higher agency and pathways scores than the academically at-risk sample (agency: p < .001, d = .72; pathways: p < .01, d = 27). The general education sample also reported higher pathways (p < .01, d = 28) and agency (p < .001, d = .35) scores than the academically at-risk sample. The differences among groups were substantially larger for agency scores (.35 ≤ d ≤ .72) than for pathways scores (0 ≤ d ≤ .28). The distributions of the scores were neither skewed (−.66 to −.01) nor kurtotic (−.61 to .21). The correlations between agency and pathways scores are similar to those reported in the extant literature (Gilman, Dooley, & Florell, 2006; Snyder, 2002; Snyder et al., 1997). Internal consistency estimates—both alpha and omega (see Table 1)—for hope, agency, and pathways were equal to or greater than the widely accepted .70 cutoff (Nunnally & Bernstein, 1994).
Descriptive Statistics for Children’s Hope Scale Scores.

Note. Correlations below the diagonal are for observed scores and correlations above the diagonal are for the latent constructs from the two-factor measurement model (see Table 2). CI = confidence interval.
Factor Analyses
CFAs were used to examine the structural validity of CHS scores within achievement samples. CFAs were conducted using Mplus 7.3 (Muthén & Muthén, 1998-2014) and the robust weighted least squares estimator (WLSMV), which is considered best practice for ordinal data (Byrne, 2012; Flora & Curran, 2004; Rhemtulla, Brosseau-Liard, & Savalei, 2012). The first item of each subscale for all CFA analyses was set to 1 as an anchor item. In line with Hu and Bentler (1999), several fit indices were reported for each model: (a) the chi-square, which accounts for the sizes of the correlations in the model and is a good measure of fit for samples less than 200 (Kenny, 2014); (b) the CFI, which is an incremental measure of fit that accounts for the number of parameters estimated in the model; (c) the TLI, which is an incremental measure of fit that accounts for model complexity; and (d) the RMSEA, which is an absolute measure of fit that accounts for complexity, sample size, and degrees of freedom (Kenny, 2014). Cutoffs that indicate that a model is fitting adequately are a nonsignificant chi-square (for sample sizes between 75-200; Kenny, 2014), a CFI and TLI > .90 (Marsh, Hau, & Wen, 2004), and an RMSEA ≤ .08 (Marsh et al., 2004).
Academically gifted
Table 2 contains fit indices for both theoretically plausible models for all samples. The first model, a one-factor model of hope, has been used in previous literature (Ciarrochi, Heaven, & Davies, 2007; Vacek, Coyle, & Vera, 2010). The second model, a two-factor model of hope consisting of two correlated subfactors, agency and pathways, is the theorized model of hope (Snyder, 2002; Snyder et al., 1997; Valle et al., 2004). As can be seen in Table 2, for the academically gifted sample, the two-factor model fit slightly better than the one-factor model. Although the CFI and the TLI were in the acceptable range for both models, the CFI was slightly higher for the two-factor model. Both models had a significant chi-square and the same TLI and RMSEA values. Nonetheless, the fit of the two-factor model was significantly better than the one-factor model (
Fit Indices for CHS Scores Derived From Confirmatory Factor Analyses (WLSMV).
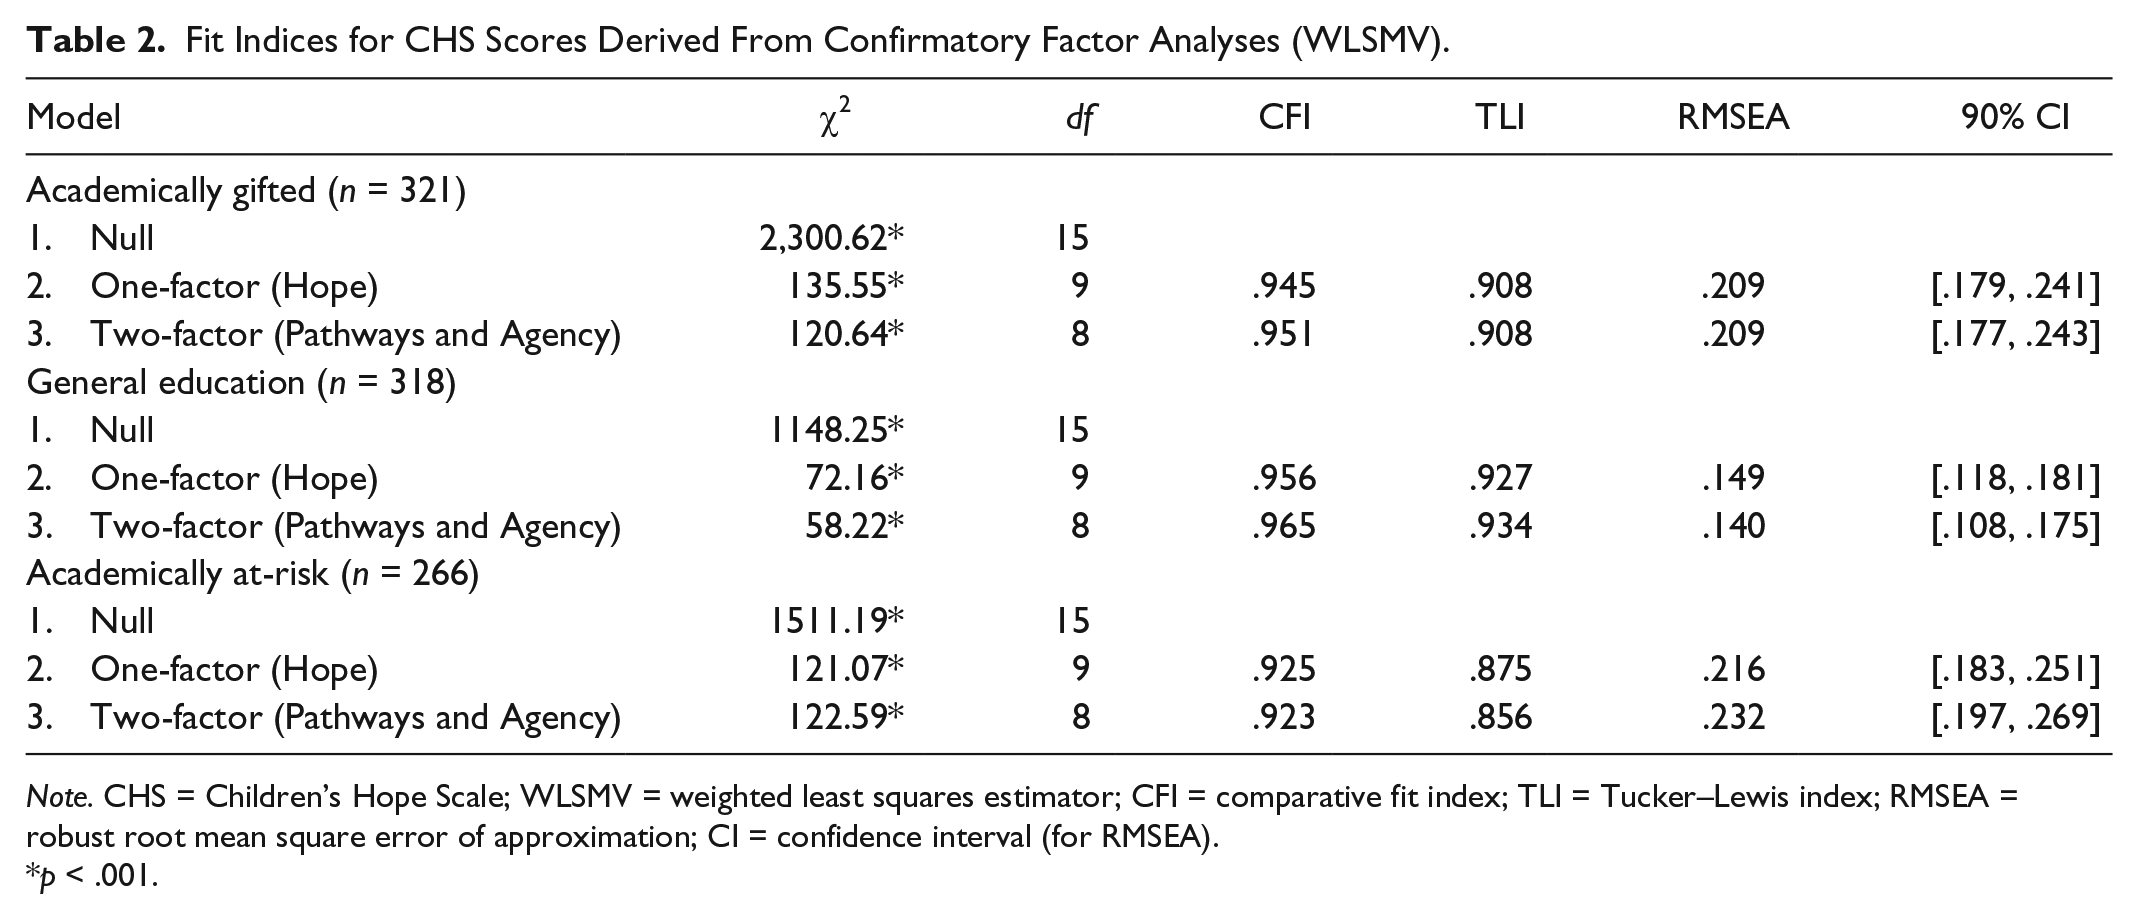
Note. CHS = Children’s Hope Scale; WLSMV = weighted least squares estimator; CFI = comparative fit index; TLI = Tucker–Lewis index; RMSEA = robust root mean square error of approximation; CI = confidence interval (for RMSEA).
p < .001.
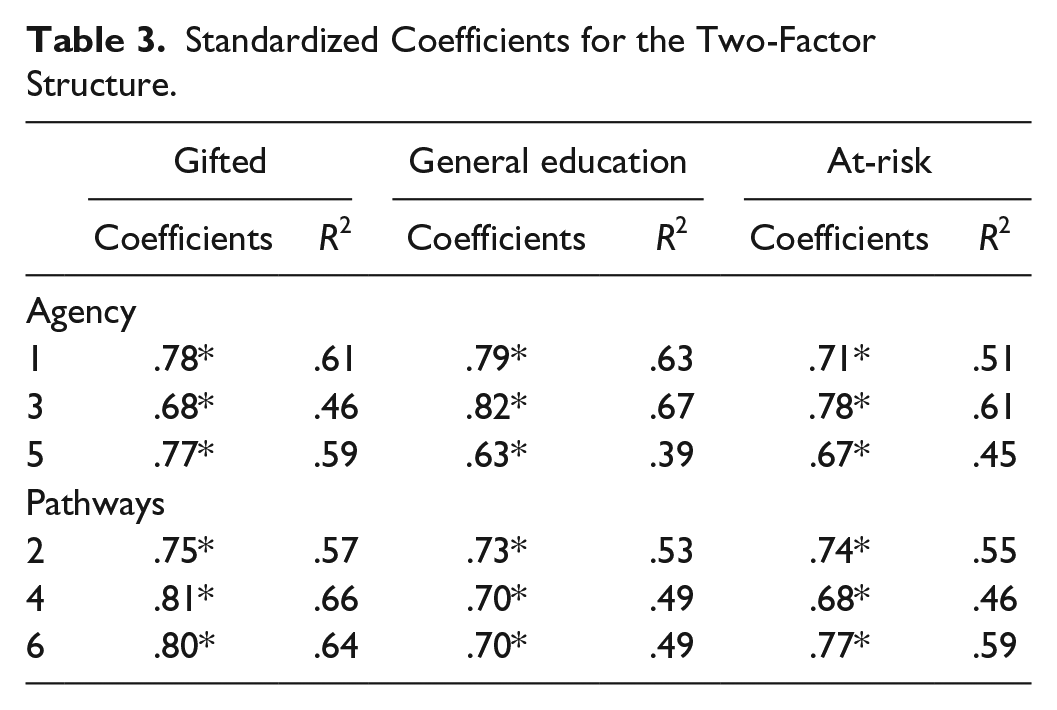
Standardized Coefficients for the Two-Factor Structure.
General education
The results for the general education sample were similar. Although both models in the general education sample had similar fit indices, the two-factor model fit the data better. The CFI for both models was in the excellent fit range, with the CFI of the two-factor model being slightly higher. The TLI for both models was in the acceptable fit range, with the TLI of the two-factor model being slightly higher. The RMSEA for both models was outside the acceptable range, with the RMSEA value of the two-factor model being slightly lower. Overall, the fit of the two-factor model was significantly better than the one-factor model (
Academically at-risk
For the academically at-risk sample, although there were minimal differences in the pattern of fit indices, the one-factor model fit the data better than the two-factor model. The CFI for both models was in the acceptable range of fit, with the CFI of the one-factor model being slightly better. The TLI for both models was in the mediocre range of fit, with the TLI of the one-factor model being slightly better. The RMSEA for both models was outside the range of acceptable fit, with the RMSEA of the one-factor model being slightly better. Both models had a significant chi-square. However, the difference between the two models was not statistically significant (
Invariance across achievement levels and gender
Multigroup CFAs were used to examine configural invariance (similar pattern of factors), measurement invariance (similar pattern of factor loadings, item intercepts, and residual variances), and scalar invariance (similar pattern of factor loadings when intercepts are constrained to equality) across gender and achievement. The outcomes of these analyses are presented in Tables 4 and 5. Hirschfeld and von Brachel (2014) asserted that invariance existed when (a) the configural model has good fit and there are significant factor loadings in all groups, (b) the measurement model has better fit better than the configural model, and (c) and the scalar model has better fit than the measurement model.
Fit Indices for CHS Invariance Across Achievement Groups Derived From Confirmatory Factor Analyses (WLSMV).

Note. CHS = Children’s Hope Scale; WLSMV = weighted least squares estimator; CFI = comparative fit index; TLI = Tucker–Lewis index; RMSEA = robust root mean square error of approximation; CI = confidence interval (for RMSEA).
p < .001.
Fit Indices for CHS Invariance Across Gender Groups Derived From Confirmatory Factor Analyses (WLSMV).
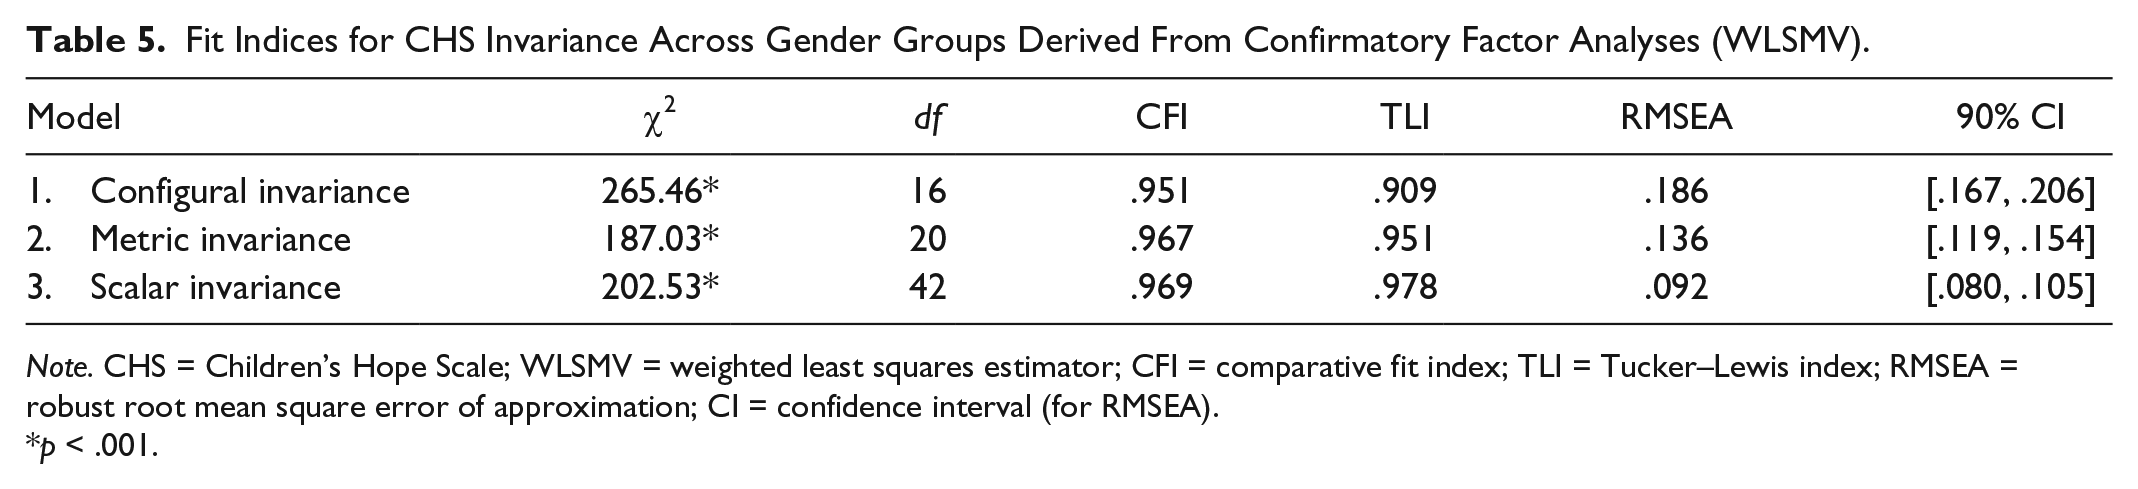
Note. CHS = Children’s Hope Scale; WLSMV = weighted least squares estimator; CFI = comparative fit index; TLI = Tucker–Lewis index; RMSEA = robust root mean square error of approximation; CI = confidence interval (for RMSEA).
p < .001.
Invariance across achievement groups is presented in Table 4. As can be seen in the table, the fit of the CFAs improves going from configural to measurement for all three indicators, and from measurement to scalar for two of the three indicators, demonstrating configural, measurement, and possibly scalar invariance. However, the CFI value decreases from measurement to scalar invariance, and follow-up difftests found that for achievement, the fit of the metric model was not significantly worse than the configural model (
For gender invariance analyses, the fit of all three indicators improved from configural to measurement and from measurement to scalar invariance, and follow-up difftests found that the fit of the metric model did not fit significantly worse than the configural model (
Discussion
This study had three main goals: (a) to examine the structural validity and reliability of the CHS in three samples that span the range of achievement, (b) to examine whether CHS scores were invariant across achievement, and (c) to examine whether CHS scores were invariant across gender. Findings indicated that pathways and agency scores were internally consistent in all three samples, the two-factor structure was significantly better in two of the three achievement groups, scalar invariance for gender on the two-factor model, measurement invariance for achievement groups on the two-factor model, and scalar invariance for pathways scores. This study provides evidence of how psychometrically sound CHS scores are across the range of achievement and supports using these scores to study the relationship between hope and academic achievement in academically gifted, general education, and academically at-risk populations. Research in these three populations will provide some insight into the relationship between hope and achievement as well as the generalizability of findings from previous research on hope and achievement.
Support for CHS Scores Across Achievement Groups
For the academically gifted and general education samples, the fit indices indicated the two-factor correlated model fit better than the one-factor model. In addition, all the fit indices for the two-factor models were either in the acceptable range or the excellent fit range, except for the RMSEA for both groups, which was much higher than the range of acceptable values. However, previous literature suggests that the RMSEA will be artificially high for models with small degrees of freedom (Kenny, 2014; Kenny, Kaniskan, & McCoach, 2015), which is the case for almost all CFAs in this study. This issue is so common for CFA models with small degrees of freedom, Kenny et al. (2015) argued against computing the RMSEA for models with low degrees of freedom at all. The factor coefficients for the two-factor model were also strong for both samples with all items having coefficients above .60. Finally, for both samples, internal consistency estimates for agency and pathways were in the acceptable range. All these findings indicate that CHS scores are structurally valid in academically gifted and general education samples as hypothesized.
For the academically at-risk sample, the one-factor model fit was slightly, although not significantly, better than the two-factor model, and in both the one-factor and the two-factor models, the TLI was below the acceptable threshold of .90. It is not clear why the TLI values were low in the academically at-risk sample. One explanation for the TLIs being below the threshold of .90 might be because it had more than 50 fewer participants than the other two samples and was the only one with fewer than 300 participants. Hu and Bentler (1995) found that when using a general least squares estimator, the TLI frequently led to the rejection of true models with dependent latent variables when the sample size was less than 500. Overall, given that the differences between the two models were negligible, theory and previous research supporting the two-factor model (Snyder et al., 1997; Valle et al., 2004), and the moderate intercorrelations between the two latent factors, the two-factor model was accepted. Factor coefficients > .65 and acceptable internal consistency estimates also indicate that CHS scores are psychometrically sound in the academically at-risk sample. Nonetheless, more research on CHS scores needs to be conducted in academically at-risk samples.
Invariance Across Achievement and Gender
It was hypothesized that the CHS scores would be invariant across achievement and gender. For gender, that is exactly what was found. Fit indices improved from configural to measurement to scalar invariance, and difftests indicated that the more constricted model did not fit significantly worse across levels. For the achievement groups, fit indices improved from the configural model to the measurement model, and the difftest indicated that the measurement model did not fit significantly worse than the configural model. However, both the difftest and one of two ΔCFI changes indicated a lack of scalar invariance. Subsequent analyses indicated that the lack of scalar invariance was driven by agency scores, and this finding is in keeping with the statistically and practically significant higher agency scores reported for the academically gifted sample in relation to the academically at-risk sample.
Conclusions and Implications
In this study, the CHS scores were shown to be structurally valid and reliable across achievement. In addition, agency and pathways scores on the CHS were shown to be invariant across gender, and pathways scores were invariant across achievement levels. These findings have several implications for research. First, this study provides evidence that the CHS is a structurally sound and reliable measure in gifted and at-risk populations. CHS scores had already been shown to be robust in a general education population (Valle et al., 2004), a finding that is supported in this study. These results support the use of the CHS in samples representing the full range of academic achievement. Second, the study indicates that agency scores are more strongly related to achievement levels than pathways, a finding that should be examined in future research.
Several scholars have asserted that hope-based research and interventions have the potential to mitigate the achievement gap through changing the perceptions and corresponding behavior of disadvantaged and at-risk students (e.g., Dixson et al., 2017; Feldman & Dreher, 2011). Furthermore, hope interventions to improve academic achievement have been found to be cheap, time-efficient, and effective, making them excellent candidates to be employed as universal interventions in schools to help raise the achievement of low hope students (Feldman & Dreher, 2011). However, given the dearth of hope research in academically gifted and at-risk populations, much more hope research needs to be done across the range of achievement to better inform hope research and hope-based interventions. This study provides evidence that researchers can use the CHS with more confidence within achievement groups, even if there is not yet strong support for using scores to compare agency scores between groups.
Second, this study informs researchers that the CHS is measuring the same construct across achievement levels. This finding is important because most of the previous hope research was conducted within general education populations, and this finding provides a solid first step toward a better understanding of whether that research is generalizable. Third, this study allows researchers to compare CHS scores across gender with confidence. Although several studies have previously investigated whether CHS scores differed across gender (e.g., Snyder et al., 1997; Valle et al., 2004), none had investigated whether CHS scores mean the same thing to the different genders. This study provides an answer to that question. Finally, this study shows that no matter where one is on the achievement spectrum, hope can be studied with the CHS.
Limitations
This study has two main limitations. First, the achievement range of the three samples could have been larger. Although adequate methodology was used to classify the three samples, it is possible that the restricted range of achievement affected the results. Second, although the sample sizes were adequate for the analyses in this study (Kenny, 2014), larger sample sizes would have been useful. Limitations notwithstanding, this study is a meaningful step forward in the hope literature.
Footnotes
Declaration of Conflicting Interests
The author(s) declared no potential conflicts of interest with respect to the research, authorship, and/or publication of this article.
Funding
The author(s) received no financial support for the research, authorship, and/or publication of this article.