
Abstract
Workplace bullying is a universal threat with statistics available at global level prominently suggesting that this phenomenon is thriving like a pandemic worldwide. Limited literature on workplace bullying from Indian perspective can be attributed to the paucity of standardized tools for investigating its prevalence. This study reports validation, psychometric properties, and cutoff scores for Negative Acts Questionnaire–Revised (NAQ-R) in Indian sample (N = 1,053). Confirmatory factor analysis (CFA) revealed a best fit three-factor model of work-related bullying, person-related bullying, and physically intimidating bullying NAQ-R demonstrated high reliability and validity using CFA and Pearson’s correlation with measures of burnout, work engagement, and perceived victimization. Two cutoff points for NAQ-R were formulated using receiver operating characteristic curve for categorizing respondents as “never bullied” (scores below 40), “occasionally bullied” (scores between 40 and 56), and “severely bullied” (scores above 56). Based on these scores, 46% of the employees were found being bullied at work, either occasionally or frequently. NAQ-R is a valid and psychometrically sound measure to examine workplace bullying in India. Clear cutoff scores may help practitioners in designing prevention and intervention strategies. As NAQ-R is the most extensively tried and tested measure of workplace bullying worldwide, the findings of the study may facilitate cross-cultural comparisons.
Introduction
Workplace bullying has been examined and researched by scholars for more than 30 years, and it continues to be an area of growing academic interest (Hurley, Hutchinson, Bradbury, & Browne, 2016; Paull & Omari, 2016). Bullying behaviors entail how an individual torments, undermines, intimidates, and frightens the person being targeted by dictating terms through physical, psychological, and emotional domination. Recognized as a universal menace to the contemporary working life (Hurley et al., 2016) with devastating effects at both individual and organizational levels (Einarsen & Nielsen, 2015; Laschinger & Fida, 2014; Nielsen & Einarsen, 2012; Nielsen, Nielsen, Notelaers, & Einarsen, 2015), identifying bullying at work requires occurrence of prolonged and persistent bullying, power imbalance between the parties with bully perceiving a power deficit in the victim (not necessarily the hierarchical power), and escalation of bully’s behavior from indirect and subtle advances to more aggressive acts ultimately resulting into severe psychological and physical process (Einarsen, Hoel, Zapf, & Cooper, 2011).
Scholarly engrossment in bullying has its roots in childhood studies (Olweus, 1978) with prime focus on bullying among tots and teens. In the late 1980s, researchers turned their attention to adult bullying within the context of workplace (Leymann, 1990) and since then it became a subject of extensive research in scholarly fields in the contemporary organizational research (Petrovic, Cizmic, & Vukelic, 2014) with the plethora of recent developments and discussions across a number of countries. Dominated by Western perspectives, literature on workplace bullying is relatively recent and scanty in Eastern as well as developing countries (Paull & Omari, 2016), particularly in India (D’Cruz, 2016b). As the issues pertaining to measurement of workplace bullying are of utmost importance (Notelaers & Einarsen, 2013), limited literature on workplace bullying from Indian perspective may draw attention toward paucity of a standardized tool to estimate prevalence of workplace bullying in India. A review of literature affirms that targets usually deny being bullied for many reasons (Jamieson, Mitchell, Le Fevre, & Perry, 2015) while reporting extensive exposure to specific acts of workplace bullying (Nielsen et al., 2009). Underreporting related to workplace bullying is a matter of concern in India also (D’Cruz, 2012, 2016a). Considering this issue, an indirect measure for the investigation of the problem in Indian service sector is essential. Owing to the sensitivity of the issue and its aftermath, Paull and Omari (2016) have cautioned to generalize findings regarding workplace bullying to different cultural contexts as the prevalence of workplace bullying has varying estimates across the world (Einarsen et al., 2011; Nielsen, Matthiesen, & Einarsen, 2010). On the positive side, understanding cultural variations in the identification of workplace bullying is also important for the effectiveness of preventive and intervention strategies (D’Cruz, Paull, Omari, & Guneri-Cangarli, 2016).
Aim of the Study
Addressing the gaps that have evolved in the literature concerning a reliable and valid measure of workplace bullying, to identify the nature and extent of the problem in India and to facilitate cross-cultural comparisons across nations using uniform standardized measures (D’Cruz & Rayner, 2015; Nielsen, Notelaers, & Einarsen, 2011; Notelaers & Einarsen, 2013), the present study was aimed at assessment of validity and psychometric properties including reliability and factor structure of Negative Acts Questionnaire–Revised (NAQ-R) in Indian sample. NAQ-R is the most widely tested and extensively used indirect measure of workplace bullying (Giorgi, Arenas, & Leon-Perez, 2011; Kakoulakis et al., 2015) that has been used in more than 300 research projects (Notelaers & Einarsen, 2013) across different sectors with more than 50,000 respondents and over 40 countries worldwide. Although an internationally acclaimed indirect standardized measure of workplace bullying (Ciby & Raya, 2015), NAQ-R has been developed in Norway (Einarsen, Hoel, & Notelaers, 2009) and tested mostly in Western countries. As national culture is an important determinant of employees’ perceptions regarding bullying behaviors at work (Escartin, Zapf, Arrieta, & Rodriguez-Carballeira, 2011), assessment of validity and psychometric properties of NAQ-R is essential before its use in Indian context. Given the nature of measurement scale underlying response categories of NAQ-R (Einarsen et al., 2009), reliability and validity assessment of the same using confirmatory factor analysis (CFA) is highly recommended (Said, Badru, & Shahid, 2011). This study is the first to report reliability and validity assessment of NAQ-R using CFA approach. As suggested by Cronbach and Meehl (1955), construct validity of the questionnaire was also confirmed by correlating the scores obtained on the measure of NAQ-R with the scores of respondents on the measures of theoretically related constructs of bullying such as work engagement and burnout using Pearson’s correlation. Work engagement refers to the strength of connection people have with their working environment which may actually buffer individuals from occupational stressors and its effects (Bakhshi & Gupta, 2016). Burnout has been defined as an extreme form of stress-related problem for employees (Figueiredo-Ferraz, Gil-Monte, & Grau-Alberola, 2013). As bullying has also been considered as a stressor at work (Hauge, Skogstad, & Einarsen, 2010), constructs of burnout and work engagement have been chosen for the assessment of convergent and discriminant validity of NAQ-R, respectively. Based on previous researches (Einarsen, Skogstad, Rorvik, Lande, & Nielsen, 2016; Laschinger & Fida, 2014), we hypothesized that NAQ-R would show positive correlations with measures on burnout and negative correlations with work engagement.
Most of the studies undertaken in different countries have measured workplace bullying using a single criterion for identification of targets from nontargets based on an objective measure (Nielsen et al., 2011), with no scope for assessing variation in the degree of severity of exposure to bullying. Bullying at work has been defined as an escalating process (Einarsen et al., 2011), providing cutoff scores for bullying assessment are, thus, consistent with the theoretical considerations of the construct. Cutoff scores based on receiver operating characteristic (ROC) curve are also essential for evaluating the diagnostic value of a measuring instrument (Hajian-Tilaki, 2013) to differentiate victims from nonvictims. In India, no such effort has been made earlier to quantify the process of workplace bullying in a broader manner. Also, with NAQ-R as a universally approved measure of workplace bullying, providing cutoff scores for NAQ-R from different cultures would facilitate cross-cultural comparisons regarding variations in the prevalence of workplace bullying. In consideration with this, the present study provided cutoff scores for NAQ-R to identify victims of workplace bullying using ROC curve analysis with a self-labeling measure of victimization that is often used in the area of workplace bullying (Nielsen et al., 2011) as a criterion reference. Further relationship between perceived victimization and exposure to bullying at work on the factors and total scores of NAQ-R was explored to confirm criterion validity of NAQ-R and to ascertain negative acts that have been considered by the targets as typical of workplace bullying.
Workplace Bullying in India
Even though workplace bullying has been identified as an important issue to consider across the world (Einarsen et al., 2011), academic literature on workplace bullying in India is limited as compared with other countries with little substantive data available on the nature, prevalence, and extent of workplace bullying in India. Empirical research on workplace bullying in India has been pioneered by D’Cruz and Rayner (2013, 2015) to examine the presence of workplace bullying in Information Technology Enabled Services-Bussiness Process Outsourcing (ITES-BPO) sector of India and providing mean score for classification of respondents on the basis of severity level using the Work Harassment Scale (Bjorkqvist, Osterman, & Hjelt-Back, 1992). D’Cruz (2012), the author of the book Workplace Bullying in India, strongly suggested that workplace bullies do exist in India and asserted that it is difficult to determine the extent of workplace bullying due to the dearth of empirical data. Apart from the ITES-BPO sector, the prevalence of workplace bullying has also been investigated in other sectors, for example, among bank employees (Gupta, 2013a), college teachers (Gupta, 2013b), IT employees (Ciby & Raya, 2014), and junior doctors (Bairy et al., 2007). Bullying still remains understudied in India and most employing organizations are woefully unmindful of its dynamics and consequences as the phenomenon has not yet gained much academic attention in India (D’Cruz, 2016b).
The concerning issue of workplace bullying among Indian workforce has also gained attention in case of several popular online outlets and more traditional trade publications (see http://www.citehr.com, http://www.ipetitions.com, and http://www.womensweb.in). Articles on workplace bullying reflecting on the nature and frequency of hostility, and mistreatment that occurs in Indian workplaces have also been published in The Times of India, The Hindu, The Indian Express, and so on. Recently, the subject of workplace bullying in India has also been highlighted in bollywood movies like Rocket Singh and to some extent in the movie Kartik Calling Kartik. This suggests that Indian settings are worthy and in need of concerted attention by researchers with respect to workplace bullying.
Measuring Workplace Bullying
Since the time of Brodsky’s (1976) and Leymann’s (1990) initial formulation of the term harassment, mobbing, or bullying, one of the major concerns has been how to assess the phenomenon under study. Behavioral (perceived exposure to bullying behaviors) and subjective (perceived victimization) measures have been the two most commonly used assessment methods for estimating prevalence of target exposure to workplace bullying worldwide (Nielsen et al., 2011). The behavioral experience method investigates exposure to bullying behaviors at work based on the frequency and repetitiveness of exposure to such behaviors within a given time. Commonly used measures among them include Leymann Inventory of Psychological Terror (LIPT; Leymann, 1996), Work Harassment Scale (Bjorkqvist et al., 1992), Workplace Aggression Research Questionnaire (Harvey & Keashly, 2003), and NAQ-R (Einarsen et al., 2009). The subjective method provides the respondents with an operational definition of workplace bullying to which the respondents are required to indicate whether they acknowledge themselves as the entity of being a victim of bullying over a period of time at work (O’Moore, Lynch, & Daeid, 2003). The self-labeling approach is more dependent on the respondent’s understanding of the bullying phenomenon and would appear insufficient in countries where the research is still at infancy and the concept is less known in general public (Giorgi et al., 2011). While focus on subjective evaluations and victim’s vulnerability as well as cultural and individual sensitivity can introduce response bias and prejudice, using an indirect bullying measure following an operative criterion for investigating exposure to a range of different negative acts at work during the last 6 months would avoid priming effects and in turn facilitate cross-cultural comparisons (Einarsen et al., 2009; Nielsen et al., 2010; Nielsen et al., 2011).
As underreporting is a serious concern in having true estimates regarding the prevalence of workplace bullying, the present study relied on NAQ-R, currently the most widely used indirect measure of workplace bullying, for investigating its prevalence in India. Each item of NAQ-R describes a typical bullying behavior that prevails in workplaces with no reference to the term bullying to preclude “cuing” the respondents and to avoid possible bias introduced by them like their level of awareness about the phenomenon or being oversensitive.
Method
Sample
For the present study, multistage sampling was used for sample selection. In the first stage, population was divided into six clusters on the basis of zonal map of India such as east, west, north, south, central, and north east zone. West and north zones were selected as two clusters out of the six for sample selection using simple random sampling. In the next stages, states, districts, and then blocks were selected from the selected clusters by simple random sampling without replacement (SRSWOR). Because it has been established that the problem of workplace bullying is almost 3 times more likely to occur in the health, educational, and social service sectors than in other occupations (European Foundation, 2002, as cited in Sloan, Matyok, Schmitz, & Lester Short, 2010; Van Heugten, 2013), information about employees working in these organizations and banking sector located in the selected blocks was procured from the offices of Registrar General of India; Chief Education Officer; Director, Health Services; Director, Social Welfare Department; Director, Statistical and Planning Department, and so on. Considering the nature of the issue being assessed and subsequent reluctance of Indian organizations to provide access to their employees for data collection (D’Cruz, 2012), only those organizations and respondents that werewilling to participate in the study were chosen for sample selection by simple random sampling. Also, as the criterion for claiming an incident as bullying involves repetitive and regular exposure to such incidents over a period of time, that is, 6 months (Einarsen, Hoel, Zapf, & Cooper, 2003), only those participants were included in the study who had more than 1 year of working experience in their present organizations. Thus, the present study explored the dynamics of workplace bullying in a multi-occupational, cross sectional randomly selected sample of 1,053 employees working in various public and private organizations of India such as education, health, social service, and banking and insurance sector. Informed consent was obtained from the participants before collection of data. Out of 1,053 respondents, 52.6% were females and 47.4% were males. Majority of respondents (35%) were in the age group of 31 to 40 years. In total, 37.4% of respondents were working in the education sector, 36.9% in health sector, 17.1% in banking and insurance sector, and 8.6% in social service sector. Of all, 52.4% of the respondents were serving in government organizations while 47.6% in the private. About 54% of the respondents were working on a temporary contract and 46% were employed on permanent basis.
Measures
NAQ-R
Exposure to workplace bullying was assessed by using revised version of NAQ-R (Einarsen et al., 2009). It consists of 22 items with responses on a 5-point scale ranging between specific temporal indicators: never, now and then, monthly, weekly, and daily. NAQ-R measures exposure to workplace bullying in terms of three factors, namely, work-related bullying, person-related bullying, and physically intimidating bullying (Einarsen et al., 2009). Work-related bullying entails negative behaviors that are directed at the target’s professional role and his or her ability to carry out work proficiently. Person-related bullying includes negative behaviors that are predominantly demeaning for the target personally whereas physically intimidating bullying enlists aggressive and negative behaviors of a more physical nature (Notelaers & Einarsen, 2013). The 23rd self-labeling item provides the respondent with a formal definition of workplace bullying (Einarsen et al., 2011) on a five-point response category such as no; yes, but rarely; yes, now and then; yes, once a week; and yes, several times a week. This is a measure of perceived victimization in relation to workplace bullying (Notelaers & Einarsen, 2013).
Utrecht Work Engagement Scale–9 (UWES-9)
UWES consisting nine items was used in the study to measure work engagement in terms of vigor, dedication, and absorption with one’s job. The scale has acceptable psychometric properties (Schaufeli, Bakker, & Salanova, 2006). A total score for work engagement is computed with the mean score ranging from 0 to 6. Higher scores on the scale indicate higher engagement of employees at work. Reliability of the scale for the present sample was found out to be .84.
Copenhagen Burnout Inventory (CBI)
Burnout was measured with the CBI (Kristensen, Borritz, Villadsen, & Christensen, 2005). The CBI centers on exhaustion and is divided into three scales. Personal Burnout enlists six items on general symptoms of physical or psychological exhaustion. Work-Related Burnout involves seven items on symptoms of exhaustion related to one’s work. Client-Related Burnout consists of six items on symptoms of exhaustion related to working with recipients or clients. All three subscales can be subtotaled into a score of 0 to 100 and averaged into a total score of 0 to 100, with a higher score indicating a higher level of burnout. For the present sample, reliability of three scales ranges from .78 to .86.
Results
CFA
Amos 18 (Arbuckle, 2009) was used to conduct CFA for model evaluation. Based on NAQ-R literature (Einarsen et al., 2009; Einarsen et al., 2011; Giorgi et al., 2011; Vukelic, Cizmic, Petrovic, Tenjovic, & Giorgi, 2015), three existing bullying models as per NAQ-R, that is, one-factor model of workplace bullying, two-factor model of work-related (Items 1, 3, 14, 16, 18, 19, and 21) and person-related bullying (Items 2, 4, 5, 6, 7, 8, 9, 10, 11, 12, 13, 15, 17, 20, and 22), and three-factor model of work-related, person-related, and physically intimidating bullying (Items 8, 9, and 22), were tested. The determination of model fit was based on a comparison of the robust versions of absolute fit indices such as chi-square statistics and the associated degrees of freedom, the comparative fit index (CFI), the goodness of fit index (GFI), the root mean square error of approximation (RMSEA), the root mean square residual (RMR), and incremental fit index such as the Tucker–Lewis index (TLI). The suggested cutoff values frequently mentioned in the literature indicating a good fit to the data include CFI and TLI ≥ .95, RMSEA< .06, and RMR < .08 (Hu & Bentler, 1999). A value of χ2/df ratio in the range of 2 to 5 demonstrates an acceptable fit between the hypothetical model and the observed sample data (Schumacker & Lomax, 2004; Tabachnick & Fidell, 2007). While reporting of chi-square value and the relative degrees of freedom is highly recommended (Savalei, 2008), other approximate fit indices are among the most popular alternate measures of fitness in structural equation modeling literature, and their use as a set provides unique information for model assessment (Chan, Lee, Lee, Kubota, & Allen, 2007; Kline, 2011).
Preliminary CFA Findings
A summary of the measurement model findings based on the CFAs of three competing models of NAQ-R is presented in Table 1. Cutoff values recommended by Hu and Bentler (1999) were adopted for these fit indices. In the present case, values of CFI/TLI indicated poor fit for single-factor model while marginal fit for two-factor and three-factor models. Other fit indices including χ2/df, RMSEA, and RMR failed to exceed the minimum threshold for fit (Table 1), indicating that the three models exhibited “poor” fit in the present sample. Thus, the three hypothesized models of NAQ-R did not adequately describe the sample data, suggesting examination of modification indices to identify potentially useful revisions to a measurement model for improving model fitness (Furr, 2011).
Initial Model Summary of CFA.
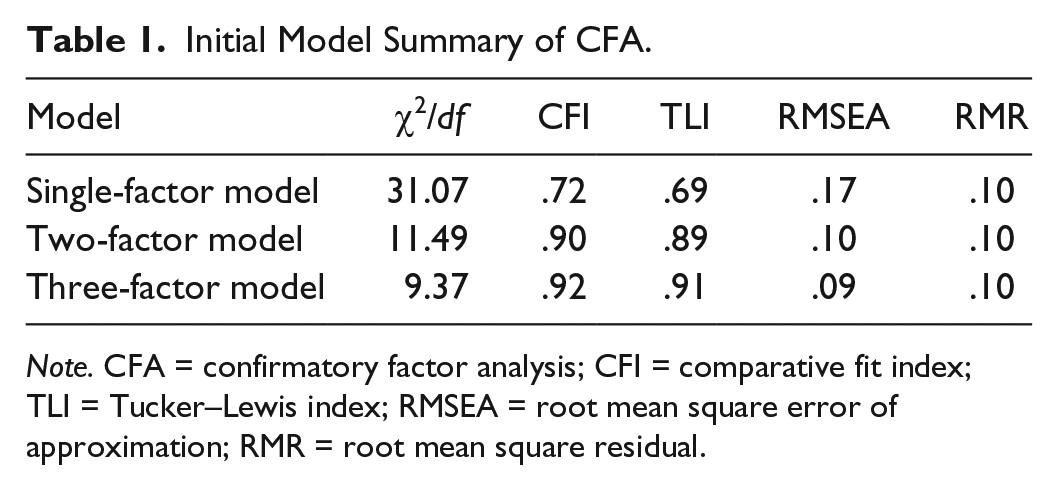
Note. CFA = confirmatory factor analysis; CFI = comparative fit index; TLI = Tucker–Lewis index; RMSEA = root mean square error of approximation; RMR = root mean square residual.
As mentioned earlier, NAQ-R has been developed and tested in a different context from India; therefore, cultural variations in the nature and understanding of the phenomenon being assessed by NAQ-R are inevitable (D’Cruz et al., 2016). While the modification indices give diagnostic information regarding problem areas of fit within a given model, model revisions based on modification indices were not attempted further as such revisions would have been inconsistent with the theoretical foundations of CFA and are generally not recommended unless supported by other residual diagnostics (Hair, Black, Babin, & Anderson, 2010). A better approach recommended is exploratory factor analysis (EFA; Hoyle, 2000). Thus, due to the inconsistent CFA results (e.g., the failure to exhibit “good” fit for the three competing models) and the lack of evidence based on Indian data for the tenability of the factor structure of workplace bullying as per NAQ-R, an EFA was performed to further review the factor structure of NAQ-R and to determine whether an alternative model would yield better fit.
EFA
To ensure the appropriateness of the data for EFA, both the Kaiser–Meyer–Olkin (KMO) measure of sampling adequacy and Bartlett’s test of sphericity were conducted. The value of KMO was 0.974, exceeding the recommended level of 0.60 (Tabachnick & Fidell, 2007). In addition, the Bartlett’s test of sphericity showed statistical significance (χ2, 231 = 22,321.36, p < .01), suggesting that the data were adequate for EFA. The 22 items of NAQ-R were subjected to maximum likelihood estimation method with oblique rotation, as the resultant factors were expected to be correlated (Einarsen et al., 2009). Using eigenvalues of greater than 1.0 (Kaiser, 1960) and Cattell’s (1966) scree test as guidelines for factor extraction, a final three-factor model emerged explaining 69.72% of the total variance. All the items were retained as each had factor loadings above .5 (Hair et al., 2010), with no cross-loadings in excess of .40. As shown in Table 2, all items loaded on the intended factor except for Item 2, which was loaded on the factor of person-related bullying. Overall, the current findings are in line with existing literature regarding factor structure of NAQ-R.
Factors, Items With Mean (SD) and Factor Loadings.

Final Model CFA Summary
After exploring the factor structure of NAQ-R in the present sample, three CFAs were run to examine the model fitness of the modified models of NAQ-R (single-factor, two-factor, and three-factor measurements) consistent with EFA findings. Table 3 depicts the approximate fit indices for the three competing models. Noteworthy is that only the one-factor model exhibited a poor fit while both the two-factor and three-factor models had excellent fit on the basis of fit indices such as CFI, TLI, GFI, RMR, and RMSEA providing support for Item 2 (Being humiliated or ridiculed in connection with your work) as an indicator of work-related bullying instead of person-related bullying. On comparing the two nested models of two-factor and three-factor structures, the chi-square difference test also showed that the three-factor model fits the present sample significantly better than the two-factor model, Δχ2(1, N = 1053) = 453.00, p < .01. Hence, the three-factor model is considered to provide the best fit to the data compared with the two-factor model on the basis of significant chi-square difference test (Pratt, 2014).
Final Model Summary of CFA.
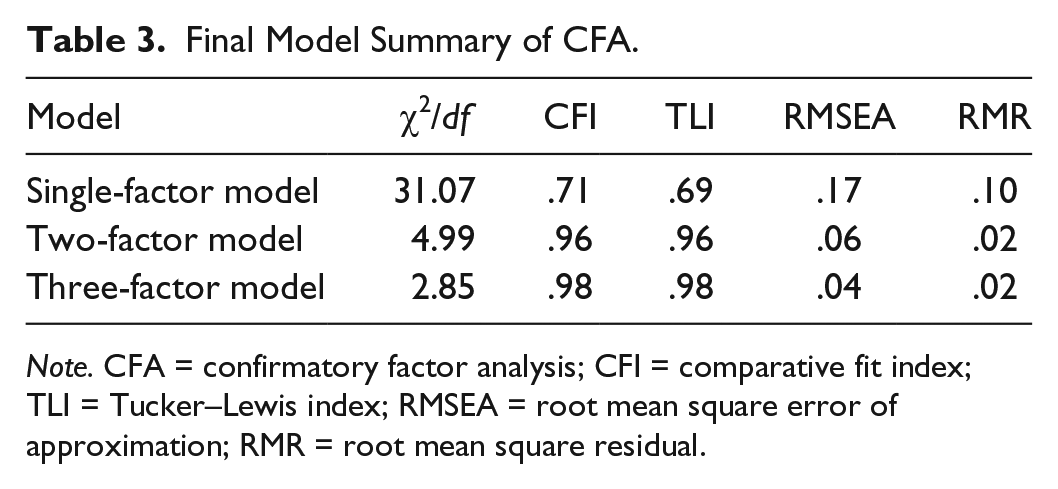
Note. CFA = confirmatory factor analysis; CFI = comparative fit index; TLI = Tucker–Lewis index; RMSEA = root mean square error of approximation; RMR = root mean square residual.
Reliability and Validity
Table 4 shows values of reliability and validity estimates based on the present sample. Reliability estimates were assessed for all the three factors. To ensure the internal consistency, Cronbach’s alpha has been used as it is the determinant of the reliability of the construct (Cronbach, 1951). All the constructs achieved excellent internal consistency exceeding the conventional cutoff value of .70 (Hair et al., 2010). Composite construct reliability was also assessed with calculated values ranging from .91 to .97 against the recommended level of .70 (Bagozzi & Yi, 1988). Furthermore, the AVEs (average variances extracted) of all constructs are well above the suggested value of .50, implying more than half of the variances in the respective constructs are explained by their corresponding measures (Fornell & Larcker, 1981; Hair et al., 2010). Thus, the acceptable values of Cronbach’s alpha, composite reliability, and AVEs provide support for the convergent validity of NAQ-R for Indian sample using CFA (Hair et al., 2010). Following the same approach, discriminant validity has been established by comparing AVEs of each construct with squared correlation of the paired constructs (Table 4). The AVEs for all constructs are greater than squared correlation thereby supporting discriminant validity, denoting each construct shares more variance with its own measures than it shares with other constructs (Fornell & Larcker, 1981; Hair et al., 2010).
Reliability and Validity Indices.
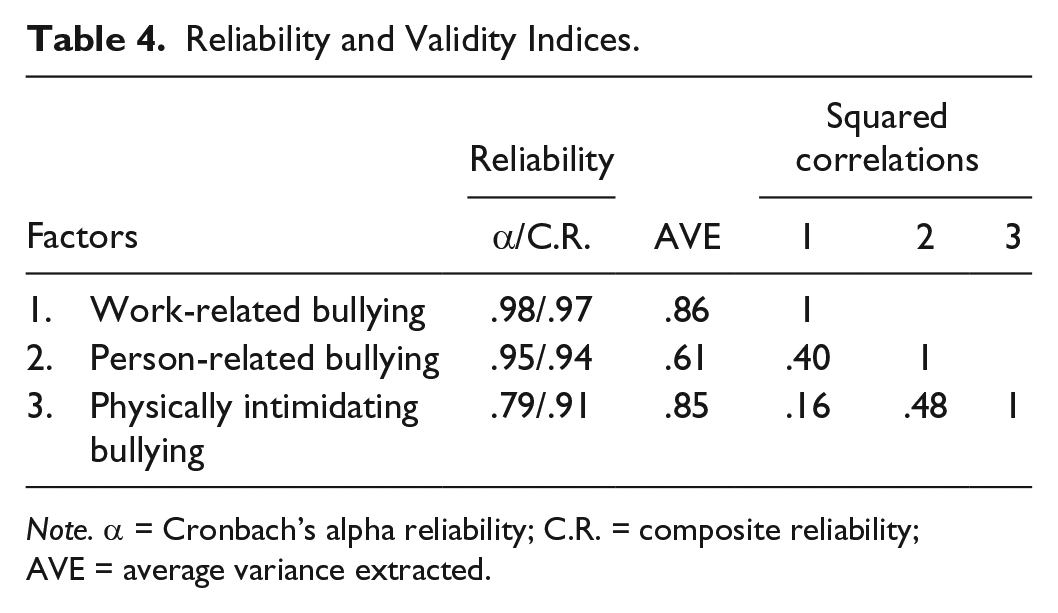
Note. α = Cronbach’s alpha reliability; C.R. = composite reliability; AVE = average variance extracted.
Furthermore, discriminant and convergent validity were also confirmed through the method of Pearson product–moment correlation. Respondents’ scores for workplace bullying on the measure of NAQ-R were correlated with the scores of burnout and work engagement on the scales of CBI and UWES-9, respectively. A significant positive relationship was found between three factors of workplace bullying and dimensions of burnout such as work-related burnout, personal burnout, and client-related burnout, while a significant negative relationship was observed between workplace bullying factors and work engagement (Table 5). The results were in tune with previous findings corroborating correlates of workplace bullying as hypothesized earlier, thus demonstrating construct validity of NAQ-R for measuring workplace bullying in terms of its nomological networks (Hair et al., 2010; Murphy & Davidshofer, 2005).
Correlations of Bullying Scores With Scores of Burnout and Work Engagement.

p < .01 (two-tailed test).
ROC Analysis
Data were subjected to ROC curve analysis for the determination of cutoff points in relation to exposure to bullying at work. ROC analysis calculates cutoff scores using Youden’s index based on the linear combination of sensitivity and specificity (Cutoff = Specificity + Sensitivity; Youden, 1950). Based on Notelaers and Einarsen’s (2013) study, one low (now and then) and one high (weekly) cutoff point as per self-labeling item were used as standard reference for defining the lower and upper thresholds for NAQ-R scores to differentiate occasional and severe exposures to bullying at work. The AUC (area under the curve) for both the thresholds ranges between .86 and .96 (p < .01) which shows the diagnostic accuracy of the test (Streiner & Cairney, 2007), with the optimal cutoff scores at both lower and upper threshold calculated as 40 (threshold for occasionally bullied) and 56 (threshold for severely bullied), respectively. As the overall score on the scale of NAQ-R ranges from 22 to 110, the results of this study may be helpful for categorizing respondents on the basis of frequency of their exposure to bullying at work. Employees with scores below 40 are not bullied, employees with scores between 40 and 56 are occasionally bullied, and employees with scores above 56 are severely bullied at work.
Based on the cutoff scores calculated, the results of the present study revealed that out of 1,053 employees, about 27% (287) reported being occasionally bullied at work, 54% (563) as never bullied, and 19% (203) as severely bullied. Overall, around 46% of the employees were found to be exposed to bullying at workplaces in India either occasionally or frequently. The resulting scores on indirect behavioral items correspond to the subjective labeling approach applied. A highly significant and positive relationship of scores on the single item of subjective victimization was found with total scores of respondents on NAQ-R behavioral items (r = .74, p < .01) as well as with the three obtained factors of work-related (r = .62, p < .01), person-related (r = .71, p < .01), and physically intimidating bullying (r = .48, p < .01).
Discussion
Drawing upon the need for systematic research on workplace bullying in India (D’Cruz, 2012), the present study assessed the psychometric properties of NAQ-R in Indian sample to investigate the prevalence of employees’ exposure to workplace bullying and to provide evidence on its validity. Findings of the study revealed that workplace bullying is quite rampant in India as nearly half of the employees claimed of being exposed to bullying at work either occasionally or frequently. Although the prevalence rate is high as compared with other countries (Nielsen et al., 2011; Parent-Thirion, Fernandez-Macias, Hurley, & Vermeylen, 2007), it corresponds to the previous findings with regard to estimation of exposure to workplace bullying in India (D’Cruz & Rayner, 2015). With the emergence of cut throat competition in Indian service sector (Singh, Vohra, & Sharma, 2015), the high prevalence rate of bullying in Indian workplaces becomes evident as workplace bullying has been labeled as a form of discrimination at work on the basis of competence (Jones, 2006). The most frequent bullying behaviors that employees experience in Indian workplaces include assigning unmanageable workload, giving task below one’s level of competence, excessive monitoring of one’s work, and opinions and views being ignored, while the least experienced behaviors include threats of physical violence and abuse or actual abuse. Furthermore, three models of workplace bullying as per NAQ-R were tested with none having acceptable fit in Indian sample. EFA results of the present study were inconsistent with the previous studies as Item 2 (Being humiliated or ridiculed in connection with your work) has been found to be an indicator of factor named work-related bullying instead of person-related bullying. In view of differences regarding conceptualizations of workplace bullying across countries (Di Martino, Hoel, & Cooper, 2003), with national culture as an important determinant of employees’ perceptions regarding bullying behaviors at work (Escartin et al., 2011), the contrasting results may be attributed to cultural variation (Giorgi et al., 2011). As any negative behavior directed toward one’s professional role becomes an indicator of work-related bullying (Notelaers & Einarsen, 2013), it can be argued that culture may influence the perception of behaviors (e.g., humiliation or insult) occurring in association with one’s work to be perceived as targeted at one’s professional role. Moreover, the findings may be justified with respect to perpetrators of bullying at both work and personal levels as humiliating or insulting someone in relation to his or her work may require knowledge about one’s work with which everyone in the workplace may not be aware of while bullying at personal level does not demand knowledge of victim’s work.
The revised three-factor model of NAQ-R (with Item 2 as a part of work-related bullying) provided the best fit for its use in India, though the two-factor model of work-related and personal-related bullying also had acceptable fit. As the incidents of physical aggression in workplace are very rare (Neuman & Baron, 1998) and physically intimidating bullying is less acceptable than other forms of bullying on a global level and within each culture (Power et al., 2013), these findings are in agreement with the previous studies supporting the three-factor model of NAQ-R (Vukelic et al., 2015). The results showed that NAQ-R has high internal consistency, composite reliability, and construct validity for the present sample. Significant positive and negative relationship of workplace bullying with burnout and work engagement, respectively, entails that bullied employees are less likely to get connected to their work and more likely to get emotionally and physically exhausted.
Two cutoff scores for lower and higher thresholds for NAQ-R have been calculated for categorizing victims as per the severity of bullying behaviors experienced by them. The only study undertaken in this regard by Notelaers and Einarsen (2013) provided cutoff scores as 33 and 45 for occasional and severe exposure to workplace bullying, respectively, based on Norwegian sample. As the cutoff scores have been derived with subjective victimization as a standard criterion, the results point out that Indian workforce is less likely to label its negative experiences at work as personally threatening or indicator of bullying as compared with their European counterparts. The findings may again reflect upon cultural differences as people from collectivistic culture endorse a robust general belief in just world leading to development of psychological resilience (Wu et al., 2011) that make them less likely to appraise the given situation as threatening or stressful (McElroy, Wintemberg, Cronk, & Everett, 2016).
Perceived victimization has a significant and positive relationship with total NAQ-R scores as well as with all the three factors of workplace bullying. Such finding provides additional support for NAQ-R as a valid measure for workplace bullying in Indian context. The strength of relationship between perceived bullying victimization at work and physically intimidating bullying has not been as strong as compared with the other two factors. The findings suggest that in India, bullying at work is conceptualized more in terms of psychological violence rather than a form of physical violence. This corresponds to the view held by World Health Organization regarding nature of workplace bullying (as cited in Kakoulakis et al., 2015).
General Implications
Recognized as a concerning issue internationally (Giorgi, 2012) with varying estimates all over the world (Hershcovis, Reich, & Niven, 2015), workplace bullying needs to be understood in context to Indian perspective (D’Cruz, 2016b) thereby bridging the gap in the professional knowledge base. Despite the fact that prevalence of workplace bullying is quite rife in India, the issue is either not reported or is underreported (D’Cruz, 2012). The factors behind this inhibition to report the matter may include fear of negative consequences comprising negative evaluation, marring of future job prospects, apprehensions on getting a fair deal in absence of concrete laws, and so on. To cope up with such a tendency of victims, an indirect measure to assess bullying behaviors at work becomes essential. As survey length is generally an issue in most organizational studies (Nielsen, Hystad, & Eid, 2016), the NAQ-R with a total of 22 short and fairly comprehensible items, appears to be an easy-to-apply measure of workplace bullying. Moreover, to our knowledge, there are no publications about its validation in India, either in its complete format or in the reduced version. Since NAQ-R is the most extensively used instrument for measuring workplace bullying (Dussault & Frenette, 2014), the findings of this study would add to the given pool of research on workplace bullying and would also facilitate international comparisons regarding prevalence rate of workplace bullying across the globe.
Practical Implications
The findings of the study may be beneficial for clinical practitioners as lack of awareness about workplace bullying in Indian context may unfortunately lead them to misdiagnose the target of bullying which further makes the target feel victimized a second time (Liu, 2012). It is further averred that providing the clinicians with robust knowledge about bullying in the workplace, other interpretations are possible (Liu, 2012). As exposure to workplace bullying is a more crippling and devastating problem for employees than all other kinds of work-related stresses put together (Hogh, Mikkelsen, & Hansen, 2011), Nielsen, Tvedt and Matthiesen (2013) emphasized that the prevention of stress-related health problems is not possible without adequate information about specific stress-related factors that are associated with health problems in different occupational groups.
Although there exist laws for protection against sexual and workplace harassment, currently there is no legislation in India that specifically deals with bullying in the workplace (D’Cruz & Rayner, 2013), even though bullying is ranked on the top among all forms of stressors present at work (Giorgi et al., 2016; Wilson, 1991) and is believed to be 3 times more prevalent than sexual harassment (Namie, 2003). The need of the hour is to raise awareness about the nature and prevalence of the issue which seems to be less likely in the absence of a standardized measure to investigate the phenomenon. As initiatives and endeavors to manage workplace bullying start with the identification of the phenomenon and its targets with an understanding of how frequently it occurs (Caponecchia & Wyatt, 2011; Notelaers, 2011), reliable and valid measures to examine workplace bullying are fundamental for the development and implementation of effective intervention strategies to prevent workplace bullying (Schat, Frone, & Kelloway, 2006). This study may be helpful to HRs, social workers as well as law and policy makers to realize that this issue needs to be identified and arrested by taking stern and immediate actions in the direction. Also governments and organizations are dependent on correct estimates of bullying to know how much time and resources are needed to handle the problem (Nielsen et al., 2010). Moreover, primary, secondary, and tertiary prevention and interventions are often encouraged or initiated on the basis of employees’ cutoff scores on measurement instruments used in organizational surveys (Notelaers & Einarsen, 2013). Providing correct estimates about the extent of workplace bullying in India would be substantial for government agencies, organizations, and employers to check the rise of workplace bullying in Indian workplaces. Needless to add that containing workplace bullying to a certain level will ensure stress-free destinations as far as workplaces are concerned. Obviously, anticipating scope, newer ventures, and most importantly overall well-being and happiness is irrefutably the aim of any study being conducted worldwide. Although much has to be done to quench the desire of stress-free workplaces, the research and findings of the present study regarding the validation of NAQ-R are a beginning toward a consistent and valid measurement of workplace bullying in India. Considering the parameters and consistency, the endorsement of the study is justifiable to a large extent.
Limitations and Future Recommendations
Given the reluctance of Indian organizations to provide access to their employees owing to the nature of the research problem (D’Cruz, 2012), the sample size is relatively small as compared with other studies of similar nature undertaken in different countries (see Einarsen et al., 2009; Nielsen et al., 2009). Larger sample size would have provided larger statistical powers in the estimations. The present study investigated the prevalence of workplace bullying on the basis of respondents’ own experiences of frequency of exposure to such behaviors that are not verified by other sources. In future, qualitative and longitudinal studies can be undertaken to gain an in-depth understanding of the phenomenon. Acknowledging the nature and extent of the problem, this area, if ignored, can crop up serious repercussions and needs to be further explored with the prime focus on the underlying factors that mediate or moderate the effects of workplace bullying on victims so that effective intervention strategies can be worked out.
Conclusion
Workplace bullying is a part of employee’s experiences in Indian service sector. Suggestions from previous studies that have inspired this investigation focus on the need to develop a reliable and valid measure of workplace bullying in countries where limited knowledge about phenomenon of workplace bullying exists (Giorgi et al., 2011). The present study provides preliminary support for NAQ-R as a reliable and valid measure to assess workplace bullying in India on the dimensions of work-related, person-related, and physically intimidating bullying. The study may have important implications for future research and practice related to workplace bullying in India. Considering the high-rate exposure and quantum of negative effects brewing up among Indian employees and establishments due to workplace bullying (D’Cruz & Rayner, 2015; Gupta & Bakhshi, 2017), empirical use of NAQ-R has attained a significant relevance, thus becoming a necessity in Indian arena.
Footnotes
Declaration of Conflicting Interests
The author(s) declared no potential conflicts of interest with respect to the research, authorship, and/or publication of this article.
Funding
The author(s) received no financial support for the research, authorship, and/or publication of this article.