
Abstract
This article reports an analysis of the relationship between women’s increased participation in higher education and other recent social changes over the last four decades. To date, women’s increased involvement in higher education has been studied as either a force for or a consequence of other sociocultural changes. Drawing on data from key international data sets and with a focus on a range of Organisation for Economic Co-Operation and Development (OECD) countries, this article details an exploratory factor analysis of women’s higher education participation and a range of other variables identified as indicators of or mediators for social change. This analysis reveals the existence of four underlying factors showing the structural interrelationship between the variables.
Introduction
Over the past four decades, the number of higher education students has increased globally, and universities have moved from elite to mass and then to global higher education in most developed countries (Taylor, 2003, p. 813). A particular feature of this development has been the increasing rate of women’s participation in higher education. In the vast majority of developed countries as well as those in transition, women now comprise the majority of tertiary students (Leathwood & Read, 2008). For example, based on data derived from United Nations Educational, Scientific and Cultural Organization (UNESCO; 2016), over the last 40 years, the proportion of women in higher education has increased from 39% to 56.4% in North America and Western Europe, 34% to 51.3% in East Asia and Pacific, 35% to 56.3% in Latin America and the Caribbean, 21% to 32.8% in South and West Asia, and 22% to 45.6% in Sub-Saharan Africa. However, in Sub-Saharan Africa, and South and West Asia, men remain in the majority, although there are some notable differences between countries and within regions. Importantly for this study, the proportion of women’s participation in higher education has also risen from 33% in 1970 to 54% in 2012 in Organisation for Economic Co-Operation and Development (OECD) 1 countries (UNESCO, 2016).
These increases are observable whether one thinks in terms of women’s enrollments as a share of total enrollments, or as a percentage of the appropriate age cohort of women eligible to attend institutions of higher education (Ramirez & Wotipka, 2001). In other words, women undertaking higher education comprise an increasingly larger proportion of their female peers as well as being a higher proportion of the student body. Just what this development means in terms of its social effects is as yet not clear. This study presents one attempt to identify factors relating to women’s participation in higher education and other social changes and to investigate any potential interrelationships.
A useful indicator for examining the participation levels of women in higher education is defined by United Nations Development Program (UNDP) as the Gross Tertiary Enrollment Ratio (GTER) (UNDP, 2008). GTER reflects changes in enrollment numbers and population size by dividing the total tertiary school enrollment, regardless of age, by tertiary school-aged population.
The current study looked at the case of a range of OECD countries as an example of the increased participation of women in higher education as these countries report the highest level of GTER a feature which may have clear implications for developing countries. The statistics for each indicator have been collected over the past four decades based on the initial needs of the larger project so that significant comparisons can be made between different countries and times, relying on the available data. 2 (Note that not all OECD countries collect data in similar ways and nor do they collect data at the same times or time spans.)
On average, OECD countries report a relatively high GTER of 74% in 2012 compared to the average GTER of 21% in 1980. Of these OECD countries in 1980, GTER was highest for women in United States and Canada and lowest in Luxembourg and Turkey. Although the growth in the participation rate of women in higher education is observable for all the OECD countries in the time period 1980-2012, in countries such as Turkey and Luxembourg, a tenfold increase has led to a remarkable growth of GTER from 3% in 1980 to 55% in 2011 in Turkey, and from 1% in 1980 to 19% in 2010 in Luxembourg. Of course, the low base makes the percentage increase look very dramatic but the interesting point here is that within the OECD, there was a wide variation of women enrolling in higher education in recent times.
Studies show several implications for the global positioning of women in terms of status and power that appear to follow from their increased access to higher education. Researchers have identified the sociocultural variables associated with these changes as changes in family structure and fertility behavior (Abbasi-Shavazi, Lutz, Hosseini-Chavoshi, & Samir, 2008; Abbasi-Shavazi & McDonald, 2006; Fisher & Charnock, 2003; Gottard, Mattei, & Vignoli, 2015; Yu, 2006), changes in social norms and values (Bertrand, Cortés, Olivetti, & Pan, 2016; Gilbert, 2014; Salehi-Isfahani, 2001; Shaditalab, 2005), and women’s improved access to job opportunities, income, and security (Frenette & Coulombe, 2007; Mok, 2016; Vedadhir, 2002; Watts, 2003; Woodd, 2013; Yu, 2006). Although the direction of all such variables seems positive, the question remains about the degree to which they are seen as most desirable and/or important for women in their different societies.
These variables impact on both personal lives and society as a whole, although the quality and intensity of their impact may be different across people and places. The literature suggests that the relationship between these variables is very complex, and it is impossible to draw a firm conclusion about which is the cause and which is the consequence. It is quite likely the variables are driven by each other that is they are causes and consequences of one another. For example, with regard to family structure, the increasing divorce rate has been at least partly attributable to women’s increased economic independence over the past few decades (Kalmijn, 2013; Poortman, 2005). It could be argued that the causal relation works in both directions: With divorce more prevalent, women might reenter the labor market in larger numbers or become the primary wage earner instead of the secondary wage earner (Fernández & Wong, 2014). In addition, women might be more cautious about giving up paid employment in favor of full-time homemaking when divorce rates are high (Johnson & Kalb, 2002; Raymo, 2015; Van Damme, Kalmijn, & Uunk, 2009). Consequently, any claim of a simple linear relationship between variables should be treated with great caution.
Although the studies mentioned above used regression analysis, to demonstrate the complexity of the relationship between variables, none of them examined the bidirectional relationship between higher education and the full range of variables at any one time. In contrast, this study investigates any consequential relationship between these variables and the underlying factors behind them, outlining the structure of complexity and relationship between variables of interest.
Overall, this research seeks to provide a systematic and detailed analysis of the relationship between the expansion of women’s participation in higher education, and the changes made in women’s lives and the broader society as a basis for future structural modeling to present a more nuanced and complex picture of the interactions between variables. Although lack of information about current opportunities and possibilities may lead to inappropriate policies and plans, an understanding of the effects of these changes for women and the way in which they can influence women’s lives and general social attitudes, has the potential to improve national policies in various fields such as employment.
This study uses standard indicators defined by international organizations such as UNDP. Selected indicators include Women’s Labor Force Participation, Percentage of Women in Managerial and Professional Occupations and Percentage of Women in Parliament, Women’s Wages as a Percentage of Men’s Wages, Women’s Age at First Marriage, Total Fertility Rate, Divorce Rate, Marriage Rate, and GTER of Women.
The next section reviews the literature that describes a causal relationship between women’s participation in higher education and other sociocultural variables through an exploration in theory and previous empirical research. This is followed by an explanation on the methods used and an exploratory factor analysis (EFA) of women’s socioeconomic indicators in selected countries. Finally, the results are compared to previous knowledge on the topic and a hypothesis is produced for examining the model of complexity and relationship between the variables.
Literature Review
Empirical research tends to proceed from an idea of higher education as benefiting the individual woman through (a) the potential earning power and greater labor force participation of women (Ahituv & Lerman, 2007; Benavot, 1989; Carnoy, 2006; Crompton, Lewis, & Lyonette, 2007; Mok, 2016; Woodd, 2013), (b) changes in fertility behavior and family arrangements (Carnoy, 2006; Gilbert, 2014; Gottard et al., 2015; Stevenson & Wolfers, 2007; Weston, Qu, & Parker, 2004), and (c) shifts in individual beliefs and values (Crompton et al., 2007; Gilbert, 2014; Moghadam, 2015).
The current study is designed to investigate the social effects of women’s increasing participation but its starting point is an examination of the individual effects as seen in existing research in the OECD context.
Potential Earning Power and Greater Labor Force Participation of Women
Two global approaches are identified for the basis of women’s greater employability due to higher educational attainment. The first counts women’s greater employability as a function of the knowledge and skills transmitted by higher education and its contribution to workforce development. The second approach investigates the use of higher education credentials by employers to identify the potential social and cultural capital of the individuals (Brennan, 2008; Brown, 2016). Whichever approach is used, higher education is seen globally to affect women’s willingness and ability to enter the labor market as it raises their potential earning power, provides them with necessary credentials for employment, and changes their attitudes toward women’s traditional roles in the household and in the workplace (Ahituv & Lerman, 2007; Benavot, 1989; Bianchi, 2011; Carnoy, 2006; Carnoy et al.2012; Crompton et al., 2007).
Cross-national studies expect women’s increased educational attainment to reduce the wage differentials between men and women because women will increase their commitment to wage employment, be less inclined to work in part-time jobs, and have a more continuous employment history. Thus, women’s increased educational attainment is seen as likely to cause sex differentials in the rate of return on education to decrease (Benavot, 1989; Oreopoulos & Petronijevic, 2013). Several empirical studies support the idea that in recent decades, the increasing participation of women in higher education has helped to decrease the gender gap in earnings (Gill & Leigh, 2000; Loury, 1997). However a longitudinal study by Frenette and Coulombe (2007) in Canada showed different factors driving the gender gap decline in each decade. For example, changes in family characteristics were the main driving force for the decline in earning gaps in the 1980s, while the rise in educational attainment is shown to be the main driving force of gender gap decrease in the 1990s. The convergence in earnings has slowed down during the 1990s, a feature which is explained by Blau and Kahn (2006, p.5) as due to “changes in labour force selectivity,” “gender differences in unmeasured abilities and labour market discrimination,” and “changes in the relative advantage of supply and demand shifts.” The main educational explanation for the gender earning gap is that women mainly study in areas that lead to less well-rewarded jobs (Bobbitt-Zeher, 2007; Frenette & Coulombe, 2007; Gerber & Schaefer, 2004), a finding that shows the strong connection between gender roles and economic reward.
Of course, changes in women’s employability and earnings affect society as well as individuals at a time when educational credentials are becoming increasingly central to the determination of life chances in most developed countries (Lauder, Brown, Dillabough, & Hasley, 2006; Lauder, Young, Daniels, Balarin, & Lowe, 2012). However, empirical evidence from most European countries shows that the increasing participation in higher education has not achieved equitable social access. In general, some studies show that the increase in higher education enrollments has occurred mainly within the middle class, while other people, males and females without educational credentials, continue to face disadvantages in access to life chances in most developed countries (Brennan, 2008; Brown, 2003, 2013; Quaye & Harper, 2014; Tomlinson, 2003). So it would appear that women’s increasing access to higher education may be limited to one particular group of women, suggesting an interrelationship of factors relating to class and educational level.
Changes in Fertility Behavior and Family Arrangements
Another highly discussed issue in empirical research in this field is fertility behavior and family structure. Studies show that there have been remarkable worldwide changes in family life in the past 40 years (Stevenson & Wolfers, 2007; Thornton, 2013). Divorce rates, cohabitation outside of marriage and single parenthood have increased. Fertility rates have significantly decreased in most developed and developing countries. More women are choosing not to have any children at all and greater percentages of women are willing to participate in paid work as well as being responsible for domestic work and child care (Baxter, Haynes, Western, & Hewitt, 2013; Carnoy, 2006; Gilbert, 2014; Weston et al., 2004). It appears that these changes in social relations and sexual mores have yielded both costs and benefits.
Many developed countries have experienced women’s increasing educational achievement and, at the same time, decreasing fertility, a connection shown to be significantly linked (Abbasi-Shavazi et al., 2008; Hazan & Zoabi, 2015; Yu, 2006). Other factors cited as contributing to the decline in fertility rates include the following: the progress in contraceptive technology, delayed age of marriage, increasing lifetime childlessness and the falling average number of children (Goldscheider, Bernhardt, & Lappegård, 2015; Oppenheimer, 2013; Qu, Weston, & Kilmartin, 2000), and increasing participation of women in paid employment. Consequently, researchers have stressed the increasing opportunity costs for women to bear and rear children (Castles, 2002; Del Bono, Weber, & Winter-Ebmer, 2012; Johnson & Kalb, 2002; McDonald, 2001; Qu et al., 2000; Shreffler & Johnson, 2013; Yu, 2006). Yu (2006) argues, not only is the opportunity cost of raising children affected by the education of parents, but education also affects fertility through various other channels such as income, family structure, and fertility preference.
Shifts in Individual Beliefs and Values
Education has different effects on measurable characteristics such as employment rate, marriage, childbearing, and income; however, these factors do not fully explain the effects of increase in women’s higher education participation. A great part of the change in women’s higher education participation appears to be associated with unobservable norms and values which are harder to document and quantify, yet have a genuine influence on human affairs, which becomes most evident in periods of change.
Modernization theory explains higher education as a modernizing institution and focuses on the associated changes in norms and values. From this perspective, higher education alters the individual’s traditional norms and values by developing modern values such as “openness to new ideas,” “independence from traditional authority,” a “willingness to plan and calculate future exigencies,” and “a strong sense of personal and social efficacy” (Benavot, 1989, p. 16). Others have argued that when a significant amount of the population is exposed to modernizing institutions such as universities, the level of individual modernity increases and the educational expansion affects the economic development through its effects on individual beliefs and values (Brown & Lauder, 2006; Eggins, 2003).
Changes in women’s rights along with educational achievements have increased gender equality through society, including in family life. These changes have been heralded as transforming women’s opportunities to control and shape their personal lives (Goldin & Katz, 2008). In family relations, based on a social partnership of interdependence and mutual adjustment, couples can decide how to divide their labor most effectively to satisfy personal needs and family responsibilities, which does not require that all duties be split evenly down the middle. Today, women have more control over the course and rhythm of their lives than ever before. They also struggle with more choices about how to achieve self-fulfillment (Gilbert, 2014).
In recent decades, the increasing education and employment of women has challenged the traditional family structure which was based on gender differences (Gilbert, 2014; Goldscheider et al., 2015; Johnson & Kalb, 2002; McDonald, 2001). The rise in educational attainment has weakened the traditional gender roles, on one hand, and resulted in new norms and values, on the other. Although traditional and modern roles are hard to harmonize, this disjunction can lead to a social identity crisis especially in those sections of the society which are mostly affected by these institutions and cultural changes (Crompton et al., 2007; Gilbert, 2014).
Table 1 summarizes the literature discussed in this section, introducing the variables shown to affect higher education participation and/or to be affected by it thereby depicting a relationship between these variables. As can be seen in Table 1, the same factors often appear as both provocation and consequence, indicating the complex interactions between the variables. Although the literature studied in this article captures a number of variables affecting women’s higher education participation or considers higher education participation of women as a cause to various changes in women’s life, the current study aims to fill in the literature gap by studying the consequential interrelationship between these variables.
Commonly Referenced Variables and the Relationship Between Them.

Method and Materials
The studies discussed above have used regression analysis which structures the explanation for the key variable in terms of another. Thus, women’s participation in higher education is inevitably seen as produced by one of the other variables being examined. Instead of this approach, we suggest the use of structural equation modeling (SEM) for studying the complex interrelationship between variables under study. In this approach, the causal relationship is not structured in but rather links between variables are free to emerge during the investigation. SEM is a collection of statistical techniques that allow a set of relationships between one or more independent variables and one or more dependent variables, and unlike regression models, the response variable in one equation in SEM may appear as a predictor in another equation (Ullman & Bentler, 2003). Variables in SEM may influence each other reciprocally, either directly or through other variables that act as intermediaries (Fox, 2006). A SEM study involves two steps: (a) producing a hypothetical structural model of the relationship between a set of observed dependent variables and a set of continuous latent variables and (b) model evaluation and modification that describes the relationships produced in the first step (Schumacker & Lomax, 2004).
In this article, we produce the hypothetical structural model by investigating the consequential relationship between variables under study and the underlying factors behind them, outlining the structure of complexity and relationship between variables of interest.
EFA is used to determine the factor structure of the observed variables, on the basis of factor loadings. EFA is recommended as a first step when the researcher does not have a substantive theoretical model (Schumacker & Lomax, 2010), and it is a method used for theory building, which is different from other factor analysis methods such as confirmatory factor analysis (CFA)—used for testing an existing theory—or principal components analysis (PCA)—used for reducing a set of variables into a smaller number of components (Matsunaga, 2015).
Factor analysis enables the consideration of the effects of participation in higher education on selected sociocultural variables as well as the impact these variables have on higher education itself. Factor analysis differs from multiple regression analysis in that it considers all variables simultaneously with no distinction as to dependent or independent variables (Hair, Anderson, Tatham, & Black, 1998, p. 97). Thus, factor analysis will allow for the inclusion of higher education participation in the model without anticipating a one-way relationship between variables. In this case, an exploratory study is used to reveal the structure of relationships between selected variables.
To conduct the EFA, principal axis factoring with a Promax rotation was used to extract factors from the data, resulting in four factors that captured 63% of variability in the original data set.
Data Selection
Based on the literature and availability of the data, nine sociocultural indicators of women defined by international organizations were selected for further study, each of which has been established as connected with women’s participation in higher education (see Table 1). A complete list of indicators, definitions, and sources are provided in Table 2.
Indicators, Definitions and Sources.
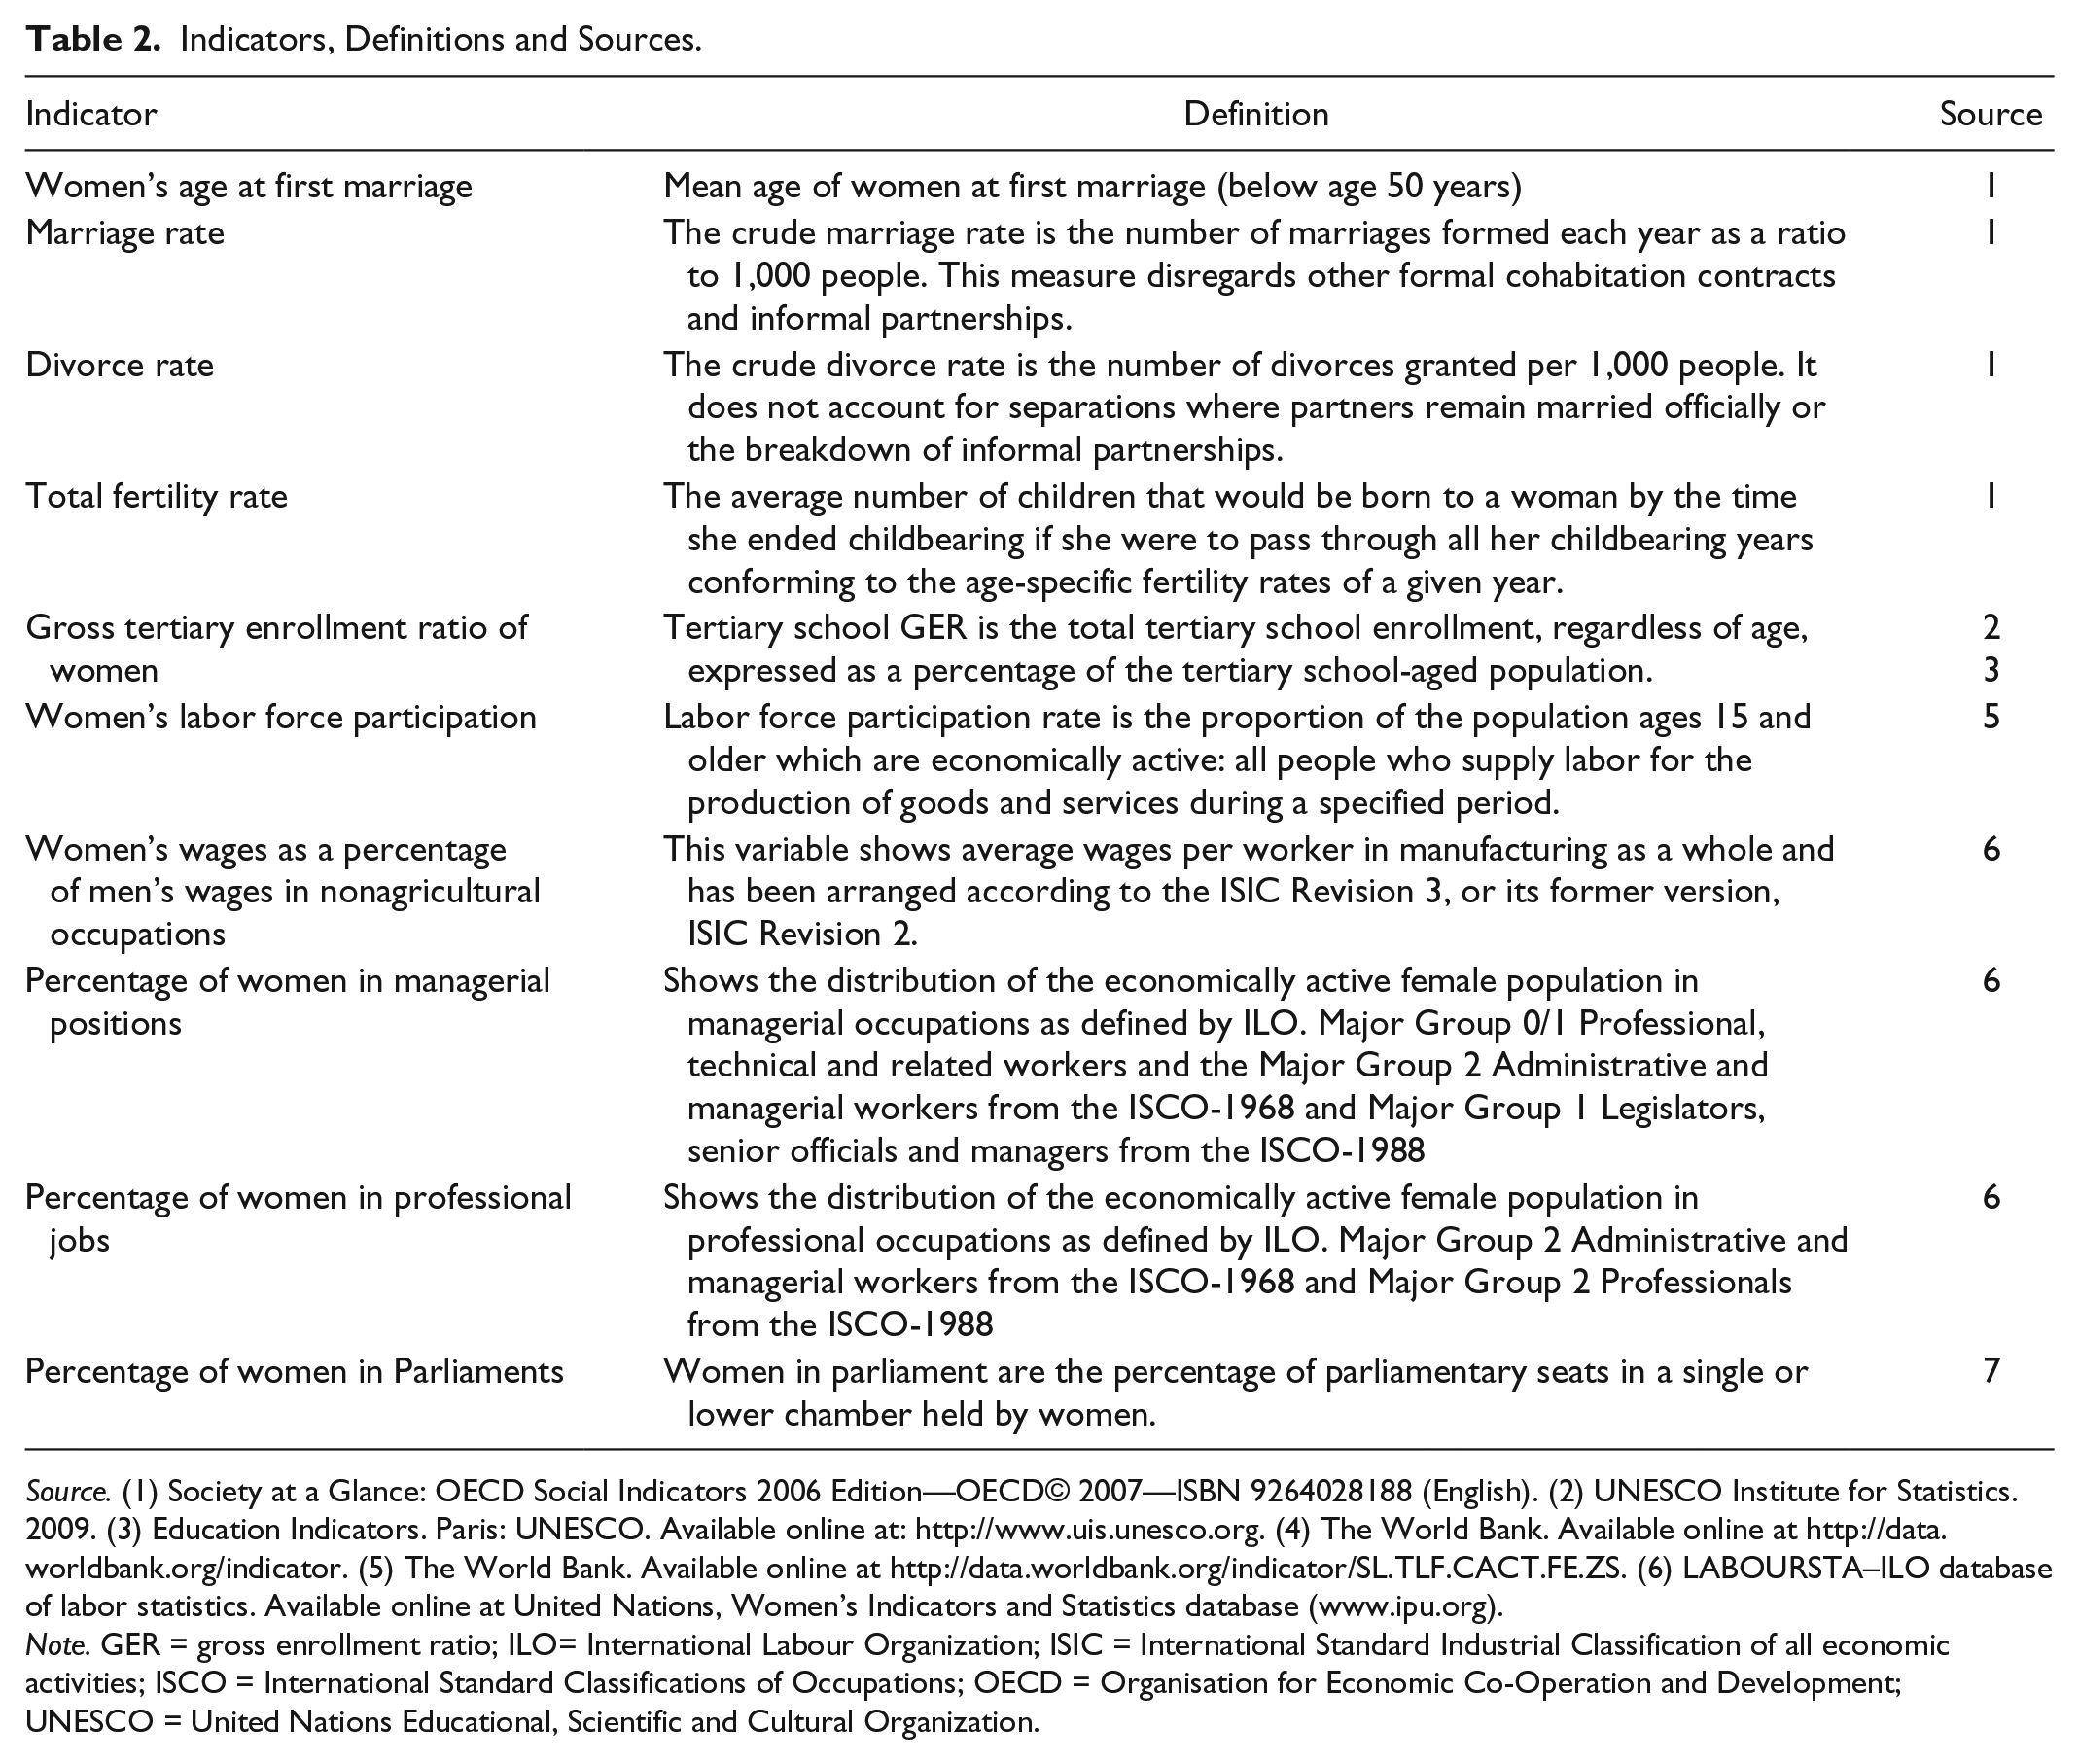
Source. (1) Society at a Glance: OECD Social Indicators 2006 Edition—OECD© 2007—ISBN 9264028188 (English). (2) UNESCO Institute for Statistics. 2009. (3) Education Indicators. Paris: UNESCO. Available online at: http://www.uis.unesco.org. (4) The World Bank. Available online at http://data.worldbank.org/indicator. (5) The World Bank. Available online at http://data.worldbank.org/indicator/SL.TLF.CACT.FE.ZS. (6) LABOURSTA–ILO database of labor statistics. Available online at United Nations, Women’s Indicators and Statistics database (www.ipu.org).
Note. GER = gross enrollment ratio; ILO= International Labour Organization; ISIC = International Standard Industrial Classification of all economic activities; ISCO = International Standard Classifications of Occupations; OECD = Organisation for Economic Co-Operation and Development; UNESCO = United Nations Educational, Scientific and Cultural Organization.
The sudden growth in higher education participation is seen as a global phenomenon (Marginson & Van der Wende, 2007) with all countries affected, regardless of the position of governments (Marginson, 2004). Since the process of change occurs on a global scale, the results and incentives of this process should similarly be studied at a global level. As a consequence, a cross-national study is able to reveal dynamic interaction between the variables listed and the wider society. This type of cross-national study is beneficial as it produces a large-scale and representative sample, permitting macro-level analysis through aggregated data and enabling inferential statistics to be used. The decision to choose OECD countries was made to obtain as much data as possible from a group of countries that have already achieved a high participation rate of women in higher education. These countries provide cultural and geographic diversity through which to explore cross-national differences over the course of time, depending on the available data. Data were collected at an aggregated level for each particular indicator being recorded across 30 different OECD countries. The main sources for the data were the OECD statistical data bank (Organisation for Economic Co-operation and Development, 2010), UNDP data bank (UNDP, 2010), and the World Bank (World Bank, 2010). In some cases, national statistical bureau websites were used to collect additional data for the missing values.
Overall, this article reports on a large-scale study built from individual country statistics. Although each country has its own survey and census schedule, the data were not available for all countries at the exact same time. For example, one country might collect data at 5-year intervals from 1955, while another country collects national data in 2-year intervals from 1960. Thus, to compare the data for these two countries, the only available data are for 1960, 1970, 1980, 1990, 2000, and 2010. This pattern of data becomes scarcer when all 30 countries are considered simultaneously, each with different data collection schedules. Considering the assumptions of EFA, missing values were treated by listwise deletion reducing the data set into a final data set of 69 records. Each record includes simultaneous data on all the nine variables at a same point of time for each country. In screening the data, a number of countries were removed from the data analysis as these countries had only joined OECD since 1995, and data were not adequately collected on them by OECD (especially for the period 1970-1995). These countries included Korea, Slovak Republic (2000), Hungary (1996), Mexico (1994), Poland (1996), and Slovenia (2010). 3
A selection of other countries was also removed because they provided no data on one or more variables under study (e.g., Germany had not reported gross tertiary enrollment ratios and therefore was screened out in the listwise deletion). Finally, after removing countries with a large number of missing values, the data set was reduced to just 15 OECD countries including Australia, Austria, Belgium, Denmark, Finland, Iceland, Japan, Netherlands, New Zealand, Norway, Portugal, Sweden, Switzerland, Turkey, and United Kingdom. Considering the reduced country list and availability of data for each country, the listwise deletion left us with 4 or 5 points in time (spread over the 40-year time span) for each country under study.
Data Screening and Assumption Testing
To conduct statistical procedures with the sample, the data had to be prepared to make it amenable to the particular procedures to be undertaken. The data were screened for multivariate Normality by using a Kolmogorov–Smirnov test of Normality. 4 With the exception of women’s Gross Tertiary Enrollment Ratio, Labor Force Participation, and Age at First Marriage, the remaining variables did not pass the multivariate Normality tests at this stage.
To achieve Normality, we transformed the original data, using the skewness and kurtosis statistics as indicator of Normality. After transformation, these statistics were all within a tolerable range of ±2, making the data acceptable as multivariate Normal.
We further conducted a number of tests to determine whether the data were appropriate for factor analysis. The sample size was n = 69, after using listwise deletion for missing values, satisfying the recommendation of at least five observations per item (Field, 2009). We also checked the Kaiser–Meyer–Olkin (KMO) Measure of Sampling Adequacy which was 0.78, above the recommended value of 0.6, indicating a good sample size to support our analysis. Each item had a minimum correlation of .3 with at least two other items, suggesting reasonable factorability (Hair et al., 1998). The Bartlett Test of Sphericity yielded significant results, approximately χ2(36) = 270.214, p < .05, supporting the existence of significant correlations between subsets of the items. The data indicated no multicollinearity, and we were able to regard the factors as indicative of separate constructs without substantial overlap. Because the assumptions of factorability were comfortably observed, we retained all items in the ensuing analysis (Field, 2009).
Results and Discussion
The analysis revealed four factors which were structurally involved with women’s higher education participation. They emerged as follows. A factor analysis of the nine items using Promax rotation and Kaiser Normalization was conducted. Using a scree plot, Jolliffe’s criterion (eigenvalues above 0.7), and the interpretability of the results, our study resulted in a four-factor solution.
A minimum cutoff of 0.40 was used to identify items loading on each factor, based on the sample size of n = 69 (Hair et al., 1998). The factors, item loadings, and eigenvalues are given in Table 3.
Pattern Matrix.

Extraction method: Principal axis factoring.
Rotation method: Promax with Kaiser normalization.
Rotation converged in five iterations.
Based on the factor loadings in Table 3, three items loaded onto the first factor, namely, Women’s Age at First Marriage, Women’s Labor Force Participation, and Gross Tertiary Enrollment Ratio of women. All these variables have the same sign, suggesting that the changes in these variables complement one another and as such, are all important together and should not be considered separately
This suggestion is supported by the studies indicating that women delay marriage in favor of building their career and attaining higher education (Abbasi-Shavazi et al., 2008; Yu, 2006). Since women’s Age at First Marriage has the highest loading on this factor—twice as large as the other two variables—we name this factor as marrying later (Hair et al., 1998).
Three items load onto a second factor highly related to women’s empowerment. This factor related to Percentage of Women in Managerial and Professional Occupations and Percentage of Women in Parliament. This factor also relates to Marriage Rate; however, the effect of marriage is negatively related to the percentage of women in managerial and professional occupations and percentage of women in Parliaments. The negative relation of marriage to the other two variables appears to suggest that while marriage may have an important relation to this factor, it needs to be considered separately. This factor was labeled stronger public presence as indicated by the higher loading of the two first variables on this factor.
The two items that load onto Factor 3 relate to the Total Fertility Rate and Women’s Labor Force Participation. Because Women’s Labor Force Participation has a positive sign and Total Fertility Rate has a negative sign, it seems the two variables are in contrast with each other. The relationship between these variables is supported by the studies indicating the decrease in fertility rate followed by increasing participation of women in paid employment and consequently the increasing opportunity costs for women to bear and rear children (Castles, 2002; Johnson & Kalb, 2002; McDonald, 2001; Qu et al., 2000; Yu, 2006). This factor was labeled childbearing due to the higher loading of Total Fertility Rate on this factor compared to Women’s Labor Force Participation.
Items for Factor 4 represented Women’s Wages as a Percentage of Men’s Wages and Divorce Rate. The two variables are negatively related which is supported by those studies indicating that higher family income decreases the divorce rate (Sayer & Bianchi, 2000). This factor was labeled gaining independence.
The factors are also interrelated. Factors 1 and 3 are highly interrelated by virtue of Women’s Labor Force Participation impacting on both. Factors 2 and 3 are also interrelated, both sharing Marriage Rate.
The pattern matrix only reflects the direct path from a factor to a variable, it contains the unique correlations between variables and factors and the variance shared among factors has been removed. In contrast, the structure matrix reflects all the possible paths from a factor to a variable including the factor to factor paths (Field, 2009).Women’s Age at First Marriage, Women’s Labor Force Participation, Gross Tertiary Enrollment Ratio of women, Percentage of Women in Parliaments, and Women’s Wages as a Percentage of Men’s Wages have high loadings in the structure matrix for all three factors. However, Women’s Marriage Rate only has high loadings on Factor 2 while Total Fertility Rate only loads high on Factor 3 in the structure matrix. Interestingly, Factor 4 stands alone on Divorce Rate; however, it shares Gross Tertiary Enrollment Ratio of women with all the other factors.
In summary, the results from the pattern and structure matrix show that Gross Tertiary Enrollment Ratio of women loads high on all four factors, which supports the conclusion in the literature on the effect of higher education participation on different aspects of women’s lives (Abbasi-Shavazi et al., 2008; Abbasi-Shavazi & McDonald, 2006; Fisher & Charnock, 2003; Frenette & Coulombe, 2007; Shaditalab, 2005; Vedadhir, 2002; Watts, 2003; Yu, 2006). Once again the inference to be drawn from this study is that there is no simple linear relationship between women’s involvement in higher education and other aspects of their lives. However, the impression remains that higher education has affected a broad range of women’s lives as indicated by the steadily increasing uptake of higher education across different countries and cultures.
The information presented in Tables 3 and 4 pictures the structure underlying the variables under study and can be used as a hypothesis in further research.
Structure Matrix.
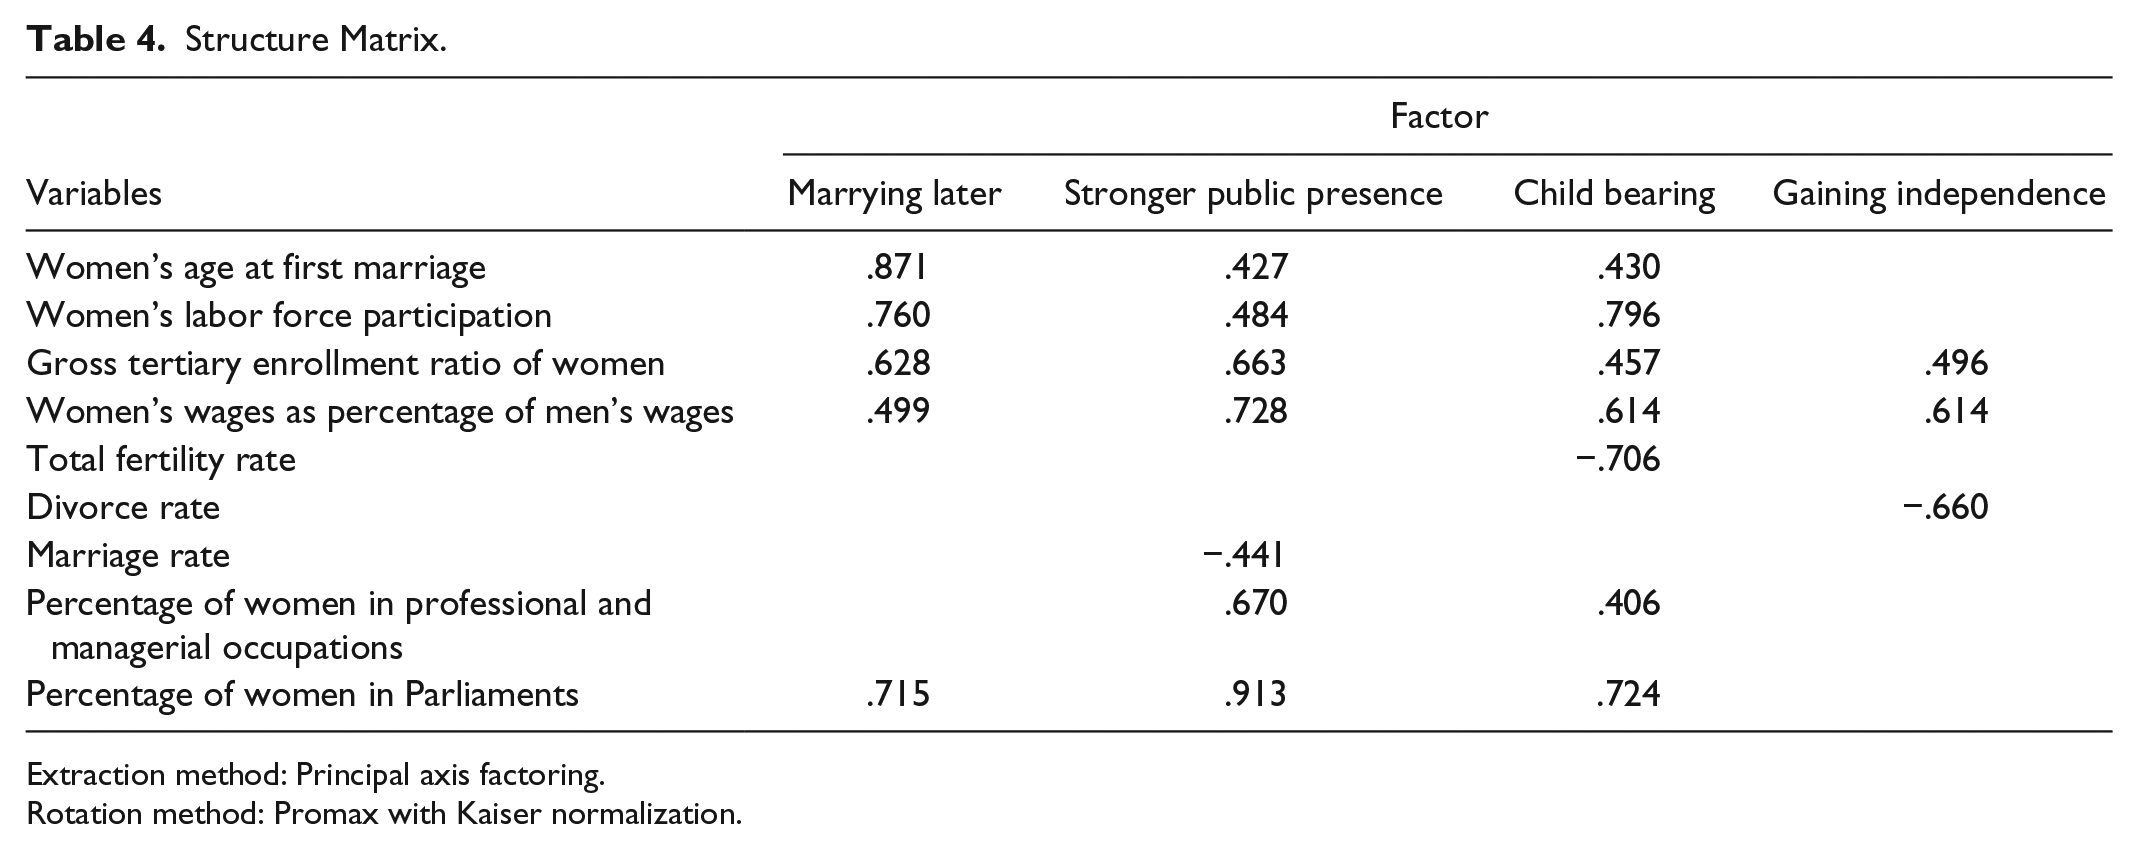
Extraction method: Principal axis factoring.
Rotation method: Promax with Kaiser normalization.
The overall picture produced by the EFA is in some sense in line with expectations from the literature. Women with university degrees are likely to marry later and have fewer children than their less educated peers. However, the analysis also shows several interesting and perhaps less anticipated outcomes such as the lower divorce rate coincident with a higher public presence, the latter being also working in opposite direction to marriage. In general, these results open up many questions for further exploration.
However, the main outcome of this work lies in the way in which it shows the intricate interrelationships between the factors involved and the lack of any clear causal explanation in terms of any one factor. The study presented here reveals a dynamic and fluid situation, much less controlled and controllable than has been seen in other work on women and higher education.
Research Limitations and Conclusion
The database used in this study is limited to data collected by international organizations in the last four decades and there was a lack of information for some indicators in different years. We acknowledge the possible influence of data collection times on the results but the trends still stand regardless of the data collection times. In studying cultural changes, a statistical analysis will be able to show the relationships between the selected variables; however, we may only speculate about any effects of women’s participation in higher education on social norms and values. Existing statistics on family structure and fertility behavior can indicate some changes in norms and values but there is a need to explore some of the outcomes in greater depth in terms of the realities of women’s lives. Hence, qualitative, interpretive methodology is suggested for further research at ground level to understand the changes in social norms and values experienced by female university graduates in depth and detail.
By analyzing the factors involved in women’s increased participation in higher education this study has identified some key interrelationships. Although we acknowledge the limitation of our findings in terms of a finely nuanced account of the experience of individual women, we argue that the issue of increasing gender equity in terms of uptake of higher education has been revealed as much more complex than previously envisaged. Prior research on this topic has been generally concerned with the effects of women’s higher education participation on their economic and fertility behavior, which has resulted in a steady state picture, wherein one dimension—higher education—is seen as the change agent. In contrast, this research has shown the interrelationship between women’s participation in higher education and sociocultural aspects of their lives, treating all the variables in dynamic interaction. This article argues that the changes in women’s lives are not simply a result of women’s increased involvement in higher education. Rather, the argument put forward here is that the changes in higher education are taking place at the same time as a range of other changes, all of which interact and affect each other.
The study has shown the inadequacy of explanations describing simple linear relationships between women’s access to higher education and social change. By detailing some of the components of this complexity, the analysis presented here provides a robust basis for future investigations. In this study, we are not making assumptions about individuals, but we are using aggregated country-level statistics to find out generalizable trends from group data, not to claim that any one woman from any of the groups would behave in the same typical way. In this case, further qualitative studies were conducted by the authors (Parvazian & Gill, 2012) to demonstrate how some of the trends played out in the lives of individual women—who took different strategies to forge new ways of creating spaces for themselves. This study further indicated that cultural differences play an important role in women’s lives in various countries. A comparative study of the OECD countries, shows that Japan is noted as an exception to other OECD countries given that in this country the employment rates of tertiary graduate women are similar to, or lower than, the rates of low-educated women. Explanations for this difference were sought within Japan through further quantitative and qualitative analysis to identify the interrelationships between changes in women’s higher education participation, labor force participation, and earning in terms of potential connections to other aspects of the national social settings. Results show that women’s position and life choices are so culturally embedded in Japan that such issues cannot be completely changed in a short period of time.
Implications for Further Study
The factors emerging from this study can supply the basis for hypothesis testing in further research. In this case, SEM is suggested for further study both as a measurement model and a structural model. The measurement model is a multivariate regression model that describes the relationships between a set of observed dependent variables and a set of continuous latent variables. The structural model describes three types of relationships in a set of multivariate regression equations: the relationships among factors, the relationships among observed variables, and the relationships between factors and observed variables that are not factor indicators. However, the SEM analysis on the variables under study in this article requires at least 20 observations per variable, a number not available from the current data sets provided by international organizations. Although OECD is continually collecting data on the sociocultural variables of its member countries, in a few years time, the basic data for the SEM study might be available and further research can be done using SEM analysis.
On the basis of the findings detailed here, we urge further investigation of the interrelationship between women’s access to and participation in higher education to further establish women’s position as essential players in the knowledge economies of both developed and developing countries.
Footnotes
Declaration of Conflicting Interests
The author(s) declared no potential conflicts of interest with respect to the research, authorship, and/or publication of this article.
Funding
The author(s) received no financial support for the research, authorship, and/or publication of this article.