
Abstract
The article demonstrates heuristic possibilities of the theory of self-organized criticality (SOC) in the investigation of historical processes. Key SOC concepts and ideas are explained. Specifically, tools that can be used for identifying pink noise, an attribute of a critical state, are described. The results of spectral analyses of historical demographic data (i.e., birth and death rates in Russian settlements in the 19th and 20th centuries) and historical market data (i.e., grain prices in regions of Russia in the 18th, 19th, and early 20th centuries) are presented. It was found that noise color in the data series differed substantially across different periods. Based on these observations, the assumption that a change in noise color can serve as an indicator of changes in historical processes was made. In some cases, this indicator can enable one to establish the time, speed, and direction of state changes in historical processes. Pink noise was discovered in the examined birth and death rate dynamics, as well as in the dynamics of prices across periods. The described methods have the potential to be used beyond the limits of the presently considered historical subjects, including in investigations of different types of social transformation.
Keywords
Tasks
Our goal is to demonstrate the heuristic potential of the theory of self-organized criticality (SOC; Bak, 1996; Bak, Tang, & Wiesenfeld, 1988) in historical research projects. We applied SOC approaches and instruments to the investigation of two historical processes: (a) the evolution of demographic strategies in agrarian settlements and (b) grain market dynamics in pre-industrial and early industrial periods.
Approaches
A great number of systems that change in pink noise (1/f noise) schemes have been discovered in nature, with examples ranging from quasar luminescence to river inundation. The theory of SOC is intended to provide a universal explanation of these observations. SOC founder Per Bak (1996) defined these type of processes: There are features of all sizes: rapid variations over minutes, and slow variations over years . . . The signal can be seen as a superposition of bumps of all sizes; it looks like a mountain landscape in time, rather than space. The signal can, equivalently, be seen as a superposition of periodic signals of all frequencies. This is another way of stating that there are features at all time scales. Just as Norway has fjords of all sizes, a 1/f signal has bumps of all durations. (pp. 21-22)
Because pink noise (as in Figure 1) is a fractal phenomenon, SOC theory integrates many fractal geometry concepts (Frame & Mandelbrot, 2002; Mandelbrot, 1982). Pink noise is characterized by large-scale invariance, combining in a single process all proportions from minor splashes, through medium-sized waves, to grand tsunamis. These elements must be united by numerous connections, including feedback loops. Bak has indicated that such systems are able to generate criticality arbitrarily, as a result of a weak initial influence.

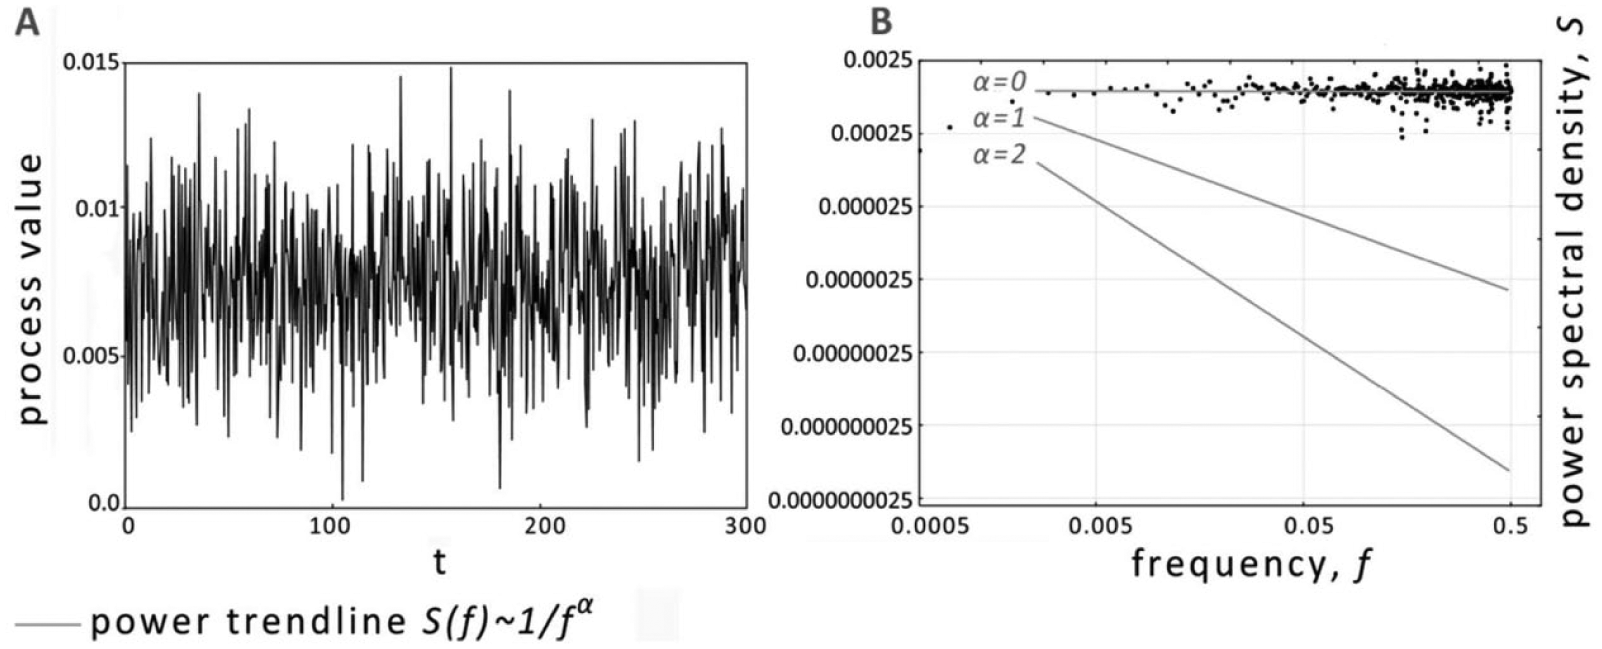
Specimen (A) and spectrogram (B) of pink noise.
A state of criticality implies that any event (even a short-term or low-energy one) has global implications. Local changes do not fade, but rather initiate diverse cause–effect chains and thus influence the entire system. A multitude of reactions and counter-reactions arise in the system, producing an ensemble of changes that generates oscillations of various scales constituting a pink noise. In this way, micro-level events generate macro-level dynamism.
This cause–effect mechanism will lead the system to a spasmodic transformation, that is, an avalanche. At some point, inert changes go to infinity abruptly and the main system parameters become unbalanced. Hence, pink noise is a presage of catastrophe, although many real systems are known to emit a pink noise for a rather long time, which means that they exist normally in a condition that is close to a failure from a critical peak.
Some social systems develop in a scheme of pink noise across distinct periods, which allows the mechanisms and dynamics of those systems to be explained in the context of SOC.
Typologically, pink noise borders white noise and red (also known as Brownian) noise, whose specimens and spectrograms are shown in Figures 1, 2, and 3. Noise color is a specific calculated process parameter.
Specimen (A) and spectrogram (B) of white noise.

Specimen (A) and spectrogram (B) of red noise.
To transfer this regularity to real (biological, social, physical, and other) systems, Bak (1996) has used the concept of an intermittent equilibrium: Large intermittent bursts have no place in equilibrium systems, but are ubiquitous in history, biology, and economics . . . The complex status is on the border between predictable periodic behavior and unpredictable chaos . . . Systems with punctuated equilibria combine features of frozen, ordered systems with those of chaotic, disordered systems. Systems can remember the past because of the long periods of stasis allowing them to preserve what they have experienced through history, mimicking the behavior of frozen systems. Meanwhile, they can evolve because of intermittent bursts of activity. (pp. 29-31, 143)
The notion that SOC could be applied to studies of social phenomena was expressed in classical publications (Bak, 1996; Turcotte & Rundle, 2002). To realize such applications, pink noise would need to be identified in some social process. Such identification provides a basis for bringing forward hypotheses and for interpreting a process under investigation in relation to universal explanations of SOC theory.
The Literature
Considerable efforts have been made to disseminate the ideas and methods of SOC theory in various sciences (including social) by Turcotte (1999; Turcotte & Rundle, 2002), Malinetskii (2013), Buchanan (2000), and Brunk (2000, 2001, 2002a, 2002b). Kron and Grund (2009) have attempted to substantiate the philosophical notion that modern societies have attributes of a critical condition.
One can find many statements suggesting that the SOC is applicable and heuristically productive in social disciplines within theoretical and review papers (Andergassen, Nardini, & Ricottilli, 2006; Borodkin, 2005; Buchanan, 2000; Clauset, Shalizi, & Newman, 2009; Frigg, 2003; Guastello, 2013; Mathews, White, & Long, 1999; Pinto, Mendes Lopes, & Machado, 2012; Turcotte & Rundle, 2002). But, outside of the field of economics, few articles contain proofs demonstrating the applicability of the SOC in concrete social processes.
One of the earliest attempts to prove the actuality of SOC in social reality is Roberts and Turcotte’s (1998) work devoted to military conflicts. Subsequently, Cederman (2003) conducted an SOC study with analogue tasks. Biggs (2005) detected SOC effects in the “class conflicts” of Chicago and in the strikes in Paris in the late 19th century. Picoli, del Castillo-Mussot, Ribeiro, Lenzi, and Mendes (2014) demonstrated an important SOC effect in the distributions of violent events. Shimada and Koyama (2015) found SOC effects in the dynamics of electoral preferences in Japan in the second half of the 20th century. Thietart (2016) analyzed changes in the intensity of strategic activities in a large corporation (Danone) between 1966 and 2008 and made similar observations. SOC is also found in the social networking activity (Sonpure & Wanjari, 2015).
We shall present in detail the results of some of these papers to demonstrate key heuristic schemes.
Roberts and Turcotte (1998) studied the details of wars occurring from the 15th to the 19th centuries and concluded the following: One can qualitatively discuss the breakdown of order in the world in a similar manner to the “forest fires” in the forest-fire model. In the forest-fire model, sometimes a match starts a fire and sometimes it does not. Some fires are large and some are small . . . In terms of world order there are small conflicts that may or may not grow into major wars. The stabilizing and destabilizing influences are clearly very complex. The results we have shown indicate that world order behaves as a self-organized critical system independent of the efforts made to control and stabilize interactions between people and countries. (p. 357)
Picoli et al. (2014) based their research on the three databases that contain information about violent events: Northern Ireland 1969-2001, Iraq 2003-2005, and Afghanistan 2008-2010. Having discovered in these data the same SOC effects that are taking place in the distribution of earthquakes, in particular, the authors used this similarity for a politological interpretation: . . . The occurrence of earthquakes has been related to the relaxation of accumulated stress after reaching a threshold as in self-organized criticality (SOC). Analogously, violent events in human conflicts could be associated with a threshold mechanism. In this scenario, a description of human conflicts in terms of SOC seems plausible. Our findings are consistent with this possibility, providing quantitative support for the analogy between patterns in human conflicts and natural phenomena exhibiting SOC. (Picoli et al., 2014, p. 3)
Shimada and Koyama (2015) attempted to evaluate the possibility of political transformation in Japan on the basis of electoral statistics. They showed that the presence of criticality signs in the social dynamics of the system may indicate that the system is ready for a large-scale transformation. Detection of SOC effects, in some cases, can be used to diagnose society’s transformational potential.
SOC effects are discovered very frequently in agent-based models. In particular, evolution modeling (Sneppen, Bak, Flyvbjerg, & Jensen, 1995) is playing a very significant role in the development of SOC theory.
Method
We assumed that a change in the noise color may indicate strength, direction, and time of the historical object transformation. We are particularly interested in detection of pink noise in historical processes. In this case, mechanisms and dynamics of relevant social systems can be explained in the context of SOC theory.
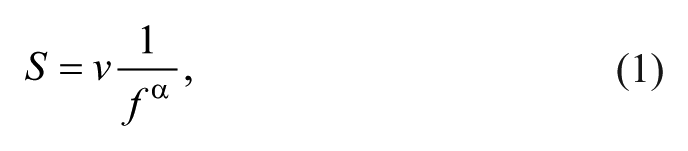
To identify pink noise, it is necessary to carry out a spectral analysis of the process/signal to be studied. The signal is decomposed into simple harmonics by way of fast Fourier transform. The coordinates of each point in the spectrogram correspond to the magnitudes of frequency and of power of a separate harmonic. In the spectrogram of a complex signal, a multitude of points (harmonics) will be represented (Figures 1B, 2B, 3B, and 4).

Spectrogram of a sample of artificial pink noise in linear coordinates (A) and in logarithmic coordinates (B).
When dealing with pink noise, the power trendline for the data points will approximate a hyperbola (Figure 4A). In a logarithmic coordinate system, a hyperbola is represented by a straight line (Figure 4B). A hyperbolic function expresses an inverse proportional dependence of the magnitudes under study. Pink noise is a highly complicated signal that consists of a multitude of harmonics; the higher the harmonic frequency (i.e., the greater the number of oscillations per unit of time), the lower the power will be. However, of course, one cannot affirm that a statistical regularity is strictly obligatory for each episode of a real process.
If the sum total of points in a spectrogram is approximated well by the power trendline, then the detected regularity looks like this:
where f is the frequency, S is the power, v is the coefficient expressing the correlation between the units of S and f, and α is the power exponent.
According to the definition of noise color types, the slope of the straight trendline depends on the value of α. The power distribution varies according to the frequencies involved (the spectral density of the power), with a precise dependence on slope. If α = 0, we can assume that the signal is referred to as white (Figure 2B). If α = 2, such noise is considered to be red noise (Figure 3B). If α = 1, then the system has 1/f noise, commonly known as pink noise (Figure 1B). Spectral analysis indicates how f and S correlate in all harmonics of an investigated signal, which allows one to calculate the value of α with Equation 1.
Regarding the question of what range of α should be considered indicative of pink noise, Bak (1996) adopted a broad definition, supposing that α values may span from 0 to 2 in pink noise. Nonetheless, there are no generally accepted clear limits for pink colored noise.
To evaluate the reliability of the model, we use the standard statistical coefficient of determination R2. The closer the value of R2 is to 1, the more reliably the trendline approximates the points of the spectrogram.
In our studies, R2 is significantly reduced if α approaches zero. Precise identification of white noise would require additional data and additional tests. Therefore, we can hypothetically consider that white noise is detected. However, the combination of low α and low R2, of course, indicates a fundamentally more chaotic process than red or pink noise, and this statement is sufficient for our interpretations.
We carried out a spectral analysis in the spectral (Fourier) analysis module of the program Statistica with the following settings: pad length-to-power of 2/yes, taper/no, subtract mean/yes, and detrend/yes. We tested the aforementioned identification procedures on an artificial pink noise sample generated by a “power noise” code (Little, McSharry, Roberts, Costello, & Moroz, 2007). We found, in particular, that for a 200-point test sample, α = 1.01 and R2 = .7.
It is important to know the minimal quantity of initial data needed for an analysis and qualitative interpretation of results because, generally, social scientists do not have large data sets at their disposal. A fragment sampling of an ordered process can appear to be a fortuitous combination of events.
We carried out more than 150 experiments with test signals of different lengths and came to the conclusion that it is possible to identify pink noise and determine its α value within a 20% margin of error if at least 75 data points are available. Previously, the minimal quantity of points required for the investigation of social processes has been suggested to be 82 (Roberts & Turcotte, 1998).
To analyze historical processes, we used two methods. First method is reduced to a simple cross-temporal comparison of α values obtained in an analysis over approximately equal periods of time.
But to obtain a more accurate view that reflects when and how characteristics of the target process changed, we suggest employing cumulative decadal comparison of α values. Let us divide the whole period of investigation into sub-periods. The initial sub-period contains 75 points, a required minimum for identification of pink noise. To the initial sub-period, we added 10 consecutive annual points (a decade) from the future. In this way, we obtain several sub-periods, each of which includes the preceding sub-periods. A schematic of these sub-periods relative to consecutive decades is shown in Figure 5.

Designation of sub-periods and decades.
For each sub-period, it is possible to compute a value of α, as well as the difference between the α values of neighboring sub-periods, notated as Δα:

Δα distinguishes the condition of the system during the analyzed decade from its past conditions. The index m for each nth decade is as follows:

where bd0 is the value of m for the initial decade d0. It can be determined on the basis of expert judgments or derived from an analysis of the statistical data.
The index m provides information about the level of some quality of the system that is indicated by the transition between different colors of noise. Contrary to α, the index m can be ascribed to a particular decade. We provide some examples of interpreting results obtained with the method of decadal comparison of α values. But we think the method needs be verified further with extensive historical data.
How Pink Noise Indicates a Change in Demographic Strategy
Hypothesis
We supposed that the appearance of pink noise in a series of demographic data indicates a change in the demographic strategy of the society. A more traditional society demonstrates necessarily a more chaotic demographic behavior (closer to pink noise). Pink noise can provide evidence of the fact that the society exists in a transitional condition, wherein chaotic behavior is combined with elements of regulation. Absolutely, red noise is likely to represent a hypothetical society wherein demographic processes are completely regulated.
Initial data
Annual figures for the numbers of births and deaths in some agrarian settlements of Russia’s Tambov region were used as the initial data (Kanishchev, 2015).
Results and interpretation
We compared time periods, some of which belonged to the 19th century and others of which belonged to the 20th century. The data analysis results obtained according to Method 1 are reported in Table 1. An example spectrogram for one of the settlements (e.g., Malye Pupki) is shown in Figure 6. Values of the index variable m for births in the same settlement are shown in Figure 7.
Spectral Analysis of Agrarian Communities of the Tambov Region.


Spectrograms of births in Malye Pupki in the periods of 1810-1900 (A) and 1900-1998 (B).

Dynamics of m for births in Malye Pupki.
The measurement results in Table 1 and the first two points of the graph in Figure 7 have a margin of error up to 20%. Nevertheless, typological differences between the 19th and 20th centuries are evident.
Hence, we observe that the demographic behavior in the 20th century is pink noise. That is, α values fluctuate within the range of 0.89 to 1.15 (Table 1). For the 19th century, α values were in the range of 0.38 to 0.64, closer to values expected for white noise (Table 1). These results support the initial hypothesis.
Thus, α values can reveal changes in demographic behavior, providing an active application of tools for regulating major demographic indices. Any change in a system existing in a critical state will influence the behavior of all actors. This means that people, families, and settlements begin to perceive and respond to a multitude of objective conditions in which they put into effect their particular demographic strategy. And it is this multitude of reactions that generates pink noise. Among the conditions that are taken into account when instituting strategies, the availability of major vitally important resources (and more precisely, the subjective idea about the availability of those resources in the present and the future) has the greatest importance. A completely traditional society is principally local and not prone to draw upon demographic strategies in response to conditions (threatening or favorable) that are remote to it in time and space.
In the 19th and 20th centuries, the populations of all of the studied settlements were in some stage of demographic transition. It is rather problematic to confirm the hypothesis about the emergence of red noise for these objects with the given entities. The demographic transitions of Russian agrarian settlements are essentially displaced in recent times compared with those of classical Western Europe.
The graph of m in Figure 7 is essentially a diagram of farmer calamities. The dramatic changes in m coincide with major upheavals, including revolutions, wars, reforms, and so on. As a result of catastrophes of a different sort, the resource basis was narrowed, which stimulated the practice of moderating the birthrate.
In the 19th century, Russian settlements could no longer be considered fully traditional. Russian society was ready to employ new mechanisms of regulating demographic processes but was not eager to proceed with these changes. Obviously, the cataclysms in the first half of the 19th century brought about a marked hastening through regulatory mechanisms. Thus, there was a catastrophic introduction of a new demographic strategy (Zhukov, Kanishchev, & Lyamin, 2013).
In some years, the peasantry strove to return to traditional strategies. After the end of the last great cataclysm, communities transitioned to dramatically reduced birthrates of almost zero and birthrates continued to be low throughout subsequent Soviet times. By that time, however, it was not possible for farmers to return to their former demographic behavior.
Pink Noise as an Indicator of Grain Market Transformation
Hypothesis
Benoit Mandelbrot turned his attention to the wide-ranging predomination of power laws in price dynamism (Mandelbrot, 1982). A self-regulated market is an ideal example of a system in a state of SOC. It has been shown repeatedly in economic studies that there is pink noise in the price dynamics of modern markets over long periods of time.
We made some assumptions about the price dynamics of the grain market. Notably, it was assumed that grain markets are key for traditional, early industrial societies in many countries. A change in the color of noise may be an indicator of the emergence of a more unified market and of a change in regulatory intensity.
If a region has completely localized commerce and does not participate in a broader unified market for a commodity, then that commodity does not move between local regions. This circumstance leads to eminent price dependence on natural factors and fortuitous events. In such cases, the noise observed in price dynamics will be nearer to white noise. The emergence of pink noise can testify to the creation of a self-regulating market. And the existence of red noise in price dynamics can be interpreted as indicating that the market is strongly regulated by non-market instruments, such as in a monopoly or in a market with a powerful external regulator.
Initial data
We performed a spectral analysis of previously published data (Mironov, 1985) regarding the yearly prices for rye in several regions of Russia and in the European part of Russia for the years of 1707 through 1915.
Results and interpretation
The investigation was carried out in accordance with methods of comparison of α values. The results are presented in Table 2 and Figure 8. Mironov’s (1985) regional subdivisions of Russia were employed.
Spectral Analysis of Rye Prices in Russia.


Dynamics of m for the price of rye in the European area of Russia.
The measurement results in Table 2 and the first two points of the graph in Figure 8 have a margin of error up to 20%. However, this does not complicate their interpretation.
In the period from 1707 to 1781, pink noise was already evident in the grain price dynamics with a shift toward red noise. These data are consistent with the fact that the development of a Russian-wide market was evident as early as the 18th century. The national Russian and regional Russian markets (except for in the Ukraine) were strongly regulated (note that in Table 2, 1707-1781, α = 1.76). The market was obviously under strong regulatory pressure by the government, which was striving to regulate grain commerce through state purchases.
In the years of 1782-1856, the Russian-wide market and the regional markets demonstrated price dynamics with pink noise. A complete transition to a normal capitalist market, in which mature market mechanisms are the prevalent controllers of price determination, had occurred (Table 2, 1782-1856, α = 1.04). A decrease in state regulation did not take place gradually but rather occurred by leaps and bounds. The index m (Figure 8) falls steeply for the first time, from 1.44 to 1.14, around the year 1800 and falls sharply again from 1.26 to 0.81 in the 1830s.
As a result of the Continental Blockade, a significant part of the export commodity flow turned to the domestic market. The growth of trading volume led to a reduction in the state’s influence on the market in the late 1800s.
The next phase of the market denationalization in 1830 was apparently caused by a reduction in the market share of government contracts for grain for the army. Military reform included the establishment of self-sustaining communities of plowing soldiers.
In the period encompassing 1841-1915, the Russian-wide and regional markets persisted in the system that had emerged in the first half of the 19th century. It should be noted, however, that a sharp increase in regulation occurred in the 1870s when m falls sharply to 0.65 (Figure 8), a value that is within the framework of the classical market, but nearer to chaos than it had been previously. This was a period of global economic crisis. Shortly thereafter, in the 1880s, a jump of m from 0.65 to 0.99 occurs coincident with the re-establishment of a normal functioning market.
Conclusion
Our implementation of SOC analytical instruments produced results that can be interpreted from a historical viewpoint. Noise color changes in a number of instances appeared to be indicators of changes in historical processes. Such shifts can help historians pinpoint the time, speed, and direction of state transitions of social forces. Our spectral analyses of annual demographic data (i.e., birth and death rates) and annual grain prices over about two centuries revealed substantial changes in α over the examined periods. In the demographic data analysis, changes in α reflected local settlements shifting from traditional to modernized demographic strategies. Meanwhile, in the grain market analysis, changes in α reflected the emergence of a nationally unified, self-regulating grain market and the weakening of state regulatory functions.
Employing decadal comparison of α values, we set out to measure and localize changes that had occurred with within-decade resolution. Overall, the results we obtained coincide with and supplement, to some extent, established historical conceptions. Nevertheless, the method itself requires further verification with large historical data sets.
We were able to detect pink noise in the investigated processes during some periods. The presence of pink noise substantiates the conclusion that there are fundamental causes for the emergence of the observed effects. The assumptions about the mechanisms for the emergence of pink noise were based fully on SOC theory.
The present SOC-informed methods and interpretations have the potential to be used in studies of historical processes beyond those described here. There is great heuristic potential for utilization of SOC theory. We believe that such research endeavors could promote the development of ideas about the origins of various cyclical phenomena and transient social transformations and how they conform to natural laws, as well as the development of ideas about how micro-level events are connected to the macro-dynamic factors of social systems.
Footnotes
Acknowledgements
The authors are particularly grateful to Dr. Leonid Borodkin, Dr. Ann Power Smith and Dr. Dmitry Mikhlik for useful advice.
Declaration of Conflicting Interests
The author(s) declared no potential conflicts of interest with respect to the research, authorship, and/or publication of this article.
Funding
The author(s) disclosed receipt of the following financial support for the research, authorship, and/or publication of this article: This work was supported by Russian Foundation for Basic Research (No. 14-06-00093a) and by the Russian Ministry of Education and Science (No. 33.956.2014/K).