
Abstract
The aim of this article was to determine the mismatch between the existing desks and chairs in elementary schools and the anthropometric measurements of students in several regions of Central Java, Indonesia. Based on the mismatch, recommendations are given to improve the fit of the desks and chairs with the students’ anthropometry. Five critical dimensions of desk and chair were included in the analysis: seat height (SH), seat depth (SD), seat width (SW), desk height (DH), and under-desk clearance (DC). The analysis provided three critical chair dimensions and two critical desk dimensions with a high degree of mismatch. ANOVA and Tukey tests were performed to determine the grouping of students’ anthropometric data. Four sizes of chair and three sizes of desk are proposed based on the results of the analysis. The proposed dimensions lower mismatch more than the existing dimensions.
Introduction
Desks and chairs are important pieces of furniture in elementary school. Students spend most of their time in class using this furniture. School furniture is used extensively by students during the vital period of human physical development, and 80% of the time, students were in forward sloping positions (Knight & Noyes, 1999). Storr-Paulsen and Aagard-Hansen (1994) noted that 8- and 9-year-old children were expected to sit more than 60 min in any given 90-min period at school. Unfortunately, many researchers have found a mismatch between the students’ body dimensions and the available furniture (Dhara, Guruchara, & Sau, 2009; Domljan, Grbac, & Halina, 2008; Gouvali & Boudolos, 2006; Lin & Kang, 2012; Panagiotopoulou, Christoulas, Papanckolaou, & Mandroukas, 2004; Parcells, Stommel, & Hubbard, 1999). According to Agha (2010), anthropometric measurements were an important factor that should be taken into account when designing school furniture. Omitting the students’ anthropometry from the design will result in inappropriate furniture for the students. Several negative effects were found due to the omission of anthropometry. For example, a study in Hong Kong showed that musculoskeletal symptoms were one of the top 10 health problems (Lee, Tsang, Lee, & To, 2001) that occurred due to the omission of anthropometry. The omission also led to poor posture in sitting, writing, or typing, which was determined to be the cause of pain in the back, shoulders, legs, and eyes (Domljan et al., 2008; Gierlach, 2002).
According to Gonzalez, Quesada, and Bahill (2003), well-designed school furniture has been shown to contribute to the learning process. They also pointed out that elementary schools in some developing countries had several furniture problems, such as wobbling, being of low quality, having rough writing surfaces, falling apart quickly, and not fitting the children. Several studies have been conducted to analyze these furniture problems, mainly in terms of the fit of the desks and chairs to the students’ anthropometry. Castellucci, Goncalves, and Arezes (2010) took several anthropometric measurements for school furniture and found that Portuguese students had a smaller stature compared with students from other European countries. They concluded that an additional size mark needed to be added to the existing standard. Gouvali and Boudolos (2006) conducted a study to analyze the mismatch between desk and chair dimensions and the anthropometry of students in Greece. They found a high degree of mismatch, especially for desk height, seat height, and seat depth. In Hong Kong, Chung and Wong (2007) conducted a study to determine the recommended seat height, seat depth, and desk height. They also tried to determine the relationships between perceived health conditions and several musculoskeletal problems, such as neck pain and back pain, with the desk and chair dimensions. A study by Kane, Pilcher, and Legg (2006) in New Zealand revealed a 96% mismatch between school furniture and the students’ anthropometry.
Motmans (2006) suggested a slanted desk top, a forward sloping chair, and different sizes of furniture corresponding to the body dimensions of students. Lin and Kang (2012) developed and proposed several design concepts to accommodate three types of designs for a full range of students. Those three types were the extreme design, average design, and adjustable design. The extreme design was a design for students with an extreme figure, such as those who were fat, thin, tall, and short. The two others were designed for ordinary students. The average design was designed for students who were not suitable for the extreme design or the adjustable design. In that study, several considerations were taken in account when they developed these designs. The study considered teaching activities, production issues, management convenience, and material as determinant factors for good design. Jermolajew and Newhouse (2003) conducted a study considering three aspects of desk and chair design: a nonadjustable environment, an adjustable environment, and students with disabilities. Their study showed a huge variation in physical characteristics and emphasized the importance of adjustable furniture to accommodate a greater range of body sizes and shapes due to the rapid physical changes that occur during adolescence.
This study is started by following the above studies that analyzed the mismatch between elementary school desks and chairs and the students’ anthropometric data. This study was conducted in Central Java, Indonesia, where, from prior observation in several elementary schools, we found that the dimensions of the existing desks and chairs had the same dimensions for all students from Grades 1 to 6. Recommendations are given based on the results of the analysis. The recommendations deal with the sizes and dimensions of desks and chairs that will fit better to the students’ anthropometry.
Materials and Methods
Participants
The participants of this study were elementary school students from 11 public elementary schools in seven regions of the Central Java Province of Indonesia: Surakarta, Karanganyar, Sukoharjo, Wonogiri, Boyolali, Sragen, and Klaten. In this study, we included 466 students from Grades 1 to 6. On average, six students were chosen from each grade at each school. The focus of this study was on the public elementary schools because, from our prior observations, these schools had more mismatch problems than private elementary schools. Among the observed problems, the use of one desk and chair design for all grades was considered to be the biggest. A letter of consent was sent to each school to obtain permission to conduct the anthropometric measurements. Random number tables were used to select the students.
Anthropometric Measurements
The following six anthropometric measures were collected in this study: hip breadth (HB), sitting shoulder height (SSH), sitting popliteal height (SPH), sitting knee height (SKH), buttock popliteal length (BPL), and sitting elbow height (SEH). Five critical dimensions of the desks and chairs were measured: seat height (SH), seat depth (SD), seat width (SW), desk height (DH), and under-desk clearance (DC). The annotations for each body dimension were adopted from Pheasant (2003). A tape measure was used to measure the desk and chair dimensions and the students’ anthropometry. To be specific, a metal tape measure was used to measure the critical dimensions of the desks and chairs, whereas a body measuring tape was used for anthropometric measurements. Figure 1 shows the use of body measuring tape for the anthropometric measurement. Both instruments for measurement had the same accuracy (1 mm). Ten research assistants were recruited to help in the measurement process. Trainings were given to the assistants before the actual measurement. The assistants were taught what and how to measure the anthropometry. Several practices were conducted prior the actual measurements to minimize the measurement error. The reliability assessment of the measurement results was conducted qualitatively by directly comparing the results of several measurements.

Body measuring tape used in the measurement.
All statistical analyses in this article were performed using Minitab 17. Normality tests were performed prior to statistical analyses. The Ryan–Joiner method was used to test the normality of the data. We also evaluated the probability plot of the data to find the upper and lower outliers. If the normality tests failed to accept the H0, then the outliers on both sides of the probability plot were deleted and treated as missing data. The missing data were then replaced by the mean of the respective data as suggested by Rowe, Mahar, Raedeke, and Lore (2004). After the normality test, hypotheses tests were performed to determine whether there were any differences in the mean of anthropometric measurements by gender. These tests were needed to determine the basis for data grouping. If the hypothesis tests failed to reject the H0, then the chair and desk dimensions were the same between boys and girls and the dimensions were differentiated based on their grade levels.
Mismatch Criteria
There were many mismatch criteria in the literature. The following match criteria were used in this study:
Seat height (SH)
A mismatch was defined when the seat height is either >95% or <88% of the popliteal height (PH; Panagiotopoulou, Christoulas, Papanckolaou, & Mandroukas, 2004). This criterion was adjusted by 2 cm for shoe height. Equation 1 shows the match criterion for the seat height:

Seat depth (SD)
The match criterion is defined in Equation 2 and is adopted from Gouvali and Boudolos (2006):

Seat width (SW)
The mismatch of seat width occurs when the hip breadth (HB) is narrower than the seat width (Castellucci et al., 2010). Gouvali and Boudolos (2006) proposed that the seat width should be at least 10% (to accommodate hip breadth) and at most 30% larger than hip breadth (for space economy). We used the criterion proposed by Castellucci et al. (2010) because it was simple and used by many researchers. Equation 3 determines the match criterion.

Desk height (DH)
The minimum and maximum value of the desk height was determined using Parcells’s criteria (Parcells et al., 1999). Equation 4 shows the criterion:

Under-desk clearance (DC)
The under-desk clearance must provide enough room for the students’ knees (Gouvali & Boudolos, 2006). Parcells et al. (1999) proposed that the desk clearance should be 2 cm higher than the sitting knee height (SKH). In this study, we used the criteria suggested by Parcells et al. because, from our previous observations, the desk provided enough room for the knees. The match criterion is defined according to Equation 5:

Results and Discussion
Classroom Furniture and Sample Characteristics
The classroom furniture at each school seemed to have one common design and set of dimensions for all grades. Only one classroom had more than one desk and chair size. We selected and measured one desk and chair that represented the majority of the desks and chairs from each classroom. Sometimes the desk and chair sizes did not necessarily correspond to the appropriate grades, that is, larger size desks and chairs used by students in higher grades. In this study, it was found in several schools that the larger size desks and chairs were used by students in lower grades. The average desk and chair measurements for each grade can be seen in Table 1. We took 466 measurements from 225 boys and 241 girls. The sample characteristics are shown in Table 2. From the table, we can see the average age, weight, and height of the sample from each grade.
Average Dimensions of Desk and Chair in Each Grade (in cm).

Sample Characteristics.

Matching the Furniture to the Anthropometric Measurements
Using Equations 1 to 5, a mismatch analysis was performed to determine the percentage of mismatch between the furniture and anthropometric data. The analysis was performed by comparing students’ anthropometric data with the critical dimensions of the desks and chairs from each grade using the previously mentioned criteria. The percentage of the mismatch can be seen in Table 3. From the table, the greatest mismatch problems occurred in desk height and seat height. The average mismatch percentage of the desk height was 90.54%, whereas the average mismatch percentage of seat height was 90.87%. The mismatch percentage of seat height was considered high for Grades 1 to 5 and moderate for Grade 6. The seat depth had a moderate mismatch percentage at an average of 57.85%. The seat width and under-desk clearance had the lowest mismatch compared with the other dimensions; hence, these measurements had almost no problems in mismatch at average percentages of 3.58% and 3.97%, respectively. For a more detailed analysis, we divided the mismatch into two parts especially for bidirectional equations for seat height, seat depth, and desk height. Generally, the too-low mismatch in seat height decreased as the grades increased.
Mismatch Percentage of Existing Desk and Chair.

The Statistical Analysis of Anthropometric Measurement Data
The results of the normality test, illustrated as the mean and standard deviation of the six anthropometric data, are shown in Table 4. From the table, we can see that all the data were normal at a .05 level of significance, except for the starred values that were significant at α = .01. After the normality test, the hypotheses tests were performed to determine whether there were any differences in the means of the anthropometric measurements by gender. Table 5 shows the results of such hypotheses tests at a .05 level of significance. All the data in the table showed no significant difference between boys and girls at a .05 level of significance, except for BPL among Grade 5 students, which was significant at α = .01. From the results of Table 5, we concluded that the anthropometric data were not different by gender.
The Results of Normality Tests, Mean, and Standard Deviation of the Six Anthropometric Data.

Significant at α = 0.01.
The Results of Anthropometric Hypotheses Test by Gender.
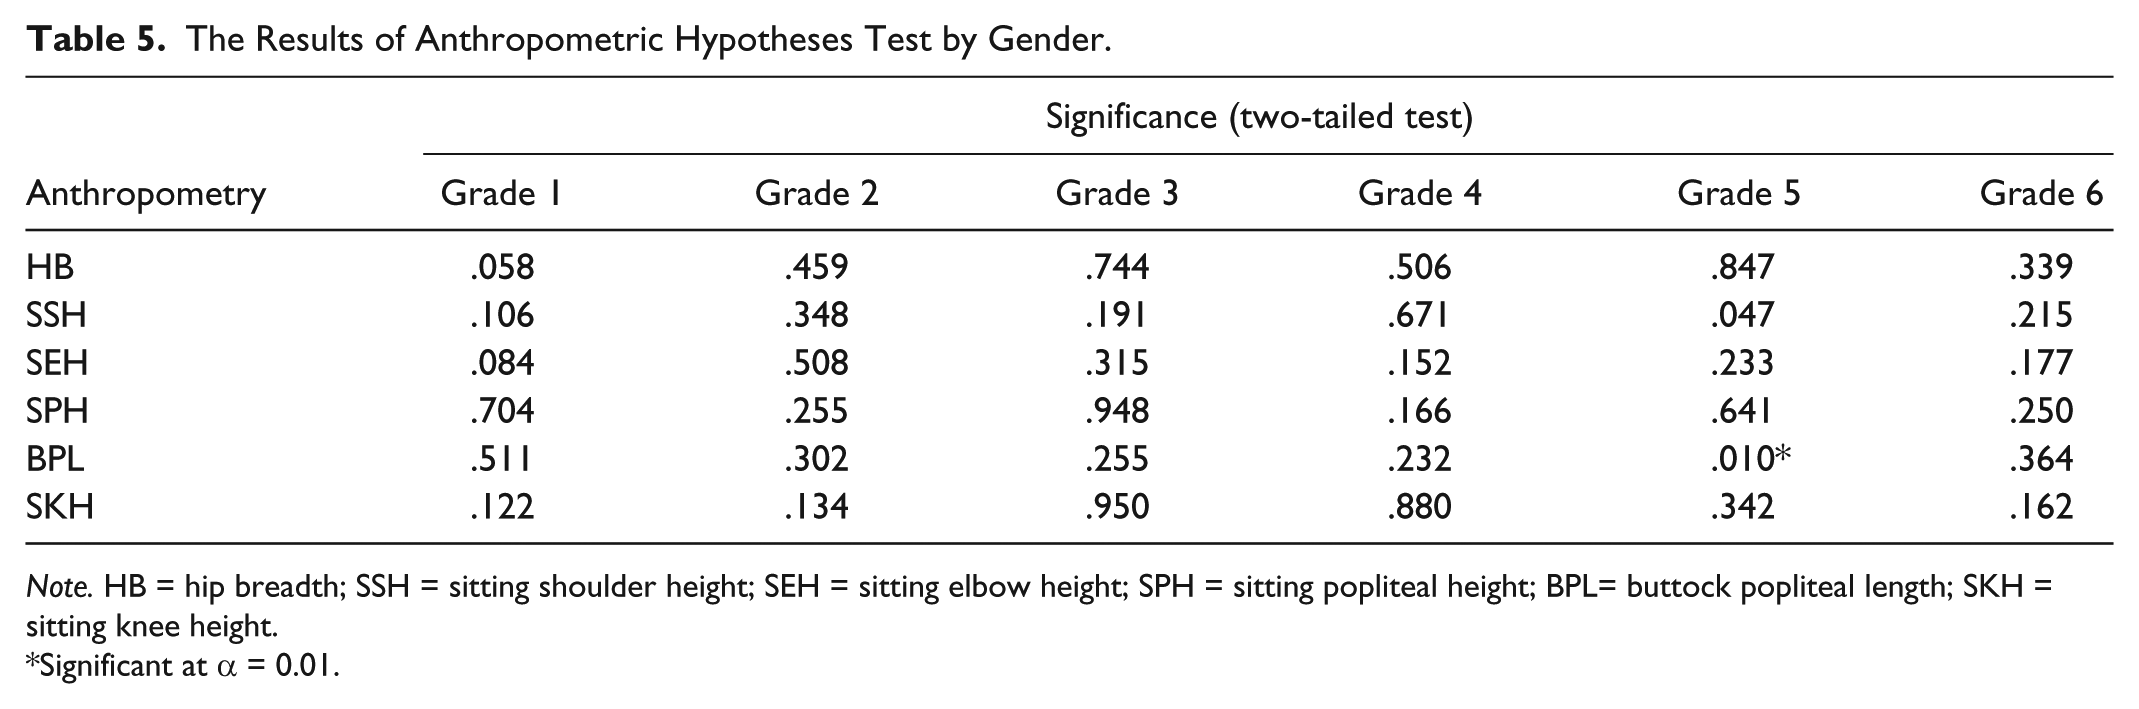
Note. HB = hip breadth; SSH = sitting shoulder height; SEH = sitting elbow height; SPH = sitting popliteal height; BPL= buttock popliteal length; SKH = sitting knee height.
Significant at α = 0.01.
We further performed a one-way ANOVA and a Tukey test to determine the grouping of students’ anthropometric measurements based on their grades. Those analysis tools have been used by many researchers to analyze anthropometric data (Agranani, Cogo, & Gualdi-Russo, 2008; Franchini, Sterkowicz-Przybycien, & Takito, 2014; Perissinotto, Pisent, Sergi, Grigoletto, & Enzi, 2002). From the results of Tukey test, the findings were as follows:
There were five groups for sitting popliteal height, the determinant of seat height: Grade 1, Grade 2, Grade 3, Grade 4, and Grades 5 and 6.
For hip breadth, the determinant of seat width, there were three sizes: Grades 1 and 2, Grades 3 and 4, and Grades 5 and 6.
For the buttocks (popliteal height), the determinant of seat depth, there were three groups: Grades 1 and 2, Grades 3 and 4, and Grades 5 and 6.
For sitting shoulder height, the determinant of desk height, there were five groups: Grade 1, Grade 2, Grades 3 and 4, Grade 5, and Grade 6.
For sitting elbow height, the determinant of desk height, there were four groups: Grade 1, Grade 2, Grades 3 and 4, and Grades 5 and 6.
The sitting knee height had five groups: Grade 1, Grade 2, Grade 3, Grade 4, and Grades 5 and 6.
The results of the Tukey test suggested several changes. The most important was that the desks and chairs must be designed in several sizes for different groups. From the mismatch analysis, we determined that there were no problems with the seat width and under-desk clearance because those two variables had the lowest percentage of mismatch. Hence, we averaged the existing dimensions for each of the two variables and set them as the dimensions of the proposed desk and chair. We then focused on two chair variables (seat height and seat depth) and one desk variable (desk height). The groups from the Tukey test were combined to provide new design dimensions for the desks and chairs. The combinations of the groups for chair design can be seen in Table 6. In the table, letters denote the seat height and Roman numerals denote the seat depth. From the table, combination A-I and B-I were used as the chair dimension for Grades 1 and 2, respectively. Combination C-II and D-II were used as the chair dimensions for Grades 3 and 4 respectively. Combination E-III was used as the chair dimension for Grades 5 and 6. The desk height had three sizes, for Grades 1 and 2, Grades 3 and 4, and Grades 5 and 6.
Possibility of Chair Design Combination.

Shaded areas denote combinations that are not possible.
To determine the critical dimensions for each design combination, the percentiles were calculated from the anthropometric data. The anthropometric data were combined to determine the percentiles corresponding to the results of the one-way ANOVA and Tukey test. The results of the calculations are shown in Table 7.
Percentiles of the Anthropometric Data.

The proposed dimensions for each design are shown in Table 8.
Proposed Dimensions for Each Design.

From Table 8, the proposed dimensions for desks and chairs are as follows:
Seat height dimension
According to Pheasant (2003), the optimal seat height for many purposes must be close to the popliteal height. If this condition cannot be achieved, then a lower seat is preferable to one that is too high. The seat height dimensions are set to the 50th percentile to fit average students using the chair. The recommended dimensions for seat height are 30.00, 32.00, 34.00, and 38.00 cm. The average height of the existing chair is about 25% higher than the new dimensions for Grade 1 and 2.56 cm higher than those for Grades 5 and 6.
Seat width
Due to the high percentage of matching between the existing seat width and the students’ hip breadth, which is the determinant dimension, we set the average dimension of the existing seat width as the dimension for the new design. The average of the existing seat width dimension is 37.70 cm.
Seat depth
According to Pheasant (2003), an ideal seat depth must support the ischial tuberosities. A deep seat depth causes problems for students standing up and sitting down. Hence, our recommendation is to use the 5th percentile for seat depth. The seat depth dimensions should be the same for Grades 1 and 2 at 27.33 cm. For Grades 3 and 4 and 5 and 6, the dimensions of seat depth should be 30.40 and 32.10 cm, respectively.
Desk height
We recommend the desk height to be set to the 95th percentile to suit more students. According to the 95th percentile of sitting elbow height in Table 7, the desk height should have the dimensions of 59.25 cm for Grades 1 and 2. The dimensions for Grades 3 and 4 and 5 and 6 are set to 65.00 and 65.50 cm, respectively.
Under-desk clearance
The under-desk clearance is set to the average clearance of the existing desk, which is 54.16 cm. This dimension did not conflict with the seat height because it provides enough space for the students. The under-desk clearance is the difference between the under-desk space and the sitting knee height of the students. The range of differences is from 21.07 to 11.18 cm.
The proposed dimensions were then fitted to the students’ anthropometry to determine the mismatch. Table 9 shows the results of the mismatch and Figure 2 shows the comparisons between the existing desk and chair dimensions and the proposed dimensions. From the figure, we can see that the mismatch from the proposed dimensions were lower than that from the existing desk and chair dimensions. The most significant decrease was in the mismatch of seat height, seat depth, and desk height, which decreased 27.25%, 25.10%, and 16.56% on average, respectively. The mismatch of under-desk clearance and seat width were decreased by 3.97% and 2.73%, respectively. Hence, the proposed dimensions give lower mismatch and perform better than the existing dimensions. At least two notes must be given from the results of this study. First, this study used small sample so the results may not be generalized to cover all elementary school in Indonesia. Second, the students’ anthropometry must be updated because the data may be changed from year to year, and hence, the results of this study must be evaluated to see the appropriateness of the results.
Mismatch Percentage of Proposed Desk and Chair.


Mismatch comparisons.
Conclusion
In this article, we analyzed the mismatch of students to the desks and chairs in several public elementary schools in Central Java, Indonesia. From the analysis, it was found that seat height and seat depth had a high mismatch. For the desk dimensions, only desk height had a high degree of mismatch. This study produced five chair sizes and three desk sizes based on the results from feasible combinations of anthropometrical data grouping using the Tukey multiple means test. From the combinations, five new dimensions are proposed that may lower mismatch more than the existing dimensions. One critical limitation of this study was the small sample size relative to the large number of elementary schools and students in Indonesia. Hence, for the reason of representativeness, several similar studies must be conducted in other regions or provinces in Indonesia. Other directions for the next study are the development of several design concepts, detailed design, and prototypes.
Footnotes
Declaration of Conflicting Interests
The author(s) declared no potential conflicts of interest with respect to the research, authorship, and/or publication of this article.
Funding
The author(s) disclosed receipt of the following financial support for the research and/or authorship of this article: This article is a part of research funded by Direktorat Jendral Perguruan Tinggi (DIKTI) under International Research Collaboration and Scientific Publication Scheme with Contract Number 339/UN27.11/PL/2015.