
Abstract
Cognitive diagnosis models (CDMs) represent an emerging evaluation theory. They enable the identification of students’ mastery of fine-grained knowledge points, thereby facilitating the description of learning trajectories, which can in turn assist teachers in instructional planning. This study investigates the mathematics skills of rural primary school pupils in China by applying a cognitive diagnostic model to assess the mathematical competencies of sixth-grade students. The findings indicate that the learning trajectory of these rural students is non-linear. Overall, their mathematics skills are generally suboptimal. Performance is strongest in text comprehension, knowledge and concepts, and computation, but weakest in spatial imagination.
Plain Language Summary
What are the specific strengths and weaknesses of rural students in mathematics? Our study set out to answer this question by giving a detailed “learning check-up” to sixth-grade students in rural China. We used a modern assessment method that goes beyond a single test score. Instead, it pinpoints exactly which mathematical skills a student has mastered and which they are struggling with. This allows us to map out their personal “learning path.” Our findings revealed a clear pattern. Overall, the students’ math skills need improvement. They are best at understanding word problems, remembering math facts and concepts, and performing calculations. However, they face the greatest challenge with spatial imagination, the ability to picture and manipulate shapes in their minds, which is crucial for geometry. We also found that students don’t learn these skills in a simple, straight line. There is a common, but complex, path from mastering basics to tackling more difficult skills like spatial imagination. This information is vital for teachers. By knowing exactly where each student is on their learning path, instruction can be tailored to help them strengthen their weak areas, especially spatial skills, and build a more solid foundation in mathematics.
Introduction
Student backgrounds, learning styles, and learning needs are becoming increasingly diverse. Consequently, rural schools face significant pressure similar to all schools. Studies indicate that one in four school-age children lives in rural areas or small towns in the United States, yet most of the 50 states prioritize urban children’s education (Beeson & Strange, 2000). Analysis of demographic, economic, and educational trends reveals that rural areas experience declining working populations, economic deterioration, and imperfect competition in enrollment rates (Herzog & Pittman, 1995). Multiple scholars conclude that rural education research remains limited (Arnold et al., 2005). Evidently, rural education demands immediate attention. Topics such as education-driven economic development, equitable rural education provision, and professional training/rewards for rural educators have also garnered researchers’ attention (DeYoung, 1987).
China possesses a substantial rural population, accounting for approximately 36% of its total population. However, significant disparities in educational outcomes persist between rural and urban students. Rural Chinese children’s learning achievement is significantly lower than that of their urban counterparts (D. Zhang et al., 2015), a gap evident in specific domains such as mathematical deductive reasoning competence (MDRC), where urban students significantly outperform rural students (Hao et al., 2024). Contributing factors include the generally lower instructional capacity of rural teachers (J. Li et al., 2020) and the particular challenges faced by rural left-behind children, who perform worse on homework and tests, attain lower educational levels, and experience more psychological difficulties (Qiu et al., 2024). Early foundations for mathematical learning are also weaker in rural areas; for instance, children with Mathematics Learning Difficulties were found to have lower preschool spatial skills and visual attention (Liu et al., 2025). Furthermore, math anxiety is prevalent among rural children, highlighting a need for peer support (C. Wang et al., 2025).
Recognizing these challenges, China has consistently prioritized rural education through recent policy initiatives. Key measures include the 2024 “Special Post Plan” recruiting 37,000 teachers for rural schools, the 2025 focus on maintaining necessary small-scale rural schools and strengthening student nutrition plans, and the overarching goal in the “Outline of the Plan for Building a Strong Education Country (2024–2035)” to promote high-quality, balanced, and integrated urban-rural development in compulsory education. Preliminary evidence suggests such policies can have a positive impact; for example, the Free Education Policy has been shown to reduce the intergenerational transmission of low cognitive scores in rural China (Z. Zhang et al., 2025). Given that mathematical skills are essential for global competitiveness (Grady et al., 2012), research aimed at enhancing the quality of mathematics instruction for rural students is crucial not only for educational equity but also for improving their future prospects.
This study aims to evaluate the mathematical skills of rural primary school students in China. This study is divided into three parts. First, the existing achievements of rural education are introduced. Second, the cognitive diagnostic model (CDM) theory, which will be used in this article, is introduced. Third, a test and analysis of the mathematics skill are presented.
Rural Education
Rural Education
Rural areas comprised 45% of the world’s population in 2018, a proportion projected to decline to 40% by 2030 (GOV.UK, 2021). Rural education represents a critical challenge in contemporary education systems. Mathematics education is recognized as every child’s right. But studies indicate a mathematics achievement gap between rural and urban students. Using PISA 2000 data, Williams (2005) examined cross-national variations in mathematics performance among 15-year-olds across 24 industrialized countries. In 14 countries, rural mathematics scores were significantly lower than those of urban and medium-sized communities (Williams, 2005). Cox (2000) investigated rural and urban students’ participation and achievement in mathematics subjects. The results reveal that gender differences vary by assessment type, with significant regional effects indicating rural students—particularly boys—consistently underperform relative to urban peers (Cox, 2000). Rural students in Australia and elsewhere demonstrate lower mathematics performance and reduced likelihood of pursuing advanced mathematics (Murphy, 2021). Australian rural schools express particular concern regarding mathematics education quality (Goos et al., 2011). Urban students consistently outperform rural counterparts in mathematics (Jorgensen & Lowrie, 2014). Factors such as inadequate access to quality education, limited resources, socio-economic constraints, and cultural perceptions contribute to a significant disparity between urban and rural students in learning abilities (Darvekar, et al., 2025). Another reasons is students in lower socio-economic rural areas are often doubly disadvantaged, facing limited technology access at school and home (C. Guo & Wan, 2022; Kara, 2021). These findings demonstrate severe challenges in rural education.
Rural Education in China
China, as a highly populous nation, contains a substantial rural population with numerous rural students. Approximately 36% of China’s population resided in rural areas (National Bureau of Statistics of China, 2021). However, a significant urban-rural academic achievement gap persists. Rural and migrant children’s educational performance remains significantly lower than urban peers’ even after controlling for personal attributes such as nutrition and parenting styles (D. Zhang et al., 2015). China’s rural education deficiencies manifest through high dropout rates, low enrollment, inadequate teacher quality, resource shortages, and misaligned curricula (Ayoroa et al., 2010). China exhibits particularly pronounced urban-rural education disparities (Streefkerk, 2021). To improve rural students’ academic outcomes, China has implemented policies including the “14th Five-Year Plan for Preschool Education Development” and “14th Five-Year Plan for County-Level High School Enhancement.” Despite this, rural education—especially mathematics—continues to lag behind urban standards. Rural students demonstrated lower performance in cognitive domains and mathematics abilities assessed by the TIMSS program (Chen, 2012). But rural teachers, challenged by limited access and support, displayed lower proficiency and less positive attitudes (M. Li, 2024). Urban students achieved significantly higher mathematics scores, particularly in higher-order competencies (Zhou et al., 2017). Rural junior secondary students generally perceived their mathematics classroom environments unfavorably and held less positive mathematics attitudes (Yang, 2015).
Research Purpose and Specific Questions
Multiple factors contribute to these outcomes, including the socioeconomic gap between rural and urban areas in China—described as “two societies” (Wang, 2012). Conversely, enhancing rural education, particularly students’ mathematical proficiency, is essential for economic development. Mathematical attainment correlates with educational advancement, socioeconomic status, employment, health outcomes, and financial stability (Zacharopoulos et al., 2021). When controlling for confounders such as socioeconomic status, choosing not to study mathematics at A-level reduces future income by 11% compared to mathematics students (Adkins & Noyes, 2016). Consequently, improving rural Chinese students’ mathematical skills may shape their futures.
Existing studies employ diverse methodologies. Biddle and Azano (2016) identified rurality as an educational determinant through case studies. Webster and Fisher (2000) and Williams (2005) utilized multilevel modeling to examine educational opportunity disparities between rural and urban schools. Jorgensen and Lowrie (2014) proposed a theoretical model for rural-urban mathematics achievement differences. However, mathematics education often overlooks rural contexts, with limited cross-disciplinary awareness between mathematics and rural education researchers (Bush, 2005). This gap extends to China, where rural mathematics instruction remains understudied (Yang, 2015). Learning trajectories bridge teaching and learning processes, informing instructional design (Jia et al., 2021). Exploring learning trajectories of rural students’ mathematical skills could thus provide pedagogical foundations. This study bridges rural and mathematics education by investigating these learning trajectories.
CDM
CDM can be used to explore students’ different mathematics skills. Authors (2021) analysis the response data of 30,092 students from 14 countries in the Program for International Student Assessment (PISA) 2012, and found that learning trajectories of statistical knowledge. Wu et al. (2020) found that students from Australia, Canada, the United Kingdom, and Russia shared similar main learning trajectories in the mathematics content field, while Finland and Japan were consistent with their main learning trajectories by 24,512 students from 10 countries. Bai (2020) focuses on developing a learning progression of probability for middle school students, and it found that the level of probabilistic thinking of middle school students is improving steadily, the students in grade 8 are slightly regressive. These results demonstrate the feasibility and superiority of using cognitive diagnosis models to develop a learning progression.
The single score is usually used in a traditional test, but examinees with the same score often have different knowledge statuses and cognitive structures. The theory of CDM is to combine cognitive processes with measurement methods by using the appropriate measurement model to diagnose different cognitive structure patterns to quantitatively examine the cognitive structure and individual differences of candidates. CDM is widely used in mathematics education research (Authors, 2021; Wu et al., 2020). The construction of a CDM is based on two elements, one of which is the Q matrix. Q matrix is the associated matrix of items and attributes and is used to calibrate which attributes per item are checked. For example, the Q matrix

means the first item examines the first and the third attributes. The second item examines the last two attributes. All the items examine the third attributes. Based on Q matrix and the students’ responses, the probability of mastering each attribute can be obtained based on cognitive diagnostic models.
The second element is statistics model. There are a series of models used to identify the potential cognitive characteristics or skills of students. Such as deterministic inputs; noisy “and” gate model (DINA) model, deterministic input; noisy “or” gate (DINO) model, and generalized DINA (G-DINA) model.
One of the most popular model is G-DINA model (de la Torre, 2011). G-DINA can be written as follows:
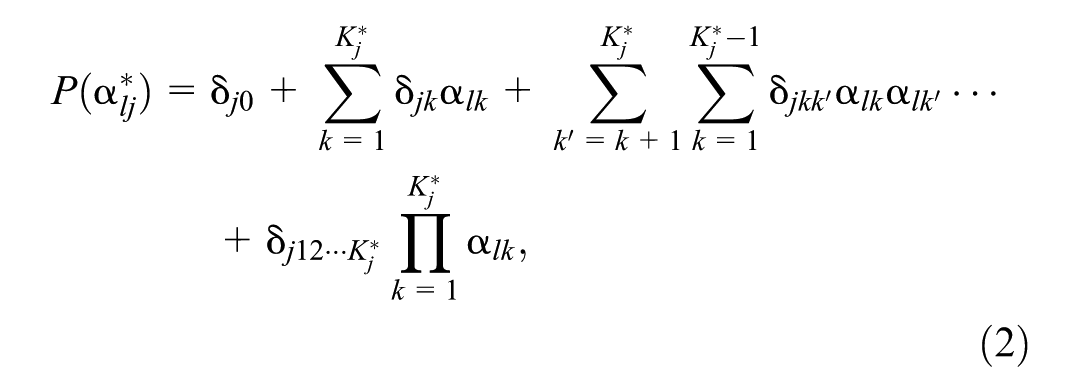
Where
The DINA model and DINO model can be obtained from the G-DINA model by setting parts of the parameters to zero. So, G-DINA model can degenerate into many other models, which is one of the reasons why it is widely used.
Methods
Participants
This study selected one county in China. The selected county situated in Northeast China’s major grain-producing region, it shares the dominant agricultural economic structure common to rural counties nationwide. Its medium socioeconomic standing mirrors the transitional development stage characterizing most rural counties under China’s regional coordination policies. The county’s teacher allocation patterns, resource availability, and curriculum implementation reflect the standardized yet resource-constrained environment typical of China’s rural compulsory education system.
The county comprises 10 villages. Two villages were randomly selected, yielding a sample of 119 sixth-grade students. 20% of the schools were selected from the county (not villages), with a total of 136 sixth grade students. A total of 255 examination papers were issued according to the number of students, and 246 valid test papers were recycled. The 246 valid test papers were used in the following research. This study secured parental consent and Institutional Review Board approval.
Q Matrix
Building on diverse mathematical competency frameworks documented in prior research—including Chen’s (2012) operationalization of geometric/alebraic constructs, Im and Park’s (2010) multi-dimensional taxonomy, and George and Robitzsch’s (2014) process-oriented model—this study’s self-developed test employed a six-attribute structure rigorously validated through tripartite alignment: (a) theoretical grounding in China’s “double base” paradigm (fundamental knowledge: knowledge/concepts; basic skills: computation) as per Y. Guo et al. (2018) and geometry/spatial cognition principles (Hilbert & Cohn-Vossen, 2021; b) empirical concordance with rural teacher consultations (3 practitioners affirming attribute relevance) and literacy-mathematics linkage research (Duru & Koklu, 2011; c) policy adherence to China’s 2022 Curriculum Standards mandating mathematical expression.
Existing research exhibits diverse attribute frameworks for mathematical skills, such as: scores and senses; operations; data representation analysis and probability; geometry; and algebra (Chen, 2012); or numeracy, algebra, spatial graphics, data and probability, measurement, knowledge and concepts, computation, equations, problem restructuring and reasoning (Im & Park, 2010); or representation, computation, interpretation, and argumentation (George & Robitzsch, 2014).
Chinese mathematics education emphasizes the “double base”—aseleizesso knowledge and basic skills (Y. Guo et al., 2018). Knowledge and concepts represent core components of fundamental knowledge, while computation constitutes an essential basic skill. Algebra instruction in China prioritizes these two competencies. Geometry and spatial graphics form another critical domain in primary mathematics curricula. Beyond these, spatial imagination and spatial imagination are widely recognized as vital competencies in Chinese mathematics education. Spatial imagination is fundamental to geometry learning, and spatial imagination is essential for geometric understanding (Hilbert & Cohn-Vossen, 2021).
The research team consulted three rural Chinese mathematics teachers. Two perceived that primary students’ literacy skills influence mathematics learning outcomes. The third teacher endorsed the aforementioned four competencies. Text comprehension and mathematical expression significantly impact mathematics performance (Duru & Koklu, 2011). China’s latest Compulsory Education Curriculum Standards (2022) explicitly advocate cultivating students’ ability to “express the real world through mathematical language.” Contemporary basic mathematics education in China emphasizes information processing and mathematical communication abilities. Aligned with existing research and expert input, this study classifies test items along skill dimensions: computation, text comprehension, spatial imagination, mathematical expression, spatial imagination, and knowledge and concepts. Table 1 specifies each attribute’s operational definition.
Attributes of Skill Dimensions.

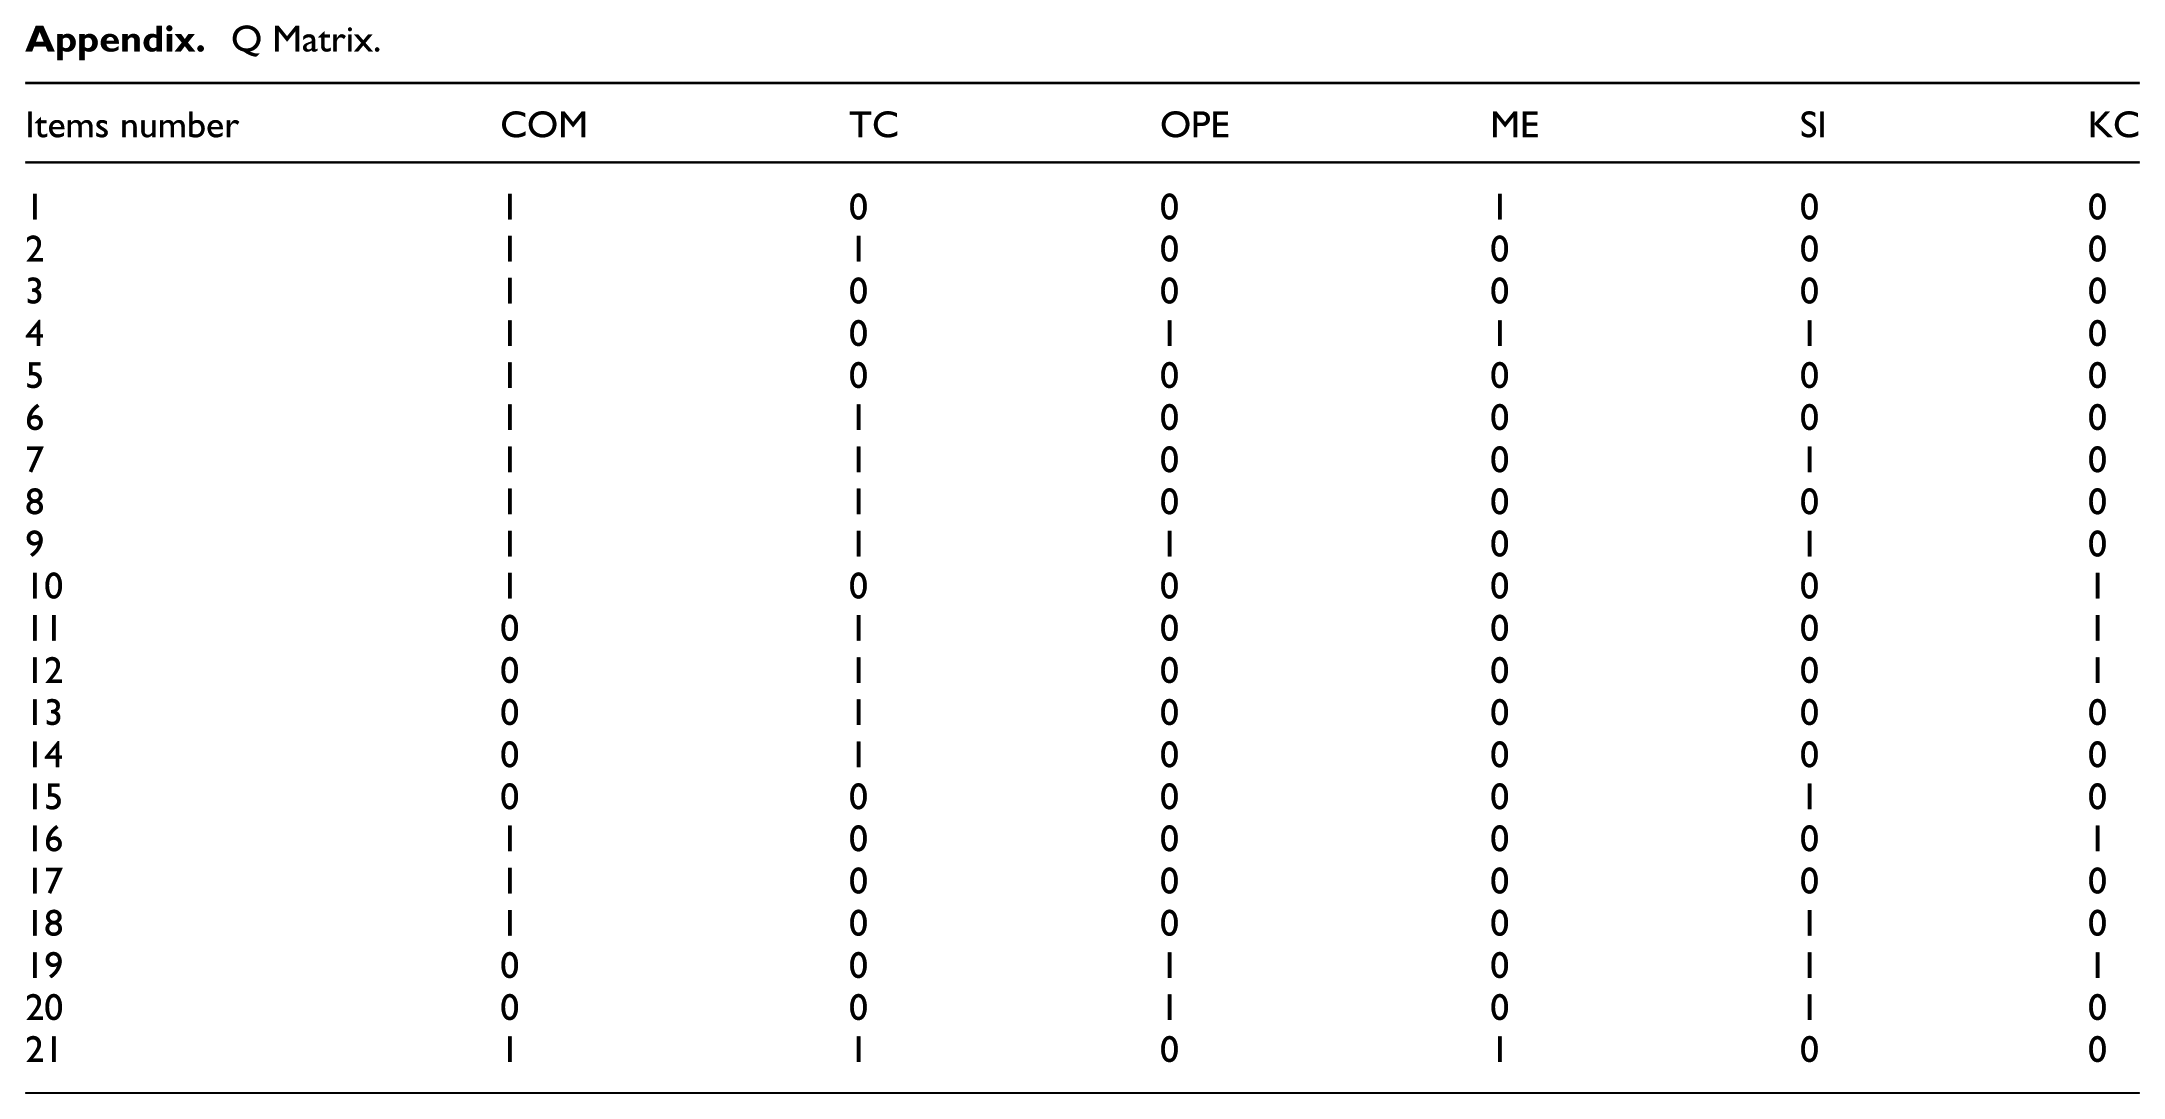
A mathematics test based on the aforementioned skill attributes was developed by the research team, comprising three primary mathematics teachers and two mathematics education doctoral candidates. Following pilot testing and revision, 21 items were retained. A Q-matrix with 21 rows and 6 columns was constructed, mapping 6 attributes to 21 items. Q matrix explained which dimensions (attributes) in Table 1 were examined for each question. The rows represent the items, and the columns represent the attributes. This structured mapping ensures our assessment comprehensively covers the six key mathematical competencies. Due to space limitations, it has been included in the appendix. All attributes were coded through consensus by four item development specialists and validated by three primary teachers. Data analyses were conducted using the flexCDMs platform (Tu, 2019) and R packages GDINA in the software RStudio (version 1.2.5033).
Model Selection
A large number of cognitive diagnosis practices have shown that choosing an appropriate cognitive diagnostic model is an important prerequisite for an accurate diagnosis or classification of subjects (Tatsuoka, 1984). In this research, two reference standards AIC (Akaike’s information criterion) and BIC (Bayesian information criterion) are used in this study. Ideally, the model with the smallest AIC and BIC should be chosen. If only AIC or BIC reaches the minimum, it needs to be discussed according to the actual situation. DINA is the most commonly used uncompensated model, DINO is the most commonly used compensated model. The DINA model and DINO model can be obtained from the G-DINA model by setting parts of the parameters to zero. So, G-DINA model can degenerate into many other models, which is one of the reasons why it is widely used. Based on the main effect of each attribute, the interaction effect between each attribute can calculate the student’s grasp of the probability of grasping the students’ dimensions. The result of comparison of different models are shown in Table 2.
Parameter Statistics Comparison of Different Models.

The results in Table 2 showed that G-DINA model has the minimum in AIC, DINA has the minimum in BIC. Considering that the G-DINA model can degenerate into the DINA model, and the AIC of the G-DINA model is much smaller than the AIC of the other two models, this study chose the G-DINA model for further research. The probability of the six contents of the skill dimension was calculated based on the G-DINA model.
Reliability
Cognitive diagnostic assessment reliability was examined through dual approaches: Cronbach’s alpha under Classical Test Theory (CTT), and attribute retest consistency (Templin & Bradshaw, 2013). Cronbach’s α = .8116 > .7 indicates high CTT reliability. Templin and Bradshaw (2013) estimated test-retest reliability via posterior distribution simulation. The reliability indices for the six attributes were .9805, .9734, .9055, .8834, .9043, and .8685—all exceeding .7. These results collectively indicate high overall reliability.
Discrimination
Discrimination is another indicator used to measure the quality of test questions. It is generally believed that the higher the discrimination value, the greater the difference in answers from students of different levels, and the higher the quality of the test questions. The quality of the cognitive diagnostic assessment and its items was evaluated by calculating item discrimination indices (Wu et al., 2020). The discrimination degree of the cognitive diagnostic test dj is defined as

Pj(1) represents the likelihood of correctly answering item jth when all its attributes have been mastered. Conversely, Pj(0) denotes the probability of answering item jth correctly without having fully mastered all its attributes. c is greater than −1 and less than 1, and it is generally considered acceptable to be greater than or equal to 0, if dj is greater than 0.4, it can be considered that the item discrimination is very good (Tu, 2019; Wu et al., 2020).
Table 3 presents item discrimination indices, which measure how effectively each test question distinguishes between students who have mastered the required skills and those who have not. The results show that 17 of 21 items (81%) demonstrated good to excellent discrimination (dj > 0.4), indicating the assessment’s strong psychometric properties. Notably, Items 1, 7, 9, 19, and 21 showed perfect or near-perfect discrimination, while four items fell below the acceptable threshold and may require revision in future assessments.
Discrimination Indices of the 21-Item Cognitive Diagnostic Test.

Validity
The validity of the test paper under CDM can be demonstrated by the validity of the Q matrix. The method to validate the Q-matrix is linear regression analysis (Dogan & Tatsuoka, 2008). The 21 items were coded as previously described. In order to assess the validity of the Q-matrix, a linear regression analysis was conducted to see if the columns of the Q-matrix can explain item difficulty. An adjusted R2 value of .701 was obtained, indicating that about 71% of the variance in item difficulty levels was due to attribute involvement. The adjusted R2 provided evidence for the validity of the attribute list and the Q-matrix.
Research Analysis and Results
Attribute Mastery Probability
In the GDINA package of the software RStudio, the probability of a student mastering a knowledge state can be obtained from expected a posteriori (EAP) through the function “personparm,” that is, the probability that a student masters a certain attribute, which means the student’s knowledge state.
The study analyzed the responses of rural Chinese students to 21 test items. Figure 1 shows the average mastery probability.

Average mastery probability.
Figure 1 demonstrates that mastery probabilities descend as follows: text comprehension → knowledge and concepts → computing → operation → spatial imagination → mathematical expression. Text comprehension is a central focus in Chinese mathematics education, serving as a prerequisite for problem-solving. Accurate problem resolution necessitates comprehension. Subsequent competencies are knowledge and concepts and computing, both substantially exceeding mathematical expression, spatial imagination, and operation in mastery probability. Mathematical expression and spatial imagination exhibit nearly identical mastery probabilities. This alignment reflects established characteristics of Chinese mathematics education. Assuming rural students comprehend problems (mastering text comprehension), the “double base” constitutes the dominant competency.
Cognitive diagnosis models conventionally employ a 0.5 mastery threshold. Examinees with mastery probabilities below .5 are classified as non-masters. The mean mastery probabilities for mathematical expression, spatial imagination, and operation all fall below .5. Thus, rural Chinese students demonstrate non-mastery of these three attributes, indicating areas requiring improvement. This finding may reflect shortcomings in rural mathematics education, suggesting an overemphasis on the “double base” at the expense of other competencies. Figure 2 displays non-mastery proportions using the 0.5 threshold.

Proportion of students who didn’t master the attributes
Figure 2 indicates that the proportion of students who didn’t master each attribute from high to low is spatial imagination → mathematics expression → operation → computing → knowledge and concepts → text comprehension. This result shows that Chinese rural students’ mastery of these six attributes is not good. Only a minority of students can master these attributes. Students do not have a good grasp of attributes. The mastery of the six attributes varies greatly. More than half of the students have mastered computing, text comparison, knowledge and concepts. However, most students do not master spatial imagination, operation, and mathematical expressions. This result also reflects the emphasis on the “double base” in Chinese mathematics education. Spatial imagination is the weakest among the six attributes. Spatial imagination is a part of space ability, including imagination of object movement and space form (Tuan, 2011). Without developed spatial imagination, students may struggle with geometric content. It can be found that the average mastery probability of the Spatial imagination and mathematics expression are almost same in Figure 1. However, as can be seen from Figure 2, Spatial imagination attribute is the attribute that students master the worst.
The probability of attributes is further divided into four sections, namely, 0–.25, .25–.5, .5–.75, and .75–1. Figure 3 depicts the proportion of the number of students mastering the probability of each sub-dimension attribute.

Mastery probability of six attributes.
Figure 3 reveals significant differentiation in mastery probabilities across sub-dimensions. Most students exhibit mastery probabilities either below .25 or above .75 per dimension. This bimodal distribution indicates students either master attributes proficiently or demonstrate minimal mastery, with limited evidence of transitional states. These findings suggest substantial variability in mathematical competencies among rural Chinese students. Within the ≥.75 probability interval, spatial imagination, mathematics expression and operation probabilities are substantially lower than the other three attributes. Conversely, in the 0 to.25 interval, these three attributes show higher student proportions. Collectively, these results identify operation, mathematical expression, and spatial imagination as critical weakness areas for rural students.
Attribute Patterns
In the GDINA package, the attribute patterns can be obtained through EAP estimation, maximum a posteriori estimation, or maximum likelihood estimation. EAP is the default method of the GDINA package, so attribute patterns were obtained through EAP. The attribute pattern is a vector composed of 1 and 0, where 1 means that the corresponding attribute is mastered, whereas 0 means that the corresponding attribute is not mastered. The attribute model is not only restricted by the learning effect of students, but also restricted by the internal logic of the attribute itself. For example, students must first learn addition before they can learn to solve equations. Then, the attribute patterns are classified according to the number of mastered attributes. Figure 4 shows the results.

Proportion of students who master the different number of attributes.
Figure 4 indicates that the highest proportion of students mastered 3 or 4 attributes, about 26%. Comparable proportions (approximately 5% each) attained 1, 5, or 6 attributes. Approximately 18% mastered 2 attributes. Most students mastered 3 to 4 attributes, with fewer attaining 5 or all attributes. Overall, mastery distribution across attribute patterns approximates a normal distributionyy..sis at the center and lower at the extremes—consistent with fundamental educational characteristics. Nevertheless, significant numbers failed to master all six attributes, indicating mathematics proficiency among rural Chinese students needs improvement. To explore attribute pattern characteristics further, proportions of distinct patterns per mastery level were calculated. Table 4 presents the two most frequent attribute patterns.
Maximum Ratio of Different Attribute Patterns Under Each Mastered Number.

Logically, a certain sequence of grasp exists among different attributes. Students may need to master the previous attribute to master the next one. By analyzing the proportional relationship of different attribute modes in Table 4, we can obtain the order in which students master skills can be obtained. This method has been widely used (see Authors, 2021; Dogan & Tatsuoka, 2008; Wu et al., 2020). In other words, students may master multiple attributes simultaneously, but they cannot grasp all attributes at once.
Table 4 shows that the students with the highest proportion of mastery of the three attributes mainly master Computing, Text Computation, and Knowledge and Concepts. The highest proportion of students who master the four attributes mainly master Computing, Text Computation, Operation, and Knowledge and Concepts. The highest proportion of students who master the five attributes mainly master Computing, Text Computation, Operation, Mathematics Expression, and Knowledge and Concepts. This clearly presents the linear characteristics of students’ knowledge learning. That is to say, students need to first master Computing, Text Computation, and Knowledge and Concepts before mastering Operations, followed by Mathematics Expression, and finally Spatial Imagination. It needs to be explained that among students who master one attribute, the highest proportion mainly master Knowledge and Concepts. However, among students who master two attributes, the attribute patterns with the highest proportion are (0, 0, 1, 0, 0, 1) and (1, 0, 1, 0, 0, 0). These two patterns do not match the attribute pattern with the highest proportion among students who master the three attributes (1, 1, 0, 0, 0, 1). This is because in the mode of mastering two attributes, the proportion of each combination is similar, about 10%. This suggests that after mastering two attributes, students readily progress to three, leading to diverse patterns at the two-attribute level. However, based on existing patterns, it is easy to infer that the two most easily mastered attribute patterns should be (1, 0, 0, 0, 0, 1) or (0, 1, 0, 0, 0, 1), but after mastering these two attributes, it is easy to cross over to mastering three attributes.
Therefore, combined with the specific data mastered by the previous attributes, through the information in Table 4, the learning path can also be inferred. Such as Figure 5.
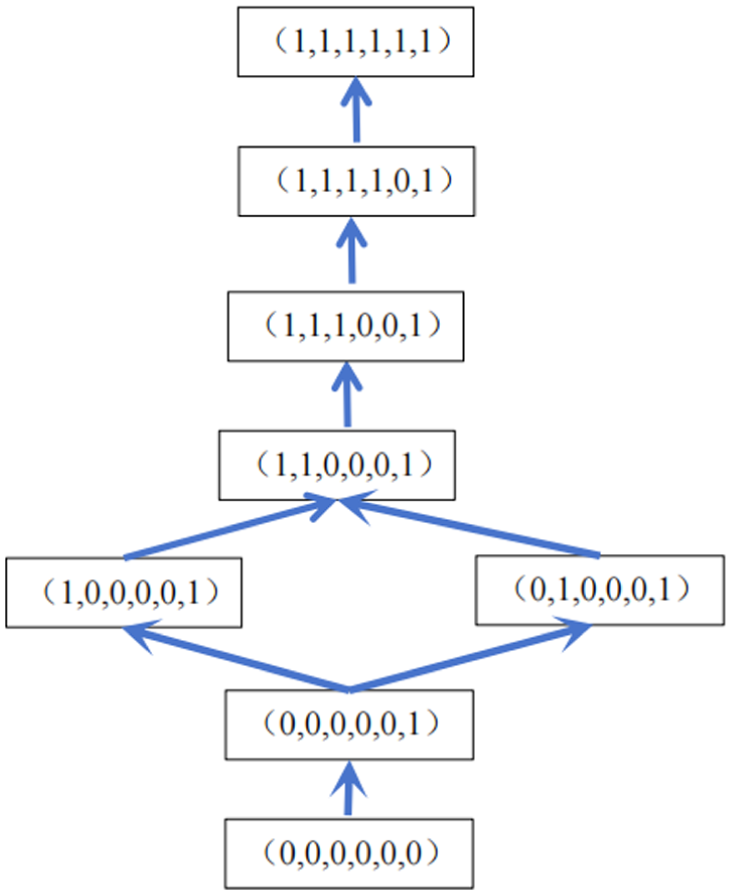
Learning trajectory of six attributes.
From learning trajectories, students start with 0 attribute and then master one attribute. In one master attribute pattern, Knowledge and concepts attribute may master earlier. Next, text comprehension attribute or knowledge and concepts attribute may not have a linear sequence, but a blending process. In the end, when mastering the three attributes, it will be (1, 1, 0, 0, 0, 1). The student then masters the operation and mathematics expression before further mastering the spatial imagination. Specifically, no students had mastered spatial imagination beforehand, so no student exhibited the attribute pattern (0, 0, 0, 0, 1, 0). Spatial imagination is the most difficult attribute for students to master, and gaining experience early is not necessarily a good thing. Spatial imagination is the last attribute to be mastered. This may be related to the curriculum design in China. In Chinese primary school mathematics textbooks, Number and Algebra comprises about 53 units (322 class hours), accounting for 60% of the total curriculum hours; Shapes and Geometry includes only about 30 units (108 class hours), representing 20% of the total (Ministry of Education of the People’s Republic of China [MOE], 2022). This achievement gap may also be attributed to systemic resource disparities. As documented in the Report on the Development of Rural Education in China 2020 to 2022, China’s rural primary schools operated with an average teacher-to-class ratio of merely 1.88:1r-to-cla substantially below the national standard. Such chronic instructional staffing shortages directly constrain personalized instruction, particularly in foundational subjects like mathematics where teacher guidance is paramount
Discussion
This study identified significant polarization in mathematics skill mastery (probabilities predominantly <.25 or >.75) among 246 Chinese rural elementary students, particularly revealing weaknesses in operation, mathematics expression, and spatial imagination. These findings align with the established economic imperative of mathematical proficiency; as Grady et al. (2012) assert, such skills are vital for competing in the global economy. This highlights the socioeconomic implications: students with poor math skills face limited educational pathways—often restricted to vocational high school or work after junior high—resulting in lower lifetime earnings compared to high school or college graduates in China. Crucially, the identified deficit in spatial imagination—the least mastered attribute—resonates strongly with prior research. LHYP and Andersone (2021) confirm that developing spatial imagination is a core objective of geometry learning, while Tai et al. (2014) include spatial understanding as fundamental to mathematical literacy. Furthermore, positions advanced spatial thinking as foundational for cognitive development and educational success, and Carr et al. (2018) demonstrate that well-developed spatial perception in primary school underpins future mathematical achievement. Consequently, strengthening spatial imagination cultivation is critical. The observed relative strength in knowledge/concepts suggests it may offer a viable starting point for intervention.
Previous research utilizing TIMSS 2019 data (Zhu, 2023) analyzed learning trajectories across 17 countries/regions and consistently identified geometry as one of the last two attributes mastered by students. Conversely, competencies in reading, interpreting, and representing information were typically among the earliest acquired. The present study corroborates these international findings, confirming that geometry learning poses a relatively late and challenging hurdle globally. Specifically, for rural Chinese students, spatial imagination emerged as their weakest attribute, exhibiting the lowest mastery probability, which likely contributes to the observed difficulty in learning geometry. Mirroring Zhu’s (2023) findings, countries like Australia, Bahrain, Belgium, and Poland demonstrated that reading, interpreting, and representation (often termed Text Comprehension in this study) are mastered earliest. This attribute was also acquired relatively quickly in other nations. However, a distinct pattern emerged among rural Chinese students in this study: Text Comprehension ranked only as the third attribute mastered. This deviation underscores a distinctive feature of rural education in China and points to areas needing improvement. While students showed strong grasp of concepts and calculations, their ability to comprehend and analyze complex texts or real-world problems appears comparatively weaker.
To translate the identified learning trajectories into actionable solutions, for classroom practice, teachers should integrate low-cost, high-impact activities such as using paper folding (origami) to teach symmetry and geometry, having students mentally rotate and assemble blocks described in word problems, and drawing multi-view sketches of everyday objects. These exercises build foundational spatial skills without requiring advanced technology. Furthermore, our diagnostic model reveals that spatial imagination is the last attribute mastered, indicating that intervention must be sustained. Therefore, policymakers should mandate the integration of these spatial reasoning activities into the existing mathematics curriculum and provide grants for teachers to procure manipulatives. By translating diagnostic data into these practical actions, educators can systematically address the spatial imagination gap identified in this study.
The findings of this study can directly inform and enhance the implementation of China’s rural revitalization strategy and the educational equity goals of the 14th Five-Year Plan. The identified weaknesses in spatial imagination, mathematical expression, and operation highlight specific areas for targeted intervention, enabling a shift from generic support to precision education. To translate these insights into action, we propose three key recommendations. First, in teacher training, programs under initiatives like the “Special Post Plan” should incorporate modules focused on developing spatial reasoning and mathematical language skills, equipping rural teachers with pedagogical strategies to address these specific deficits. Second, regarding curriculum design, our mapped non-linear learning trajectory suggests that national curriculum resources for rural schools should be adapted to provide more scaffolded, hands-on activities in geometry and problem-formulation, aligning with the “Double Base” yet extending beyond it. Finally, for resource allocation, education authorities should leverage diagnostic models like the CDM used here to move from blanket resource distribution to data-driven investment. Allocating specialized teaching aids, digital tools for geometry, and support staff should be prioritized for schools where diagnostic data reveals critical gaps in foundational versus higher-order skills. By aligning our specific findings with these macro-policies, this study provides a actionable roadmap for transforming rural mathematics education from identifying deficits to implementing effective, scalable solutions.
This study has certain implications for researchers interested in mathematics education in China to understand mathematics education in China, especially in rural areas. But some aspects need to be improved. While this study provides valuable insights into the mathematics skill profiles of rural Chinese sixth-grade students using cognitive diagnostic modeling, it is crucial to acknowledge the geographical limitations of the sample. The data were drawn from a single county in Northeast China, encompassing only two randomly selected villages and one county-level school, yielding a total of 246 valid responses. Although the selected county is representative of agricultural economic structures and medium socioeconomic status common in rural China, the narrow geographical scope and modest sample size limit the generalizability of the findings to the broader and highly diverse rural student population across China. Rural education contexts vary significantly due to regional economic disparities, local educational policies, teacher quality, and cultural factors. Therefore, the identified learning trajectories and attribute mastery patterns—particularly the pronounced weaknesses in spatial imagination, mathematical expression, and operation—may not fully capture the heterogeneity of rural mathematics education nationwide. This limitation calls for caution in generalizing the findings to all rural contexts in China. Future research should aim to include larger, multi-regional samples that encompass a wider variety of rural settings (e.g., remote mountainous areas, ethnic minority regions, and suburban villages) to validate and extend the current findings.
Footnotes
Appendix
Q Matrix.
| Items number | COM | TC | OPE | ME | SI | KC |
|---|---|---|---|---|---|---|
| 1 | 1 | 0 | 0 | 1 | 0 | 0 |
| 2 | 1 | 1 | 0 | 0 | 0 | 0 |
| 3 | 1 | 0 | 0 | 0 | 0 | 0 |
| 4 | 1 | 0 | 1 | 1 | 1 | 0 |
| 5 | 1 | 0 | 0 | 0 | 0 | 0 |
| 6 | 1 | 1 | 0 | 0 | 0 | 0 |
| 7 | 1 | 1 | 0 | 0 | 1 | 0 |
| 8 | 1 | 1 | 0 | 0 | 0 | 0 |
| 9 | 1 | 1 | 1 | 0 | 1 | 0 |
| 10 | 1 | 0 | 0 | 0 | 0 | 1 |
| 11 | 0 | 1 | 0 | 0 | 0 | 1 |
| 12 | 0 | 1 | 0 | 0 | 0 | 1 |
| 13 | 0 | 1 | 0 | 0 | 0 | 0 |
| 14 | 0 | 1 | 0 | 0 | 0 | 0 |
| 15 | 0 | 0 | 0 | 0 | 1 | 0 |
| 16 | 1 | 0 | 0 | 0 | 0 | 1 |
| 17 | 1 | 0 | 0 | 0 | 0 | 0 |
| 18 | 1 | 0 | 0 | 0 | 1 | 0 |
| 19 | 0 | 0 | 1 | 0 | 1 | 1 |
| 20 | 0 | 0 | 1 | 0 | 1 | 0 |
| 21 | 1 | 1 | 0 | 1 | 0 | 0 |
Acknowledgements
We would particularly like to acknowledge our teammate member Chengcheng Qu, for her wonderful collaboration and patient support.
Ethical Considerations
No ethical approval was necessary for this work.
Author Contributions
Zhemin Zhu: Conceptualization; Data curation; Funding acquisition; Investigation; Methodology; Project administration; Resources; Supervision; Validation; Writing original draft; Writing review & editing. Bing jia: Conceptualization; Data curation; Formal analysis; Funding acquisition; Investigation; Methodology; Project administration; Resources; Software; Supervision; Validation; Visualization; Writing original draft; Writing review & editing.
Funding
The authors disclosed receipt of the following financial support for the research, authorship, and/or publication of this article: This research was partially supported by the PhD Program at Beihua University: Research on Learning Trajectory Model Based on Bayesian Statistics.
Declaration of Conflicting Interests
The authors declared no potential conflicts of interest with respect to the research, authorship, and/or publication of this article.
Data Availability Statements
The datasets generated during and/or analyzed during the current study are not publicly available due to that the students have not given their permission for researchers to share their data. But are available from the corresponding author on reasonable request.