
Abstract
The free recall measure has an advantage over other memory measures because the free recall measure can provide organization measures, which can reveal the strategies participants used to maximize recall. For instance, even when a study list does not show a clear organizational scheme, recall outputs are often far from random, evidenced by participants recalling the same two or more items together repeatedly across multiple test trials. Unfortunately, computing organizational measures is laborious. The present article introduces a calculator to compute subjective organization (SO) measures. The calculator is based on a popular platform accessible to most researchers and is designed to compute commonly used SO measures for each participant.
Ever since Ebbinghaus (1885/1913) began scientific investigations of human memory, researchers investigated numerous ways of measuring memory. Among these, free recall emerged as one of the dominant memory measures due, in part, to its simplicity. In free recall, participants are asked to recall as much as they can remember and report (orally or by writing down) what they remembered in any order. Although Hintzman (2011) indicated that the heyday of free recall has long since passed (peaked in 1970s), free recall is still called upon whenever one would want to know whether a given neurological disorder, such as Parkinson’s disease, affects cognitive functions (e.g., Brønnick, Alves, Aarsland, Tysnes, & Larsen, 2011). For instance, some standardized tests, such as California Verbal Learning Test–2 (CVLT-2; Delis, Kramer, Kaplan, & Ober, 2000), are based on a combination of free recall, cued recall, and recognition. Furthermore, as of September 16, 2015, a PsychINFO® database (http://www.apa.org/pubs/databases/psycinfo/index.aspx; American Psychological Association) search using free recall as a keyword resulted in 3,329 hits even when the search is limited to publications since year 2000, indicating that free recall continues to be a popular form of memory measure.
An advantage that free recall provides over other measures of memory is that participants are free to use whatever strategies to maximize recall. In fact, the main goal of studying free recall during the 1960s and 1970s was to find out the strategies participants would use to organize their recall outputs. Researchers discovered that participants organize recall outputs in one of two ways: clustering and subjective organization (SO). Clustering occurs when the to-be-remembered (TBR) materials have a clear organizational scheme, such as a list of words that consists of conceptual categories (e.g., animal, fruit, weather, etc.); participants often output items that belong to the same category together (W. A. Bousfield, 1953). SO occurs when TBR materials do not have a clear organizational scheme. Tulving (1962) showed that even when a study list consists of unrelated words, recall outputs are far from random, evidenced by regular co-occurrence of the same two or more items across multiple recall trials. For instance, suppose a participant is presented with a list (e.g., sheep, soldier, idea, coat, brush, sliver), and after memorizing the list (Study Trial 1 or s1), the participant is asked to free recall (Test 1 or t1). The participant then is asked to repeat the procedure (s2, t2). When recall outputs from t1 and t2 are examined, it can be determined whether the same two or more items (e.g., soldier and coat) are recalled together across the test trials. Test trials can be repeated more than twice, but SO measures are computed between two test trials at a time (t1 and t2, t2 and t3, etc.).
Computing organization measures would potentially yield information regarding the nature of memory deficits experienced by patients of neurological disorders. For instance, a Patient Group A may show memory impairment because these patients are suffering from a condition that impairs their abilities to create organization. Unfortunately, these organization measures are not commonly used by researchers because computing these measures is laborious. In fact, there has been a hiatus in research on organization since the late 1970s, even though, according to Hunt (2012), there is “no discernable reason” (p. 5) for this hiatus. We contend that the difficulty of computing organization measures is one of the reasons, even though there have been some efforts in the past to create computer programs to aid researchers and promote these measures (e.g., Kazen & Otani, 1996). However, due to the rapid advancement in computing technology, many of these programs became obsolete.
Nevertheless, there has been a resurgence in researchers’ interests in free recall protocol. For example, Kahana and his colleagues (e.g., Howard, Kahana, & Wingfield, 2006; Kahana, Howard, Zaromb, & Wingfield, 2002) decomposed free recall outputs into the probability of first recall (PFR) and the conditional response probability as a function of lag (lag-CRP). The PFR is the first response participants output when taking a free recall test, and lag-CRP is the responses participants output subsequent to the first response. The results showed that PFR often comes from the recency part of the study list, and the subsequent responses show a lag-recency effect, such that once a response is outputted, the next response is likely to come from nearby serial positions (but see Farrell & Lewandowsky, 2008). Based on this decomposition technique, Kahana et al. (2002) showed that the lag-recency effect is less pronounced among older adults relative to young adults, indicating that the memory difficulties older adults experience are due, in part, to their difficulty in forming associations among items that are temporally proximal. These results indicate that grouping items together is associated with good recall performance, even when a study list does not have an obvious organizational scheme. Accordingly, analyzing recall protocol, beyond the number of correctly recalled items, would greatly enhance the understanding of the nature of memory retrieval.
To promote the use of organizational measures, the goal of the present article is to introduce a simple accessible calculator that enables researchers to compute commonly used organizational measures, as suggested by Murphy and Puff (1982). These measures are A. K. Bousfield and Bousfield’s (1966) difference score of SO for bidirectional pairs (DS′), Pellegrino’s (1971) adjusted ratio of clustering (ARC′) for bidirectional pairs, and Tulving’s (1962) measure of SO for bidirectional pairs (see Table 1 for the formula used to compute these measures, presented by Murphy & Puff, 1982). Note that bidirectional means that two items (e.g., soldier and coat) are considered as one unit regardless of the order in which these items are outputted. We present the calculator in both Microsoft Excel® and LibreOffice Calc spreadsheet versions to maximize the accessibility of this program.
Parameters and Formula Used to Compute SO, DS′, and ARC′.
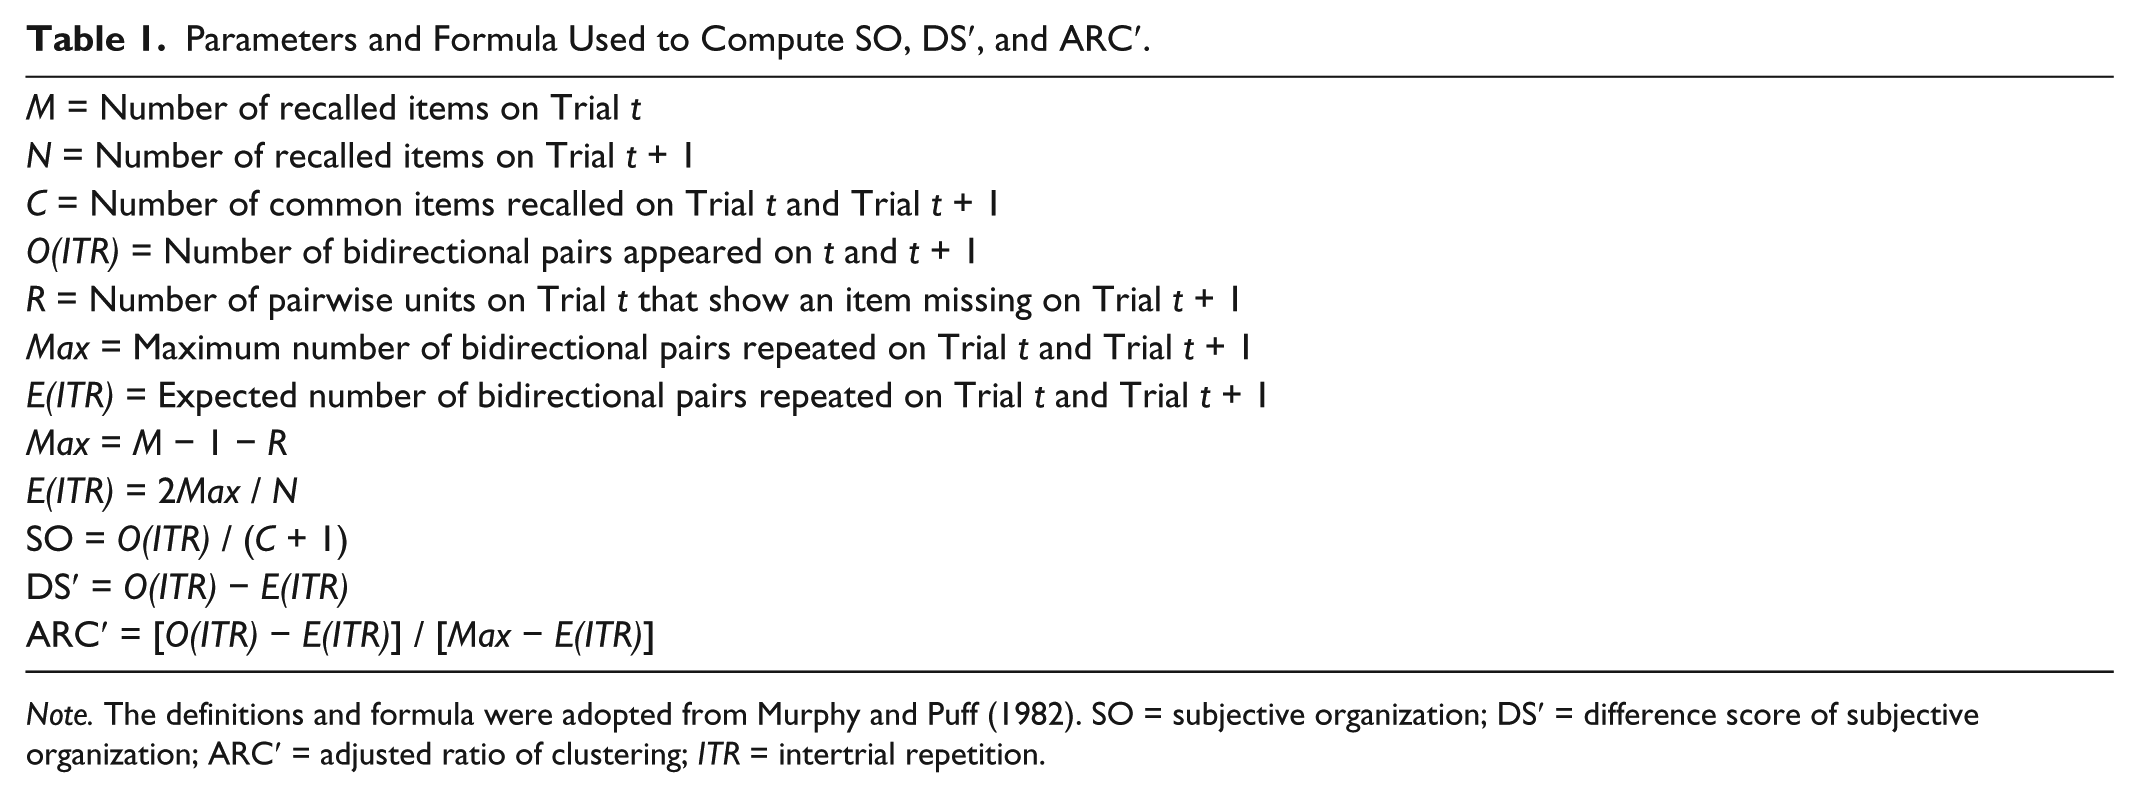
Note. The definitions and formula were adopted from Murphy and Puff (1982). SO = subjective organization; DS′ = difference score of subjective organization; ARC′ = adjusted ratio of clustering; ITR = intertrial repetition.
The difference score of SO for bidirectional pairs (DS′) is defined as a difference between the observed and the expected number of intertrial repetitions (ITR):

where the observed ITR is equal to the number of intertrial repetitions that occur for a given pair of trials, and the expected ITR is equal to the number of intertrial repetitions when items are randomly generated on these trials. The adjusted ratio of clustering (ARC′) is defined by the following equation:

ARC′ ≈ 0 means that the observed ITR is close to its randomly produced value E(ITR), and positive values of ARC′ indicate the above chance level of SO. The SO measure is defined as

where O(ITR) is the number of observed intertrial repetitions (for this measure, it includes repetitions with imaginary items at the beginning and the end of the words list) and C is the number of common items recalled on the Trials t and t + 1. The denominator (C + 1) reflects the maximum number of repetitions one can construct from the C common items. The SO measure ranges from 0 to 1, with 0 indicating the absence of intertrial repetitions and 1 indicating that both t and t + 1 outputs show the same order.
According to Murphy and Puff (1982), computing SO measures based on bidirectionally scored pairwise units for adjacent pairs of recall output (t and t + 1) would yield the optimal outcome. Furthermore, to achieve the optimal outcome, they recommended the use of Tulving’s (1962) SO measure and Pellegrino’s (1971) ARC′.
Based on these recommendations, the SO calculator is designed to compute SO measures for each participant based on two test trials at a time. Furthermore, the calculator is designed to analyze bidirectional pairs, even though it is possible that participants include more than two items in each organizational unit. To use the calculator, a unique number must be assigned to each recalled item on each test (e.g., sheep = 1, soldier = 2, coat = 3, etc.). These numbers can be arbitrary; however, the easiest way is to use the serial order of the study list. Then, these items are inputted in the columns B and C (for the first and second test trials correspondingly) of the calculator in the exact output order. Note that the calculator does not handle repeats (e.g., sheep,
Mock Data Sets Used to Verify the Accuracy.
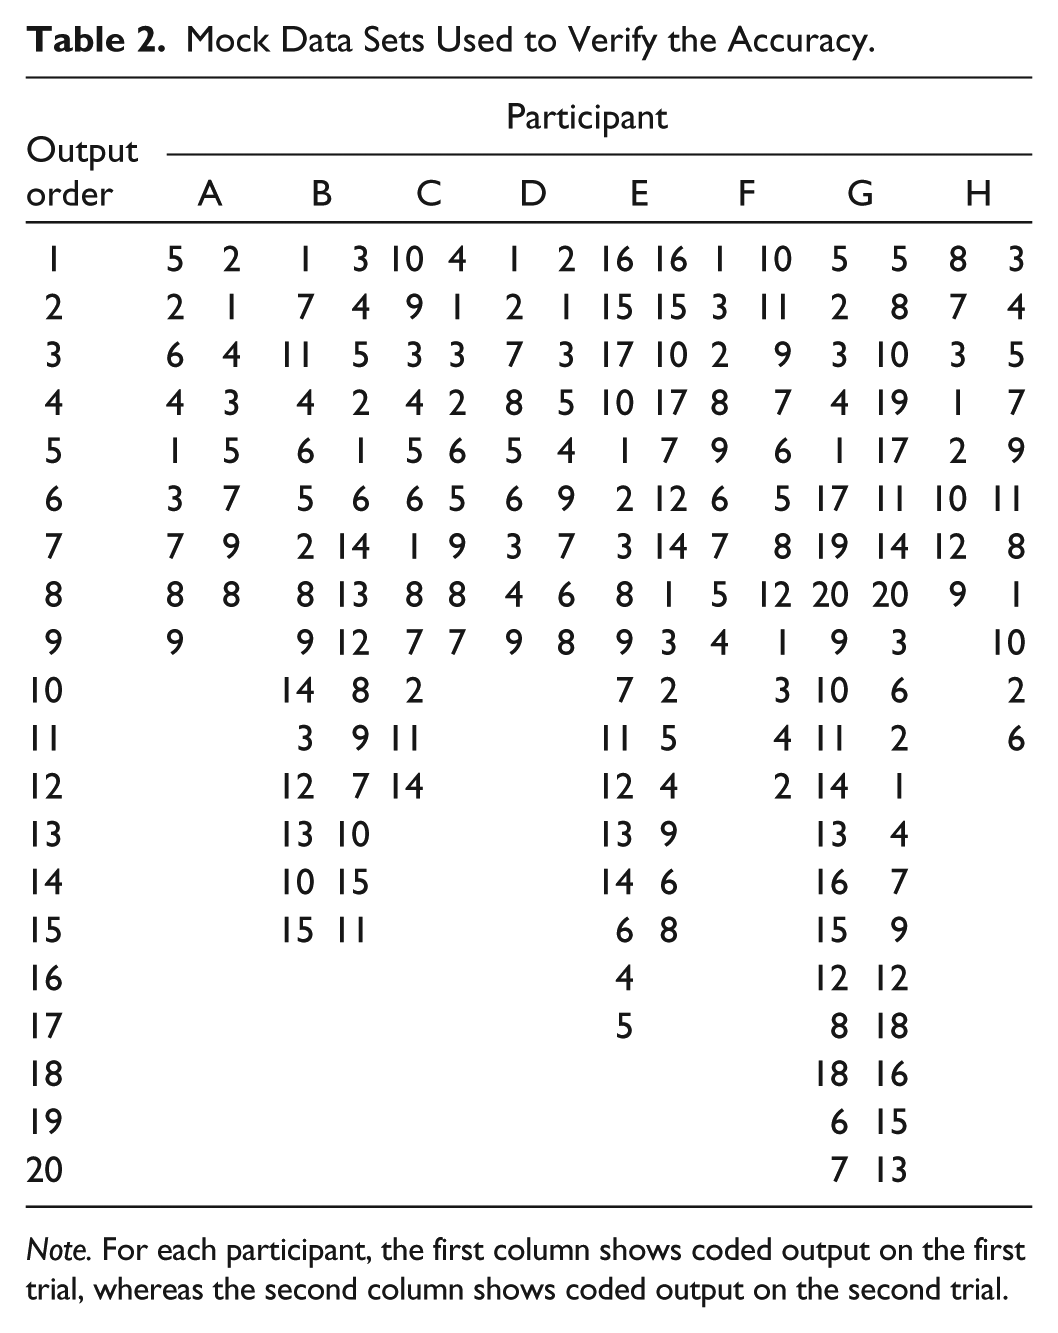
Note. For each participant, the first column shows coded output on the first trial, whereas the second column shows coded output on the second trial.
Measures Computed Based on Mock Data Sets.

Note. ITR = intertrial repetition; SO = subjective organization; DS′ = difference score of subjective organization; ARC′ = adjusted ratio of clustering.
Footnotes
Appendix
Declaration of Conflicting Interests
The author(s) declared no potential conflicts of interest with respect to the research, authorship, and/or publication of this article.
Funding
The author(s) received no financial support for the research and/or authorship of this article.