
Abstract
Rural–urban disparity in economic and social development in Ghana has led to disparities in educational resources and variations in students’ achievement in different parts of the country. Nonetheless, senior high schools (SHSs) in rural and urban schools follow the same curriculum, and their students write the same West Africa Senior Secondary Certificate Examination (WASSCE), which qualifies them to access higher education in Ghana’s public universities. Urban SHSs are also recognized nationwide as good schools where students make it to university. Moreover, performance patterns with regard to admission of SHS graduates into university also vary between rural and urban schools; consequently, some parents do everything to get their children in urban SHSs, even consenting to placement in visual arts, a program deemed appropriate only for academically weak students. This study therefore adopted the qualitative-quantitative research approach with interview, observation, and questionnaire administration to investigate the critical factors that affect academic performance of SHS students, particularly those in visual arts as case study. Findings from six public SHSs in Kumasi—two each in rural, peri-urban, and urban areas—revealed that urban schools perform better than rural and peri-urban schools because they attract and admit junior high school graduates with excellent Basic Education Certificate Examination (BECE) grades, have better infrastructure, more qualified teachers, prestigious names, and character that motivate their students to do well. This suggests that bridging the rural–urban gap in educational resources could promote quality teaching and learning, and thereby raise academic achievement for SHS students in Ghana.
Introduction
Education is one of the most powerful instruments known for reducing poverty and inequality and for laying the basis for sustained economic growth. It raises the productivity and efficiency of individuals and produces skilled manpower that is capable of leading economic development. Education is a process through which the intellectual, moral capacities, proper conduct, and technical competency of individuals are developed to make them cultural members of their societies (Tuan, 2009, as cited in Dorleku, 2013). Teaching and learning form the central part of education and provide essential learning tools and the basic learning content required by human beings to survive, to develop their full capacities, live and work in dignity, participate fully in development, improve the quality of their lives, to make informed decisions and to continue learning (United Nations Educational, Scientific and Cultural Organization [UNESCO], 2000 as cited in Siaw, 2009). Learning is the medium through which the attainment of individuals and the nation’s educational goals can be achieved (Aremu & Sokan, 2003). Teaching output is therefore measured largely by student learning and academic achievement (Ankomah, 2002).
Teaching is the main way of promoting learning and achievement among students but teaching and learning are what affect knowledge, skills, attitudes, and the capacity of young people to contribute to contemporary societies (Mangal, 2007). Although the school may have other peripheral objectives, the major goal of the school is to work toward attainment of academic excellence by students (Adeyemo, 2001, as cited in Babatunde & Olanrewaju, 2014) mainly because virtually everyone concerned with education places premium on academic achievement. Excellent academic achievement of children is often the expectation of parents (Osiki, 2001, as cited in Babatunde & Olanrewaju, 2014). Academic failure is not only frustrating to students and their parents; its effects are equally grave on the society in terms of dearth of manpower in all spheres of the economy and politics (Aremu & Oluwole, 2000, as cited in Babatunde & Olanrewaju, 2014).
Concept of Academic Performance
In educational institutions, success is measured by academic performance, or how well students deal with their studies; how they cope with or accomplish different tasks given to them by their teacher, and the extent to which a student, teacher, or institution has achieved their educational goals (Ankomah, 2002). As an outcome of education, academic performance refers to the capacity to achieve when one is tested on what one has been taught (Otoo, 2007), which relates to curriculum content, the learner’s intellect, and hence depends on the learner’s competence. Also referred to as academic achievement or scholastic functioning (Babatunde & Olanrewaju, 2014), academic performance of students, especially at the secondary school level, is not only a pointer to the effectiveness or otherwise of schools but a major determinant of the future of youths in particular and nations in general (Aremu & Sokan, 2003, as cited in Osei-Mensah, 2012).
Performance in school is evaluated in a number of ways, including examinations as a factor of quality education (Adams, 2000, as cited in Yeboah, 2014). Academic performance is measured in terms of examination marks, the grading of which concerns the ability of individuals to use the knowledge and skills acquired. For regular grading, students demonstrate their knowledge by taking written and oral tests, performing presentations, turning in homework, and participating in class activities and discussions. Performance results are shown in the form of letter or number grades and side notes that describe how well a student has done, which also allows students to be ranked and sorted on a scale that is numerically obvious, and also as a means of holding teachers and schools accountable for the components of each and every grade (Bell, 2012). Students are also evaluated by their performance on standardized tests geared toward specific ages and based on a set of achievement objectives that students in each group are expected to meet. In the past, academic performance was often measured more by year than today, and teachers’ observations made up the bulk of the assessment; today’s summation or numerical method of determining how well a student is performing is a fairly recent invention (Bell, 2012).
Factors That Affect Academic Performance
Academic performance is affected by several factors. The attitude of some teachers to their job, which reflects in their poor attendance to lessons, lateness to school, passing of unsavory comments about students’ performance that could damage their ego and poor methods of teaching directly affect students’ academic performance (Adesemowo, 2005). To Mzokwana (2008), conditions that hinder students’ learning and affect their performance include cultural background, psychological problems, curriculum changes, and allocation of subjects to teachers without considering their areas of specialization. Alton-Lee (2001, as cited in Dorleku, 2013) also adds school climate, curriculum change, teaching methods, availability of teaching aids, assessment methods, learners’ discipline, school culture, overcrowding in classes, motivation, and students’ background as factors that require attention to ensure academic success among learners.
School culture or climate is the heart and soul of the school and the essence of the school that draws teachers and students to love the school and to want to be a part of it (Weber, 2000, as cited in Dorleku, 2013). The type of school a learner attends is a factor that has profound influence on the learner’s academic achievement. School culture affects teaching effectiveness. In this sense, Wheeler and Richey (2005) posit that schools that create learning environments that are safe and supportive for both learners and teachers ensure high teaching and learning outcomes. Collegial schools establish learning goals for their students and cultivate a positive culture that enables students to achieve academically (Ankomah, 2002; Fleischman & Osher, 2005).
According to Gray, Griffin, and Nasta (2005), students come to school with unique sets of characteristics that include cultural backgrounds that may assist or impede academic performance. Academic success of students also depends on language (Rickford & Wolfram, 2009). Students experience higher failure rates in school if the language they learn at school is different from the one spoken at home. The problem is compounded if the students do not speak one language or do not understand the medium of instruction. Language and communication styles can therefore hamper student achievement in school.
Gray et al. (2005) also assert that strategies and methods of teaching have a great influence on student achievement. The theory of multiple intelligences and concept of learning styles (Gardner, 1999, as cited in Agbenatoe, 2011) make it clear that learners vary in the way they acquire new information or skill. Thus, no single strategy or teaching method can satisfy all learners’ needs (Downes, 2010). Consequently, Armstrong (2009) recommends that teachers endeavor to identify the intelligence strengths of their students so that they can teach to reinforce the students’ specific strengths of intelligence and learning styles when teaching new materials to meet their students’ learning needs, which can lead to higher student achievement. As learning has more to do with one’s ability to organize and use ideas and skills to address a problem, teachers ought to teach what students need to know, understand, and be able to do. Nonetheless, teaching will be in vain if students are not actively involved in the learning experience (Singh & Rana, 2004).
Classrooms are particular kinds of environments. They have distinctive features that influence their inhabitants no matter how the students or the desks are organized or what the teacher believes about education. Furthermore, classrooms are multidimensional, they are crowded with people, tasks, and time pressures; they have people with differing goals, preferences, and abilities, inhabitants must share resources, and actions can have multiple effects and influence student participation (Doyle, 2006, as cited in Mucherah & Frazier, 2013). The social context created within the classroom, the ways in which communication occurs, teachers’ and students’ roles, and how opportunities for collaboration are structured influence students’ understanding and construction of knowledge, and hence affect learning and achievement (Hammond, Austin, Orcutt, & Rosso, 2001, as cited in Dorleku, 2013).
Class size is an important factor with respect to academic performance of students. There is consensus among researchers and educational scholars that students’ achievement decreases as class size increases (Babatunde & Olanrewaju, 2014). Similarly, overcrowding (Morrow, 2007) in a classroom makes it complicated for teachers to manage each individual’s attention and also make use of various teaching and assessment methods. Where a teacher is limited by space and is unable to provide individual attention and supervision, students who are unattended to tend to disturb the class and distract the attention of other students during lessons (Squires, 2002). As Jolivette, Scott, and Nelson (2000) posit, the level of distractibility within the classroom, the density of class size, and social interaction with specific students or staff are potential barriers to high performance.
Students’ background is another factor that influences their performance (Weber, 2000, as cited in Dorleku, 2013). Students from different backgrounds and cultures bring differing prior knowledge and resources to learning. The background of a student is a major contributing factor to the teaching-learning process and also serves as a springboard for further education (Adedeji & Owoeye, 2002). To help students who are not learning requires teachers to ensure that instruction is not inappropriate to the students’ learning styles (Hampton, 2009, as cited in Dorleku, 2013). It is critical therefore that academic performance is investigated so that the negative factors that affect academic achievement could be mitigated to enable all students to have equal opportunity to do well in school.
Rural–Urban Disparities
There is no universally accepted definition for a rural area because different countries have different perceptions of what “rural” means (Adedeji & Olaniyan, 2011). Kashaa (2012) simply describes rural areas as deprived, lacking so many government developmental interventions such as potable water, electricity, good roads, and school infrastructure to improve upon the lives of the people. Rural cultures can exist in urban areas but differences exist between rural areas and urban centers because large rural towns that are not far from urban centers often have more in common with the urban area than they do with remote and isolated small towns. Poverty in Sub-Saharan Africa is concentrated in rural areas where 75% of the poor reside. Although rural areas can provide family-oriented settings, lower crime rates, fresh air, and an enhanced quality of life, many teachers refuse rural postings due to concerns about the quality of housing, classroom facilities, healthcare, school resources, and opportunities for professional development (Acheampong & Lewin as cited in Mulkeen, 2005; Armah, 2013; Hedges, 2000) and language barriers (Coultas & Lewin, 2002).
Ghana’s efforts at raising the living standards of Ghanaians and ensuring economic growth have, however, left a legacy of extreme disparities in development in terms of the demographic and settlement patterns, distribution of social infrastructure and levels of economic activity. This has resulted in substantial differences between urban and rural settings with regard to the distribution and quality of educational facilities and manpower, just as levels of utilization of resources and access to tertiary education also differ slightly between urban and rural schools (UNICEF, 1990, as cited in Siaw, 2009). Increased rural–urban migration has also brought millions of people living in rural areas to the urban centers. Variations in teacher–student ratios, human resource capacity, provision of educational infrastructure, and other facilities have also led to rural, urban, and regional differences in educational opportunities in different parts of Ghana (Atuahene & Owusu-Ansah, 2013; Banson, 2010; Osei-Mensah, 2012; Owusu-Afriyie, 2009; The President’s Committee on Review of Education Reforms in Ghana, 2002; Siaw, 2009).
Rural schools in Ghana lack good infrastructure and facilities, they have low enrollment, less qualified teachers, and fewer textbooks, and other teaching and learning materials, whereas urban schools are generally overstaffed with qualified teachers, are overenrolled, better funded, and monitored, have better infrastructure and adequate resources to work with (Anamuah-Mensah, 2002; The President’s Committee on Review of Education Reforms in Ghana, 2002; Siaw, 2009). The achievement gap between urban and rural schools is a pressing problem today because past approaches at closing this gap have been largely urban biased in character (UNICEF, 1990, as cited in Siaw, 2009).
Rural–Urban Disparity in Tertiary Education
Performance patterns with regard to admission of SHS graduates into tertiary institutions in Ghana differ between urban and rural schools and also skewed toward the traditionally élite schools located in urban centers (Kwame Nkrumah University of Science and Technology Planning Unit, 2009). Available data and various research studies show that students from deprived school districts and in particular rural areas have limited access to quality education (Assié-Lumumba, 2008; Leach & Mitchell, 2006; Mama, 2003; Morley et al., 2009; Morley et al., 2010; UNESCO-UIS, 2009, 2011, as cited in Atuahene & Owusu-Ansah, 2013). Oakes and Guiton (1995) believe that some urban schools provide high-quality education and produce high-achieving students, which make them the preferred choice for potential students.
Performance in the West Africa Senior Secondary Certificate Examination (WASSCE), which qualifies SHS graduates to access higher education in Ghana, depends on the geographical location or region of the high school, academic program offered, and the quality of teachers in the school (Atuahene & Owusu-Ansah, 2013). Thus, students who have opportunity to attend one of the top-ranked secondary schools which are staffed with quality teachers and have comparatively better educational facilities tend to perform better than their peers who attend mediocre SHSs that are predominantly located in rural areas in historically disadvantaged regions of the country, which have substandard academic infrastructure or facilities.
Geographical location and technical factors such as determination of programs, timetabling, teacher availability, and subject availability also shape decisions that students make in the selection of secondary school subjects (Page, 2007). Such decision making is also influenced by the location of the community the student lives in. The selection of areas of study in high school is thus shaped by the decision maker’s concept of the school or subject with respect to their geographical areas of location. Manuh, Sulley, and Budu (2007) also found location and quality of SHS attended as a measure of one’s performance and an indicator of one’s participation in higher education in Ghana.
Regardless of these differentials, schools in all parts of Ghana are governed by the same policy regulations designed by the Ministry of Education and implemented by the Ghana Education Service ( GES); teaching and learning are guided by a centralized curriculum, a prescribed teaching syllabus for the specified subjects in the curriculum, and the use of same textbooks. Irrespective of a school’s location in Ghana, final-year students in all urban and rural SHSs write the same final external WASSCE that qualifies them for further education in polytechnics, colleges, and universities (Asihene, 2009; Osei-Mensah, 2012; Owusu-Afriyie, 2009).
The reality of the rural–urban disparity, however, is that some parents find it difficult to accept placement of their children in schools located in rural communities and do everything to get them into the well-endowed, “famous,” or prestigious schools located in urban centers where they believe that their wards would make it to the university (Asihene, 2009). All things being equal, all SHS students in Ghana should have equal opportunity to do well in school and also access higher education. However, academic performance of students in Ghana’s secondary schools appears to be at variance with this view. The perception that urban schools can guarantee better WASSCE results and access to tertiary education than schools in rural settings is a significant factor that directly affects students’ choice of programs and educational opportunities.
The problem is exacerbated by placement of students in the visual arts program, which is perceived as a “not so serious subject” that is fit only for low performance students and those who are not intelligent enough to study science, business, and other subjects that involve abstract thinking (Adinyira, 2012; Asihene, 2009). The rural–urban differences in levels of educational resources, quality of teachers and students, students’ entry grades, geographical location, prestige of school, character of the community in which a school is located, and other environmental factors seem to have some influence on student learning and performance in the WASSCE, and achievement of educational goals (Agbenatoe, 2011; Asihene, 2009; Owusu-Afriyie, 2009).
In spite of challenges with social and economic development, Ghana recognizes secondary education as the most accessible form of higher education with greater potential for sustaining higher levels of literacy, increasing political awareness, strengthening democracy, and producing middle-level manpower for national development (Quist, 2003, as cited in Yeboah, 2014). Creating the necessary conditions that will enable citizens in all parts of the country to develop to their highest potential to aid national development requires bridging the achievement gap between rural and urban schools. This study is very necessary as it examines the factors that contribute to rural–urban differentials in student performance in SHSs in general, and Visual Art education in particular, as it has the ability to directly translate secondary education into a consistent economic return (Rihani, 2006).
Method
To verify the perceptions, assumptions, and personal experiences of the apparent rural–urban disparity in student academic achievement in Ghana, the study employed a combination of qualitative and quantitative research designs with interview, observation, and questionnaire administration “to get an overall understanding of the phenomenon being researched” (Leedy & Ormrod, 2005, p. 133), which are the relevant factors that significantly affect teaching, learning, and academic performance of students in different geographic settings in Ghana, using the Senior High School Visual Arts program as a case study.
The study was conducted in metropolitan Kumasi, the capital of Ashanti Region, which offers a diverse range of urban, peri-urban, and rural settings and schools of varying size, levels of facilities and educational resources. Using the GES Approved Classification of Schools in Ashanti Region (June 2008) as a guide, six of the 18 public SHSs that offer visual arts in the Kumasi metropolis were randomly selected: Two schools each were selected to represent communities classified on the GES list as rural, peri-urban, and urban, using the purposive sampling technique for in-depth study. The study was limited to the visual arts program, and therefore excluded teachers and students in the science, business, general arts, home economics, and the other SHS elective programs of study. The study respondents comprised both male and female students so single sex schools were excluded from the sample.
Field data to verify the existence of any disparities in teaching, learning, and student achievement in SHSs located in rural, peri-urban, and urban communities in Ghana were gathered via observation, interview, and questionnaire administration. Data collection from the three settings lasted 6 weeks. The schools sampled for the study are identified only as Schools A, B, C, D, E, and F; Schools A and B represent the urban cluster of schools, Schools C and D represent the peri-urban cluster, and Schools E and F represent the rural cluster.
From the population of 710 visual arts students (School A = 105; School B = 200; School C = 162; School D = 80; School E = 88; School F = 75) and 20 visual arts teachers, data were collected from a simple random sample of 120 students (66 males; 54 females) and 18 teachers (16 males; 2 females) across the 6 schools. Each participating school contributed a stratified sample of 20 SHS 1 to 3 students and three teachers in each setting. Of the 120 students, 64.3% were aged 15 to 18 years and 34.7% were aged 19 years or more. The teachers and students answered a 50-item self-administered questionnaire that had a return rate of 96.4%. Data source focused on sociodemographic characteristics, access to logistic support, motivation and attitude toward lessons. Informal interviews and direct observation of classroom and art studio activities conducted over 12 weeks provided additional data for filtering data obtained from questionnaire responses. In all, 30 visits of 20- to 45-min observation per visit in each school were adopted to obtain a holistic view of teaching and learning processes across the six schools.
Combining different methods to gather data from different sources (Hesse-Biber & Leavy, 2010; Leedy & Ormrod, 2005) enabled a comprehensive description of the factors that affect academic performance of students in SHSs located in rural, peri-urban, and urban environments.
Discussion of Findings
Art education in a way helps students respond to culture, psychology, sociology, philosophy, anthropology, and religion of the society as portrayed in artifacts. Art education serves as a foundation for advanced training and provides opportunity for students to acquire skills in apprenticeship. The SHS program is meant to foster and promote creativity through a variety of art activities using the relevant tools and materials to acquire the relevant knowledge, skills, and aesthetic experiences necessary for the youth of Ghana to appreciate their environment, to equip themselves with trades and vocations, otherwise set up their own businesses to contribute their quota as responsible citizens to promote socioeconomic development (Ministry of Education, 2008; UNESCO, 2001).
Components of the Visual Arts Program
The following sections provide a summary of the respective subjects studied by visual arts students in Ghana’s SHSs. As specified in the Teaching Syllabus (Ministry of Education, 2008, 2010, 2013), each student is required to study any two of eight elective subjects in addition to General Knowledge in Art (GKA), which is the core subject and therefore studied by all students on the visual arts program.
GKA
GKA provides broad-based information on the history of art, creativity, and appreciation, the basic elements and principles of art, skills in their application to various practical art processes. GKA is a composite subject that was teased out from all the visual arts subjects studied at the SHS level to provide the students with broad-based knowledge and skills in the theory and practice of art. The theory aspect is meant to widen the students’ scope of art vocabulary with the requisite communication skills that would enable them to talk knowledgeably on the subject. The practical component serves to reinforce through planned repetition, what is learned in the individual subject areas of the visual arts program with emphasis on the acquisition of knowledge, skills, competences, and attitudes in visual arts for individual and national development.
Textiles
The textiles syllabus is structured and geared toward the diversification of the local industry to generate more jobs and alleviate poverty. Among other things, the subject focuses on providing students with knowledge of the behavior or characteristics of fibers, yarns, and fabrics when in use; fabric designing, construction, decoration, and finishing processes; career opportunities and entrepreneurial practice in textiles.
Graphic design
Graphic design focuses on effective visual communication. It involves equipping students with skills in drawing, painting, illustration, block, and solid screen printing, engraving, etching, lithography, among others, to convey messages to the public.
Picture Making
Picture Making focuses on drawing, painting, printing, collage, mosaic, appliqué, pyrography, and photography. It equips students with skills in drawing, composition, organization, and other skills needed by students of visual and industrial arts.
Sculpture
Sculpture focuses on skills in creating aesthetically pleasing two- and three-dimensional objects either by carving, modeling, casting or construction and assemblage, using materials such as stone, metal, clay, and wood.
Ceramics
Ceramics focuses on acquisition of skills in the use of clay for the design and production of pottery, bricks, tiles, and other ceramic wares. The syllabus includes identification, preparation, and use of indigenous and contemporary materials, tools, and equipment for ceramics.
Leatherwork
The syllabus deals with the processing of hides and skins of animals into leather, and skills in using relevant tools and techniques in the design and production of leather articles for different uses. It equips students with skills in designing, cutting, assembling, coloring, and finishing of leather.
Basketry
The syllabus deals with the making of containers by plaiting, weaving, coiling of pliable natural and synthetic fibers and materials using awls, pliers, and sharp knives or scissors, needles and scissors.
Entry Basic Education Certificate Examination (BECE) Grades of Students in Sampled Schools
For objective assessment of possible variations in the achievement strengths of student respondents in rural, peri-urban, and urban schools, and analysis of factors that influence academic achievement in the three settings, the entry BECE grades of students in the six schools were compared and discussed. BECE is externally organized and graded by the West Africa Examinations Council (WAEC), which classifies candidates who obtain BECE Aggregate 6 to 12 as “distinction” or “good” students, Aggregate 13 to 24 achievers as “average,” and Aggregate 25 and above achievers as “weak” students (Asihene, 2009; Dorleku, 2013; Hayford, 2007). Table 1 shows the WAEC grading system for BECE and WASSCE (previously Senior Secondary School Certificate Examination, SSSCE). Table 2 also shows the sampled students’ entry BECE grades.
WAEC Grading System for Examinations.
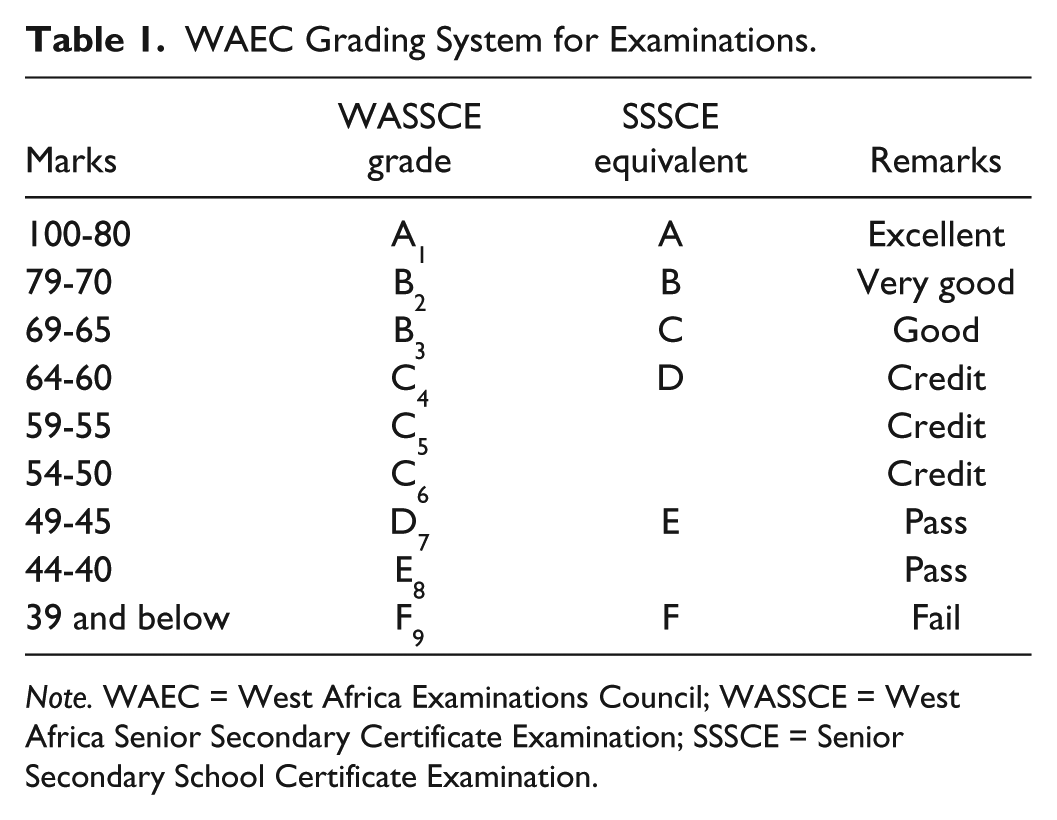
Note. WAEC = West Africa Examinations Council; WASSCE = West Africa Senior Secondary Certificate Examination; SSSCE = Senior Secondary School Certificate Examination.
BECE Results for 2002 for the Three Locations.

Note. BECE = Basic Education Certificate Examination.
It can be seen from Table 2 that of the 107 students admitted into the urban schools in 2002, 72 (or 67.3%) had aggregate 6 to 12 (distinction) with no student in the peri-urban school obtaining a distinction. In the rural schools, five students had “distinction” and as many as 51 of the 83 students admitted had BECE aggregate 13 to 24 as against 31 in the urban setting. It is also seen that the rural schools recorded the highest average (13-24) grades, whereas the peri-urban schools recorded the highest weak grades. Only four students had BECE aggregate 25+ in the urban schools, considering that admission cutoff points are 6 to 10 for science; 6 to 15 for visual arts in Grade A schools; 8 to 15 and 10 to 25 in Grade B schools; and 8 to 15 and 10 to 30 in Grade C schools, respectively. The BECE grades seem to reflect the students’ graduating WASSCE results for the various visual arts subjects across the three settings as seen in Tables 3 to 6.
SSSCE/WASSCE GKA Results for 2004.

Note. SSSCE = Senior Secondary School Certificate Examination; WASSCE = West Africa Senior Secondary Certificate Examination; GKA = General Knowledge in Art.
SSSCE/WASSCE Picture Making Results for 2004.

Note. SSSCE = Senior Secondary School Certificate Examination; WASSCE = West Africa Senior Secondary Certificate Examination.
SSSCE/WASSCE Graphic Design Results for 2004.
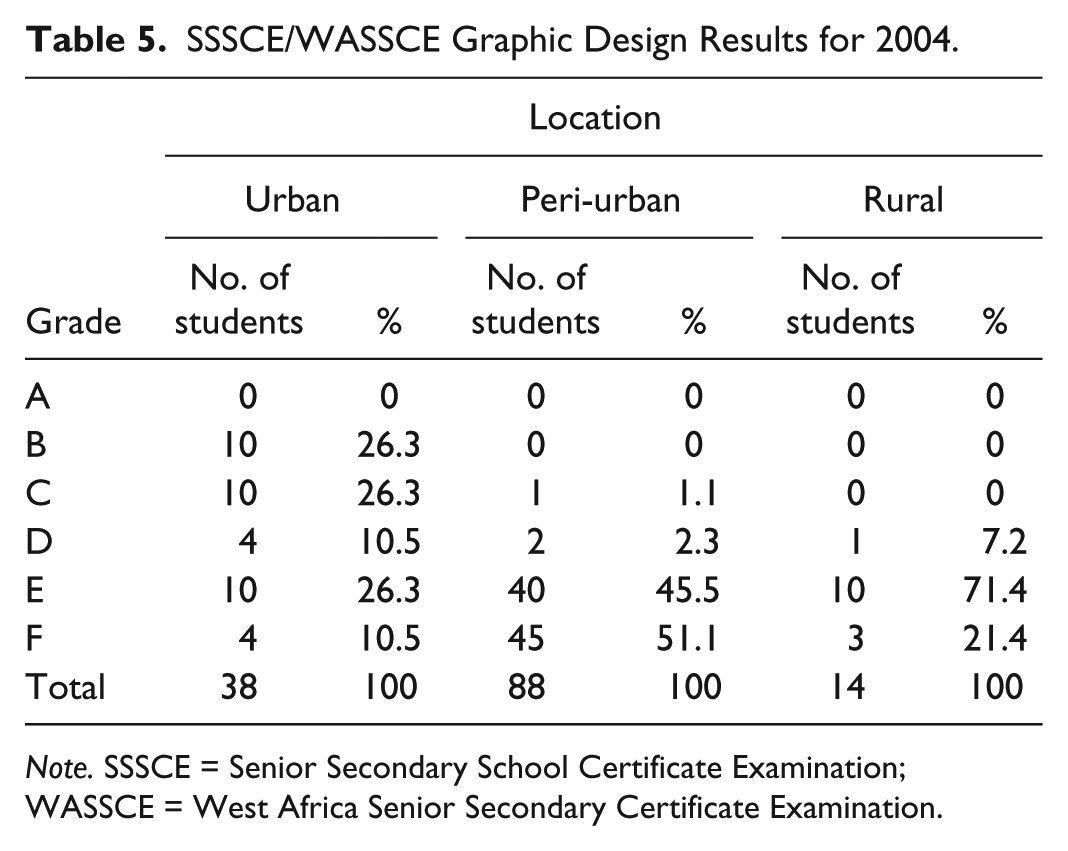
Note. SSSCE = Senior Secondary School Certificate Examination; WASSCE = West Africa Senior Secondary Certificate Examination.
SSSCE/WASSCE Textiles Results for 2004.
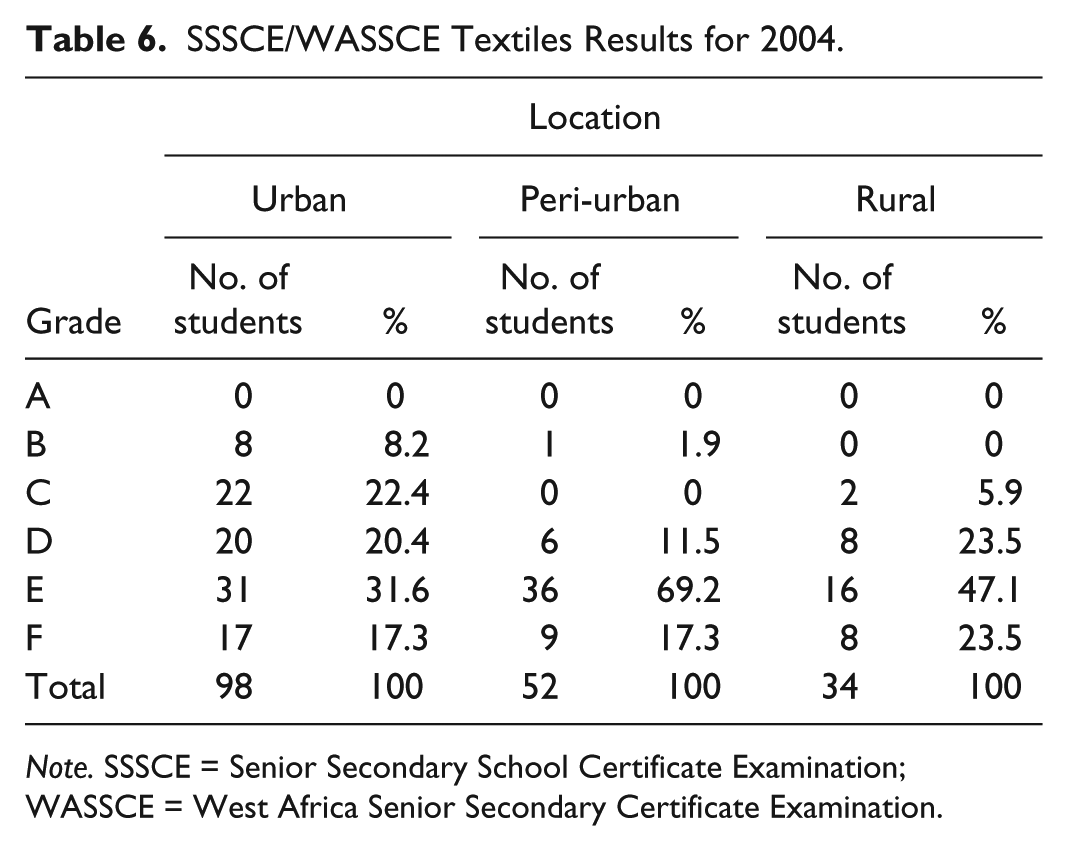
Note. SSSCE = Senior Secondary School Certificate Examination; WASSCE = West Africa Senior Secondary Certificate Examination.
It must be emphasized that BECE applicants who entered SHS in 2002 graduated in 2004. From the WASSCE results for 2004, 45 (10%) of the total urban student population of 429 scored Grade “A” and as many as 222 (51.7%) made Grades B and C; only 22 (5.1%) students failed in the urban schools. The majority of the rural and peri-urban students scored Grade E: 162 (60.9%) and 61(46.5%) out of the total population of 266 and 131 students in the respective areas, while the peri-urban setting recorded the highest failures of 79 (29.7%) of the total number presented as shown in Tables 3 to 6.
The 2003 results shown in Table 7 are not much different from the 2002 WASSCE results. The urban schools did not admit any student with Grade 25 or above but took 13 (31.0%) average performance students out of the 42 students they admitted. They also recorded the highest number (69.0%) of “good” students. However, the peri-urban schools admitted more of the average (40 or 67.8%) students and 18 (or 30.5%) of those with Grade 25 and above. The rural schools recorded the second highest intake of “average” and “weak” students with 38 (60.3%) and 17 (27.0%), respectively.
BECE Results for 2003 for the Three Locations.

Note. BECE = Basic Education Certificate Examination.
The BECE candidates for 2003 entered the SHS in 2003 and completed in 2005. From Tables 8 to 11, the output for 2005 shows that 43 (10%) of the total urban student population of 414 failed WASSCE, while 110 (26.6%) and 120 (29%), respectively, had Grades C and E; only 20 (4%) scored Grade “A” in the urban setting. The majority of students in the rural setting scored Grades B, C, and D, while 37 (24.3%), 46 (30.2%), and 40 (26.3%) students, respectively, failed out of a population of 152. In the peri-urban schools, most of the students (106 or 35.8%; 123 or 41.6%), respectively, out of the total of 296 students scored Grades D and E.
SSSCE/WASSCE GKA Results for 2005.

Note. SSSCE = Senior Secondary School Certificate Examination; WASSCE = West Africa Senior Secondary Certificate Examination; GKA = General Knowledge in Art.
SSSCE/WASSCE Graphic Design Results for 2005.

Note. SSSCE = Senior Secondary School Certificate Examination; WASSCE = West Africa Senior Secondary Certificate Examination.
SSSCE/WASSCE Picture Making Results for 2005.

Note. SSSCE = Senior Secondary School Certificate Examination; WASSCE = West Africa Senior Secondary Certificate Examination.
SSSCE/WASSCE Textiles Results for 2005.

Note. SSSCE = Senior Secondary School Certificate Examination; WASSCE = West Africa Senior Secondary Certificate Examination.
In 2004, the overall rural schools’ intake reduced from 83 in 2002 to 65 in 2004 while the peri-urban population increased from 56 to 161. This was based on lowered Grade 6 to 12 entry (ratio of 72:49) in 2004 for urban schools and increased Grade 13 to 24 in the peri-urban setting. The rural schools had most of their students entering with Grade 25 or above, indicating academically weak students.
The BECE candidates for 2004 shown in Table 12 entered the SHS in 2004 and completed in 2006. As indicated by their WASSCE output for 2006 (seeTables 13 to16) 17 (3.9%) students out of the total urban student population of 431 scored Grade “A,” and as many as 189 (43.9%) had Grades B and C; only 8 (1.9%) students failed in the urban schools. Majority of the rural and peri-urban students scored Grade E with 71 (51.4%) and 182 (43.0%), respectively, out of the total of 138 and 423; the peri-urban setting recorded the highest failures with 80 (18.9%) out of the total population of students.
BECE Results for 2004 for the Three Locations.

Note. BECE = Basic Education Certificate Examination.
SSSCE/WASSCE GKA Results for 2006.

Note. SSSCE = Senior Secondary School Certificate Examination; WASSCE = West Africa Senior Secondary Certificate Examination; GKA = General Knowledge in Art.
SSSCE/WASSCE Graphic Design Results for 2006.

Note. SSSCE = Senior Secondary School Certificate Examination; WASSCE = West Africa Senior Secondary Certificate Examination.
SSSCE/WASSCE Picture Making Results for 2006.

Note. SSSCE = Senior Secondary School Certificate Examination; WASSCE = West Africa Senior Secondary Certificate Examination.
SSSCE/WASSCE Textiles Results for 2006.

Note. SSSCE = Senior Secondary School Certificate Examination; WASSCE = West Africa Senior Secondary Certificate Examination.
The 2005 BECE results shown in Table 17 bring out the variance between the three locations more clearly. The urban setting had almost all their students getting good or excellent grades; a minority of 10 (8.1%) and the majority of 111 (71.6%) students in the peri-urban and the rural schools made average grades.
BECE Results for 2005 for the Three Locations.

Note. BECE = Basic Education Certificate Examination.
The 2005 BECE candidates entered SHS in 2005 and completed in 2007. Their WASSCE output for 2007 as seen from Tables 18 to 21 shows that 7 (2.4%) out of the total urban student population of 294 scored Grade “A” and as many as 121 (77.2%) scored Grades B and C; only 9 (3.1%) students failed in the urban setting. Majority of the rural and peri-urban students scored Grade E (80 or 48.2%; 136 or 34.3%), respectively, out of the total of 166 and 396 students; the peri-urban setting recorded the highest failures with 37 (9.3%) out of their total number of 396 students as shown in Tables 18 to 21.
SSSCE/WASSCE GKA Results for 2007.

Note. SSSCE = Senior Secondary School Certificate Examination; WASSCE = West Africa Senior Secondary Certificate Examination; GKA = General Knowledge in Art.
SSSCE/WASSCE Picture Making Results for 2007.

Note. SSSCE = Senior Secondary School Certificate Examination; WASSCE = West Africa Senior Secondary Certificate Examination.
SSSCE/WASSCE Graphic Design Results for 2007.

Note. SSSCE = Senior Secondary School Certificate Examination; WASSCE = West Africa Senior Secondary Certificate Examination.
SSSCE/WASSCE Textiles Results for 2007.

Note. SSSCE = Senior Secondary School Certificate Examination; WASSCE = West Africa Senior Secondary Certificate Examination.
Table 22 shows that in 2006, no records were obtained for students in the rural schools. Of the 59 students who were admitted into the peri-urban schools, only one (1.7%) had distinction in BECE; the urban schools did not admit any student with aggregate 25+. While the urban schools admitted 87 distinction students, the peri-urban setting admitted as many as 41 average performance and 17 weak students out of their total intake of 59.
BECE Results for 2004 for the Three Locations.

Note. BECE = Basic Education Certificate Examination.
The BECE candidates for 2006 entered SHS in 2006 and completed in 2008. As shown in Tables 23 to 26, the comparative analysis of their output for 2005 shows 36 (8.7%) out of the total urban student population of 416 scoring Grade “A” and as many as 174 (41.8%) scoring Grades B and C; only 11 (2.6%) students failed in the urban schools. On the contrary, majority of the rural and peri-urban students scored Grade E with 42 (47.7%) and 110 (31.9%), respectively, out their respective total intake of 88 and 345. This year as many as 21 of the peri-urban students scored Grade “A” with only eight (2.3%) of them failing.
SSSCE/WASSCE GKA Results for 2008.

Note. SSSCE = Senior Secondary School Certificate Examination; WASSCE = West Africa Senior Secondary Certificate Examination; GKA = General Knowledge in Art.
SSSCE/WASSCE Picture Making Results for 2008.

Note. SSSCE = Senior Secondary School Certificate Examination; WASSCE = West Africa Senior Secondary Certificate Examination.
SSSCE/WASSCE Graphic Design Results for 2008.
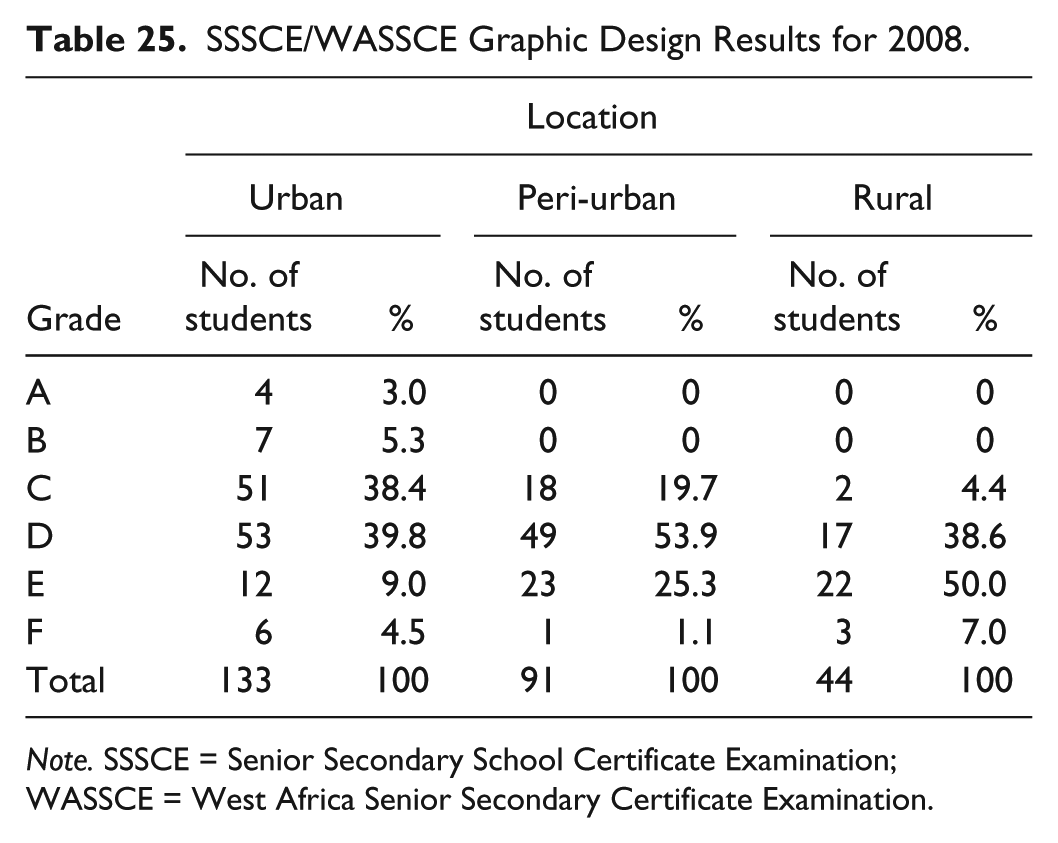
Note. SSSCE = Senior Secondary School Certificate Examination; WASSCE = West Africa Senior Secondary Certificate Examination.
SSSCE/WASSCE Textiles Results for 2008.
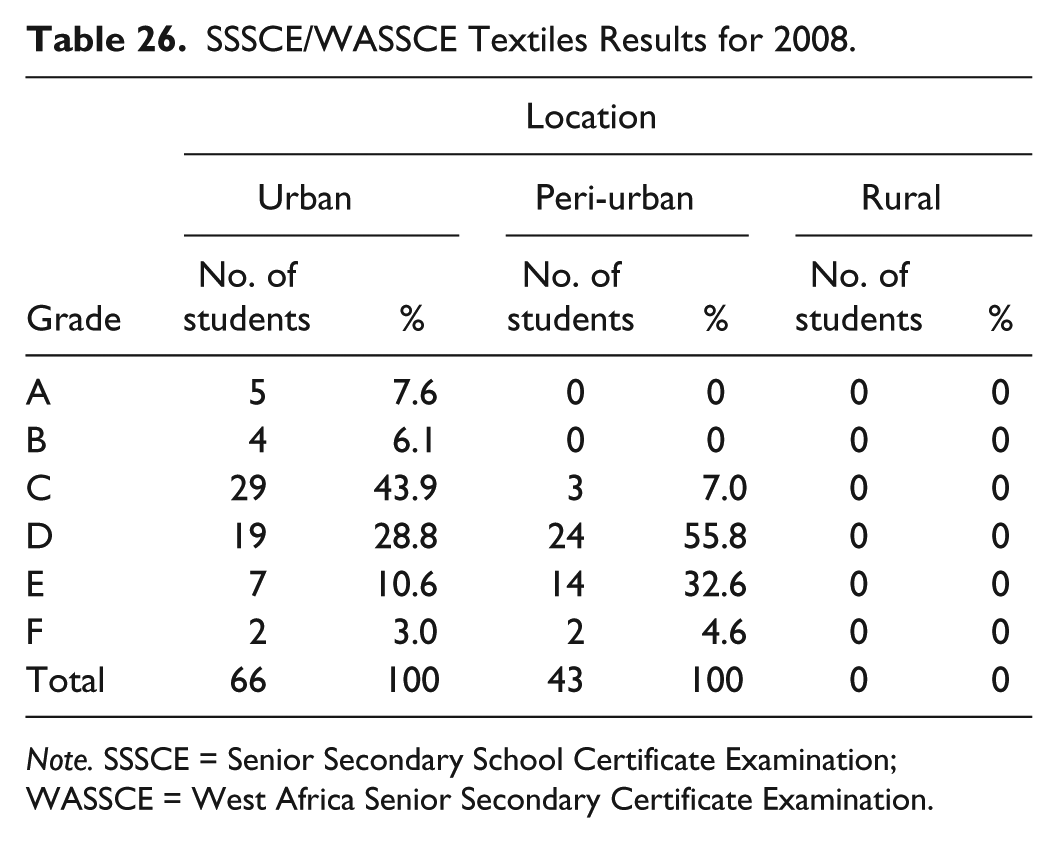
Note. SSSCE = Senior Secondary School Certificate Examination; WASSCE = West Africa Senior Secondary Certificate Examination.
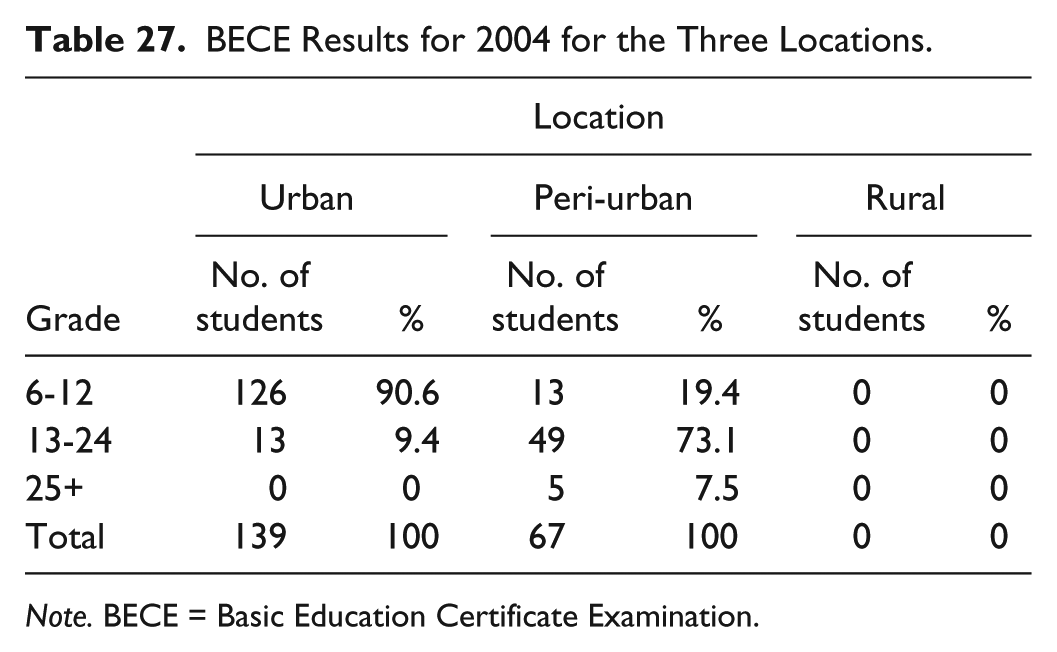
No records were obtained for students in the rural schools in 2007, as shown in Table 27. It is seen here that the 139 students admitted into the urban schools in 2007 included no “weak”’ student. Besides the 13 (9.4%) “average” students, the large majority (90.6%) of those admitted were “distinction” or BECE aggregate 6 to 12 students. However, 49 or 73.1% of the 67 students who went to the peri-urban schools were “average” students. This confirms that the majority of BECE high achievers go to the urban schools whereas average and weak performers go to the rural and peri-urban schools, which confirms the existence of a rural–urban disparity in educational resources which causes differentials in student achievement at both BECE and WASSCE in different parts of Ghana. Inequitable distribution of educational resources among schools in different parts of the country is therefore denying rural and peri-urban schools the opportunity to enhance the academic potentials of students in their respective environments.
BECE Results for 2004 for the Three Locations.
Note. BECE = Basic Education Certificate Examination.
As Asihene (2009) indicates, the pattern of admission of junior high school (JHS) graduates into SHSs based on the aggregated range of marks that included BECE candidates’ continuous assessment in the various subjects of the JHS curriculum changed with the introduction of the Computerized School Selection and Placement System (CSSPS) in 2004. In place of the aggregated scores that the WAEC used to grade BECE, the CSSPS method used the raw scores a candidate obtains in each of their six best subjects to calculate BECE results. Not unusually, the admission of students into urban schools depends on the applicants scoring a total of 400 marks in the best six subjects, while those with 300 and 200 marks find themselves in the peri-urban and rural schools, respectively (Adinyira, 2012; Siaw, 2009). This shows that BECE grades of JHS graduates accepted for admission into the SHSs vary in relation to location of schools on the premise that the urban schools set high admission cutoff grades that only high performance BECE applicants can attain. The urban schools therefore tend to have students who perform better at WASSCE than the average and low performance applicants who get admitted into peri-urban and rural schools, which also tend to receive the large majority of weak BECE applicants overall.
Conclusion and Recommendations
Although only a small sample of 120 visual arts students spread across six schools that represent SHSs in rural, peri-urban, and urban settings in the Kumasi metropolis in Ashanti Region was studied, the findings attest to obvious differences existing between academic performance of students in the SHSs in general but particularly among students on the visual arts program. It is clear that the BECE grades presented for admission by the various JHS graduates to the rural, peri-urban, and urban schools vary in relation to the schools’ locations. The urban schools receive the best BECE applicants just as Oakes & Guiton, 1995, as cited in Siaw (2009) asserts, which makes it easy for their WASSCE output to be better than those who enter the peri-urban and rural schools with weak BECE grades and may not receive the motivation that the urban schools provide for their peers. Unequal levels of resources and background learning experiences could further widen the achievement gap between students in urban, peri-urban, and rural locations.
As Aremu and Sokan (2003) posit, academic performance of students, especially at the secondary school level, is not only a pointer to the effectiveness or otherwise of schools but a major determinant of the future of youths in particular and the country in general. According to Adedeji and Owoeye (2002), the background of a student serves as a springboard for further education, which in this case hampers the rural and peri-urban students’ access to higher education. Unfortunately, not all JHS students in Ghana have opportunity to learn any visual arts subject which could leverage their chances to understand enough of the program to do well for lack of specialist teachers (Agyenim-Boateng, 2011; Evans-Solomon & Opoku-Asare, 2011). Besides, as Hampton (2009, as cited in Dorleku, 2013) posits, students who are not learning must have teachers who have knowledge about learning styles to ensure that instruction is appropriate to address ineffective learning and low performance among the weak students.
Consenting to admit applicants with weak BECE grades suggests willingness of teachers and administrators to work hard to push their students to do well, at least for the school to earn a good name so that they can also attract high performance JHS graduates like the urban schools. Academic excellence by students is the major goal for schools to work toward getting good teachers and the requisite resources that can help attainment of academic excellence (Adeyemo as cited in Babatunde & Olanrewaju, 2014) because virtually everyone concerned with education expects their children to excel in school to warrant continued parental support and investment. As the data in Tables 2 to 27 indicate, some peri-urban schools and occasionally a few rural schools get to admit some brilliant BECE applicants but as Asihene (2009) indicates, those are often JHS graduates who live in those peri-urban and rural communities and have little opportunity to attend urban schools. Minimal shifts in the academic strength of average standard or weak students could motivate others to attend rural and peri-urban schools so that they can also achieve their educational goals.
As Asihene (2009) reports, the system of distributing JHS graduates across the public SHSs in Ghana has changed since 2005 with the implementation of the CSSPS, which is a strategic means of ensuring equitable distribution of JHS graduates in the public SHSs in all parts of the country. It is also intended to bridge the educational achievement gap between rural and urban schools (Asihene, 2009). However, as Evans-Solomon and Opoku-Asare (2011) and Adinyira (2012) found in the Central and Ashanti regions, respectively, some urban school heads take advantage of their goodwill to “offload” or compel some applicants into visual arts on the basis of making weak BECE grades, which reinforces the perception that visual arts is suitable only for low achievers. Disdain for visual arts is enough for brilliant students to choose other programs, which also overcomes the aim of equitable distribution of BECE holders across public schools in the country, ostensibly to bridge achievement gap in rural and urban Ghana (Asihene, 2009).
Categorizing SHSs and elective programs of study offered in SHSs only presses prejudice into the minds of students who must specialize in specific disciplines as adolescents without providing adequate resources for them to excel in those areas and subjects that they choose to pursue. This engenders discrimination in the choice of higher education opportunities. Placing a ceiling on BECE grades accepted for entry into SHS to match the categorization of public schools as first, second, and third class (also Grades A, B, and C) schools that also reflect the rural, peri-urban, and urban disparity in development only emphasizes and widens the rural–urban gap. The fact is that disparities exist in the BECE grades of applicants for admission into SHSs that are also spread in rural, peri-urban, and urban settings and have varying levels of educational resources in the different environments or locations. This encourages migration of adults from rural areas to urban areas so their children would attend good schools and make it to university.
That the urban schools receive the cream of BECE applicants and encourage them to add value to their efforts to achieve a higher output than their peers who attend peri-urban and rural schools is obvious. Having the large majority of weak students attending rural and peri-urban schools also limits the opportunity for well-motivated high achievers in JHSs to impact positively on their peers. We strongly believe that bridging the rural–urban gap with equitable supplies of educational infrastructure and facilities, implementing housing and other incentive packages to motivate teachers who accept rural postings, and effectively monitoring teaching and learning activities in all schools in Ghana could promote high academic achievement in BECE and WASSCE for JHS and SHS students in the rural, peri-urban, and urban environments and give equal educational opportunities for all students in Ghana.
Footnotes
Declaration of Conflicting Interests
The author(s) declared no potential conflicts of interest with respect to the research, authorship, and/or publication of this article.
Funding
The author(s) received no financial support for the research and/or authorship of this article.