
Abstract
The regression equation needed to predict the self-esteem score from the Sixteen Personality Factor Questionnaire (16PF) Fifth Edition is not available for hand scoring. This score is derived from the Coopersmith’s Self-Esteem Inventory (SEI), which is based on a unitary model of self-esteem. The SEI may be subject to gender and extroversion biases. Moreover, there is a gap in the literature on the 16PF fifth edition and self-esteem. For these reasons, we investigated the relationship of the Culture-Free Self-Esteem Inventory–II Form AD (CFSEI-II), a multidimensional model of self-esteem, using multiple regression to the scales of the 16PF. Based on the adult sample of 234 in this study, we developed and made available to users of the 16PF split sample–validated regression equations for this multidimensional model of self-esteem.
Keywords
The Sixteen Personality Factor Questionnaire Fifth Edition (16PF), released in 1994 (Institute for Personality and Ability Testing [IPAT], 2009), is the latest edition of the personality test, which was devised to measure normal personality functions (Cattell, Eber, & Tatsuoka, 1970). Since its origin, developers have revised the 16PF 5 times, updating content, norms, and/or to make other improvements, all of which added to its overall psychometric qualities (IPAT, 2009). There are also validity scales, such as impression management. Reviewers have consistently rated the 16PF one of the most used and researched personality tests (Dancer & Woods, 2006; Walsh & Betz, 1995). This ubiquity may be traced to its empirical roots, multitiered trait structure (including Big Five personality traits) of normal-range personality, and availability in more than 30 languages (Cattell & Schuerger, 2003).
The 16PF was originally constructed by factor analyzing descriptions of personality based on English-language adjectives (Cattell et al., 1970; IPAT, 2009). The factor analysis yielded 16 primary factors (see Table 1). One of these factors, Reasoning (B), is a proxy for measuring cognitive or reasoning ability. All items and associated traits are assumed to exist on continua and thus are conceptually bipolar. For example, descriptors for the primary factor Warmth (A) range from “reserved” to “attentive to others.” This underlying structure (i.e., each trait and its associated items existing along a continuum) assumes a dominance response process. In a dominance process, a person responds to an item relative to how similar or dissimilar they perceive themselves to be in relationship to the item (Stark, Chernyshenko, Drasgow, & Williams, 2006). These 16 primary factors are considered primary personality traits (Cattell & Schuerger, 2003). Primary personality traits contribute to five second-order or, more commonly, global traits (see Table 1). Thus, the scales of the 16PF, 16 primary and 5 global, reflect an underlying multitiered conceptualization of personality. Furthermore, Cattell theorized third-order factors, as well, and only recently has reliable evidence of a two-factor solution been established (Cattell & Mead, 2008).
Means and Standard Deviations for 16PF Fifth Edition and Culture-Free Self-Esteem Inventory–II.

Note. 16PF = Sixteen Personality Factor Questionnaire Fifth Edition.
Values rounded to single decimal place. The 16PF scores are reported in Sten scores. A Sten has a mean of 5.5 and a standard deviation of 2.0. The Culture-Free Self-Esteem Inventory–II Form AD (CFSEI) is reported using T scores.
The 16PF Fifth Edition may be administered via paper and pencil or computer. A number of computer-generated reports can be derived from the scale scores, including the Personal Career Development Profile (Clark & Blackwell, 2007). Historically, the 16PF has been a popular personality measure because of the multiple special scores that can be calculated from combinations of various factor scores.
One special score that can be calculated from the 16PF Fifth Edition is a measurement of unitary self-esteem. Using a regression equation, combinations of 16PF Fifth Edition factor scores are entered to predict a measure of self-esteem based on the Coopersmith’s Self-Esteem Inventory (SEI; Coopersmith, 1981). Currently, the regression equation necessary to predict the SEI score from the 16PF is not available for hand scoring. According to sources at the Institute for Personality and Ability Testing (IPAT), there is no intention of making this formula available apart from their computer scored reports (S. Conn & Institute for Personality and Ability Testing Staff, personal communication, August 24, 1994). The formula used to calculate this computer-generated special score was derived using a cross-validated multiple regression procedure described by Rieke and Conn (1994). The regression equation that resulted from their work provided a r of .72 using the five global factors and an r of .76 for the primary factors. Rieke and Conn (1994), citing Kawash, Clews, and Keating (1989), chose a unitary model of self-esteem, an important choice as we were interested in multidimensional constructs of self-esteem.
Researchers continue to debate whether self-esteem is a unitary or multidimensional construct. Many professionals conceptualize self-esteem as multifaceted (Battle, 1992; Luhtanen & Crocker, 1992; Rosenberg, Schooler, Schoenbach, & Rosenberg, 1995). Battle’s (1992) multidimensional model includes dimensions of self-esteem based on (a) overall perceptions of self-worth, (b) perceptions of relationship quality, and (c) evaluation of intimate sense of self-worth. Thus, evaluations of self-worth refer to perceptions of worthiness as a person in comparison with others. The intimate sense of self-worth dimension refers to the evaluation of self-worth independent of others’ evaluations of it. In addition, Rosenberg et al. (1995) found a stronger correlation of global self-esteem to psychological well-being than with a specific or unitary conceptualization, further indicating that a multidimensional model of self-esteem might hold more utility than a unitary conceptualization. Intimate evaluation of self-worth might have a stronger relationship to the perception of mental health and for the expectation of positive treatment outcomes than a sense of social self-esteem or more general sense of self-worth (Battle, 1992).
There are several reasons for examining how the 16PF Fifth Edition relates to multidimensional models of self-esteem. Today’s mental health environment, Health Maintenance Organizations (HMOs), and insurance companies provide less time and money for counselors to use multiple assessment tools. Clinicians must use assessment tools efficiently and economically. If valid special scores for a multidimensional model of self-esteem for the 16PF Fifth Edition can be developed, its use would be enhanced, increasing efficiency in the data-gathering process.
To date, there has been limited research using the current edition of the 16PF Fifth Edition with unitary models of self-esteem, a difference between the fifth edition and earlier versions (Rieke & Conn, 1994). Rieke and Conn examined the relationship between the 16PF Fifth Edition and a unitary model of self-esteem. In a sample of 318 largely non-White subjects (56%), higher scores were found on the global factors of IN (Independence) and EX (Extroversion) with a lower score on AX (Anxiety) being correlated to higher self-esteem. Correlations at p < .05 for global factors were AX (Anxiety) = −.64, IN (Independence) = .49, EX (Extroversion) = .45, and SC (Self-Control) = .26. The primary factors associated with higher self-esteem on the current edition included correlations on A (Warmth) = .34, C (Emotional Stability) = .64, H (Social Boldness) = .54, and negative correlations on N (Privateness) = −.20 and Q1 (Openness to Change) = .28, along with lower scores on O (Apprehension) = .58, and M (Abstractness) = .44. These results, however, warrant caution. The model of self-esteem upon which the Coopersmith’s SEI is built has shown biases in gender (Chapman & Mullis, 2002) and extroversion (Francis, 1997).
In addition to the limited research on unitary models of self-esteem and the recent edition of the 16PF, a search of ERIC and PsychInfo found no other studies examining the relationship between the 16PF Fifth Edition and other models of self-esteem. Thus, an extension of the research examining the relationship of the 16PF Fifth Edition to multiple dimensions of self-esteem is appropriate. The primary purpose of this study was to examine the relationship of the 16PF Fifth Edition to the four dimensions of self-esteem measured by the Culture-Free Self-Esteem Inventory–II Form AD (CFSEI-II) with an adult sample using multiple regression. A secondary purpose of the study was to begin developing split sample–validated regression equations for this multidimensional model of self-esteem and make them available to users of the 16PF Fifth Edition. In doing so, users would have a choice of self-esteem models.
Method
Participants
The sample used in this study consisted of 234 volunteers’ responses. Of these, 109 (47%) were from the Southern Indiana, Southern Illinois, or Northern Kentucky area, 58 (24%) were from the Northeastern Ohio or Northwestern Pennsylvania area, and 67 (29%) were from Southern Florida. Participants’ age ranged from 18 years to 69 years. The mean age was 27.9 years (SD = 10). Two participants included in this study did not report their age.
The participants were largely female (71%; n = 165; males; 29%; n = 69). The primary researcher solicited participants through minority organizations in the community and various class levels at multiple university locations. These procedures resulted in the reported racial heritage of the sample participants consisting of 82% (n = 193) White non-Hispanics, 9% (n = 20) African Americans, 2% (n = 5) Asian Americans, 6% (n = 15) Hispanics, and 0.4% (n = 1) Native American. Participants reported educational levels ranging from an 11th-grade education to doctorates. The mean educational level was 14.9 years (2 years of college) with a standard deviation of 2.4 years. One person did not report his or her educational level.
There were 59% (n = 138) undergraduate and graduate students and 41% (n = 96) community members (not enrolled in classes) in the sample. A diverse sample of university participants was solicited from undergraduate programs in art, music, accounting, business management, counseling, elementary education, secondary education, and special education. The counseling participants were graduate students. No remuneration or other incentive was provided to the participants.
Materials
16PF
The 16PF Fifth Edition is an empirically derived personality test devised to measure normal personality functions. It was originally constructed by factor analyzing English-language adjectives used to describe personality (Cattell, 1989; Cattell et al., 1970; IPAT, 2009). The fifth edition was revised using modern psychometric procedures and norm collecting procedures to update language and improve the psychometric qualities of the tool. The 16PF contains 16 bipolar scales and several validity scales. Fifteen of the scales measure personality traits and one scale measures cognitive or reasoning abilities (see earlier discussion). The stability coefficients for the personality and validity scales range from r = .69 to r = .86 for a 2-week period with a range of r = .56 to r = .79 for a 2-month period. The internal consistency of the personality and validity scales ranged from r = .66 to r = .87 (Rieke & Conn, 1994).
In addition to the 16 primary factors, 5 global factors can be obtained. The global factors are calculated from multiple regression equations developed from second-order factor analyses of the primary factors (Cattell et al., 1970; Rieke & Conn, 1994). While no internal consistency indices can be calculated for the global factors, the stability of these scales ranges from r = .84 to r = .91 over a 2-week period, and r = .70 to r = .82 over a 2-month period (Rieke & Conn, 1994).
CFSEI-II
The CFSEI-II is a widely used multidimensional measure of self-esteem. James Battle’s theory of self-esteem (Battle, 1992) guided the instrument’s development. Administration time is between 10 and 15 min. The adult form of the CFSEI-II has 40 items. Respondents’ yes or no item choices fall into either a high or low self-esteem group. Items form three scales measuring aspects of self-esteem (General Self-Esteem, Social Self-Esteem, and Personal Self-Esteem) and a scale to detect “faking good.” The three self-esteem scale scores can also be summed to obtain a global measure of self-esteem (Battle, 1992). The General Self-Esteem score serves as a measure of an adult’s “overall perceptions of worth” (p. 3). The Social Self-Esteem score is an assessment of that “aspect of self-esteem that refers to individuals’ perceptions of the quality of their relationships with peers” (p. 3). The Personal Self-Esteem score was designed to measure “the aspect of self-esteem that refers to individuals’ most intimate perceptions of self-worth” (p. 4). Summing these scores yields a cumulative, or more global, measure of overall self-esteem.
The stability of the CFSEI-II scale scores was reported as r = .56 for the Social score, r = .78 for the Personal score, r = .82 for the General score, and r = .82 for the Total score over a 4-week period (Battle, 1977b). Research regarding the validity of the CFSEI-II has been supportive. There is evidence of concurrent validity with the Coopersmith’s’ SEI, with correlations of .71 to .80 (Battle, 1992). A number of studies have examined the validity of the CFSEI-II scores as correlates of depression (Brooke, 1995). For example, the Beck Depression Inventory (overall: −.55; male: −.53, females: −.56; Battle, 1978). Other validity research has included content analysis, factor analysis, and the relationship of CFSEI-II scores to external criteria, including its relationship to teachers’ ratings and the Minnesota Multiphasic Personality Inventory (Battle, 1977a). There is inadequate support for the claim, however, that the CFSEI-II is culture free (Brooke, 1995).
Procedure
The primary author collected the data for this study as part of a group of studies on the 16PF Fifth Edition. Sample size was preestablished with a minimum of 170 participants. The sample of this size allows for 10 or more cases per variable when calculating multiple regressions, and is the ratio experts recommend (Hair, Babin, & Anderson, 2009; Janda, 1998; Nunnally & Bernstein, 1994).
The administration packets included the 16PF, CFSEI-II, demographics sheet, and other instruments placed in an envelope in counterbalanced order. Before opening the administration envelope, each participant read or heard a description of this study. The researchers or research assistants distributed 260 packets. Sixty percent of the participants completed the materials in a group setting and the other 40% did so at home. Participants returned the packets to one of the researchers or a research assistant. Of this number, participants returned 253 packets. The returned packets resulted in 234 usable 16PF Fifth Edition and CFSEI-II survey instruments that were included in this study for analysis. There was a 90% return rate.
The materials were hand scored separately and checked for accuracy twice, sometimes thrice, by different members of the research team. To estimate the degree of scoring error, researchers randomly selected 10 protocols and rescored them by hand. No errors were found in these 10 protocols.
Data Analysis
Statistical analyses were performed using SYSTAT 9.0 for Windows (SPSS, 2007). First, an analysis of the correlations between the 16PF Fifth Edition and CFSEI-II was conducted (see Table 2). Next, a forward stepwise multiple regression procedure with a .15 entry and .15 removal level was utilized, paralleling methods in previous research on the 16PF (Rieke & Conn, 1994). Unlike the cross-validation method utilized by Rieke and Conn (1994), we utilized split sample validation to validate the regression models. Our purpose was to examine the relationship of the 16PF Fifth Edition to a measure of multidimensional model of self-esteem and not to directly compare the results of this study with those of Rieke and Conn. Therefore, we did not rigidly follow their analytic protocol.
Correlation Between16PF Fifth Edition and Culture-Free Self-Esteem Inventory–II (N = 234).

Note. 16PF = Sixteen Personality Factor Questionnaire Fifth Edition.
p < .05.
We followed guidelines for stepwise multiple regression model development and validation described by Hair, Anderson, Tatham, and Black (1998; Hair et al., 2009), which utilizes split sample validation or split-half validation. In this validation procedure, a full sample regression model is compared across two subsample regression models. To create the subsamples, the sample is divided into half, typically using a random number generator. Next, regression models are estimated for each randomly generated subsample. Subsample regression models may then be compared with each other, as well as to the overall model using R2, adjusted R2, and the standard error of measurement. The goal is to determine which individual variables across models demonstrate the highest level of similarity, which is determined by beta weight. These variables govern the composition of the overall model.
We divided the total sample (N = 234) into two groups by generating a random number for each case using SYSTAT 9.0’s pseudo-random number generator. This number had a normal distribution with a mean of 0 and a standard deviation of 1. The sample was then split into two groups at the mean. The first of these groups contained 52% (n = 121) of the cases and the second contained 48% (n = 113) of the cases. For convenience, these subsamples were called Split 1 and Split 2, respectively. Although other ratios are possible, we chose the one most frequently employed, which is to split the sample into near equal parts.
We calculated initial equations using a stepwise procedure, including the total sample (see Table 3). These initial equations were then compared with two equations calculated using the split samples. Predictors that entered into each of the three equations are then examined to see if (a) the same predictors entered into each of the three equations and (b) the standardized beta weight for the predictors had the same sign (positive or negative) across the three equations. A final equation was constructed using only those predictor variables that were stable across all three regression models. The final overall equation (if one can be constructed) was determined when it demonstrated statistically significant improvement in prediction over chance. Statistical significance of the final equation was evaluated using the F statistic. Practical significance was examined using the adjusted r2, which provides an estimate of the amount of shared variance between a set of predictors and the dependent variable. A criterion of an adjusted r2 reaching at least .50 was set, so that the equation had at least 50% shared variance with the variable being predicted. This level of shared variance is considered as the minimum acceptable value for alternate forms of measurement of any given construct (Cicchetti, 1994; Hair et al., 2009; Janda, 1998).
Global Factor Regression Results of CFSEI From 16PF.

Note. 16PF = Sixteen Personality Factor Questionnaire Fifth Edition; CFSEI = Culture-Free Self-Esteem Inventory; EX = Extroversion; AX = Anxiety; TM = Tough-Mindedness; IN = Independence; SC = Self-Control.
This represents the adjusted r2.
Total N = 234, Split 1 n = 121, Split 2 n = 113, and Final N = 234.
p < .001.
Results
The means and standard deviations for the 16PF Fifth Edition and the CFSEI-II are provided in Table 1. These results indicate that the sample used in this study was one half standard deviation, or more, higher than the standardization sample of the 16PF Fifth Edition on A (Warmth), B (Reasoning), F (Liveliness), I (Sensitivity), and EX (Extroversion). In addition, the sample was at least one half standard deviation, or more, lower than the standardization sample of the 16PF Fifth Edition on N (Privateness) and TM (Tough-Mindedness). These differences are similar to those of the sample reported by Rieke and Conn (1994) in their work with the 16PF Fifth Edition and self-esteem. The manual for the CFSEI-II (Battle, 1992) contains the means and standard deviations for the various scales and total score based upon the standardization sample. The descriptive statistics for the current sample was similar to that of the CFSEI-II, with all scores within one half standard deviation of the mean.
The correlations between the 16PF Fifth Edition and the CFSEI-II appear in Table 2. These data indicate that three of four global factor scales (EX, AX, and IN) correlated moderately or low to CFSEI-II total and subscales. Two of the primary scales comprising the global factor scales AX (Anxiety) and Q4 (Tension) had negative correlations with self-esteem: As these scores increased, scores on CFSEI-II decreased.
Results of the multiple regression equations from the global factors are summarized in Table 3. In predicting the CFSEI-II Total score, the primary factors of AX (Anxiety) and IN (Independence) were stable for all three equations. The equations entered both factors and each in the same direction. The final equation reached statistical, but not practical significance. In predicting the CFSEI-II General scale score, the global factors of AX (Anxiety) and IN (Independence) were stable for all three equations. Each factor was entered by the equations and in the same direction. The final equation was statistically significant but failed to reach practical significance. The three equations predicting the CFSEI-II Social scale score entered the global factors of EX (Extroversion), AX (Anxiety), TM (Tough-Mindedness), and IN (Independence) in the same direction. The final equation was statistically significant, but failed to reach practical significance. In predicting the CFSEI-II Personal scale score, the global factors of AX (Anxiety), TM (Tough-Mindedness), and IN (Independence) were stable for all three equations. Each was entered by the equations and in the same direction. The final equation was statistically significant, but not practically significant.
The multiple regression results from the primary factors are summarized in Table 4. Prediction of the CFSEI-II Total scale score revealed the primary factors C (Emotional Stability), H (Social Boldness), and Q1 (Openness to Change) as stable in all three equations. The final equation was both statistically and practically significant. In predicting the CFSEI-II General score, the primary factors C (Emotional Stability) and H (Social Boldness) were stable for all three equations. Each was entered and in the same direction. The final equation was statistically significant but not practically significant. No final equation was constructed for the prediction of the CFSEI-II Social scale score because no primary factors were stable across all three equations. Prediction of the CFSEI-II Personal scale score showed that primary factor C (Emotional Stability) was stable for all three equations. The equations entered each factor and in the same direction. The final equation was statistically significant but failed to reach practical significance.
Primary Factor Regression Results of CFSEI From 16PF.

Note. 16PF = Sixteen Personality Factor Questionnaire Fifth Edition; CFSEI = Culture-Free Self-Esteem Inventory; R = multiple R; A − R2 = adjusted multiple R-square; F = F-ratio of the regression equation; Total = total sample; Split 1 = Split Validation Group 1; Split 2 = Split Validation Group 2; Final = final split sample–validated equation.
Predictors are the letter names for the primary scales of the 16PF Fifth Edition.
Unable to calculate.
p < .01.
Discussion
The primary purpose of this study was to explore the relationship of the 16PF Fifth Edition to a multidimensional model of self-esteem with an adult sample. Although all of the final regression models based on the global factors reached statistical significance, they did not exceed the criteria set for practical significance. However, the global factor equation for CFSEI-II Total scale score did approach practical significance (adjusted r2 = .46). The prediction of the CFSEI-II Personal scale score had the next highest adjusted r2(.39). The third highest prediction of the CFSEI-II General scale score had an adjusted r2(.34). The CFSEI-II Social scale score had the lowest adjusted r2(.21) of all the global factor equations.
Notably, all of the final equations shared the same central elements of lower scores on AX (Anxiety) coupled with higher scores on IN (Independence). This seems to suggest that the multiple regression model points to AX (Anxiety) and IN (Independence) being the salient factors in constructing a multidimensional model of self-esteem using the 16PF Fifth Edition. These findings are consistent with previous research using the 16PF Fifth Edition (Rieke & Conn, 1994). Unlike the findings reported by Rieke and Conn, the EX (Extroversion) global factor did not contribute centrally to the prediction of global self-esteem. Furthermore, the only consistent observed role for EX (Extroversion) was to predicate the CFSEI-II Social scale score, the scale measuring a person’s perceptions of the quality of his or her relationships. However, these differences may have been due to the differences between the ways the CFSEI-II and the SEI measure self-esteem. The SEI may have a bias toward extroversion (Francis, 1997). There are correlations, however, between EX and all scales of the CFSEI-II (see Table 2), albeit small to moderate ones. Participants in our study were mostly female (71%). At least two studies indicate a gender bias in the items comprising the SEI (Chapman & Mullis, 2002; Francis & James, 1998). To clarify these findings, we suggest further research.
In examining the relationship of the 16PF Fifth Edition to other facets of self-esteem measured by the CFSEI-II, several findings are worth mentioning. The 16PF Fifth Edition global factor equations for the CFSEI-II Total scale score and General score had the same predictor variables of AX (Anxiety) and IN (Independence). It is unclear from this research if this is due to the overlap of these constructs as measured by the CFSEI-II. Alternately, this finding may indicate that these constructs share an underlying dimension with the 16PF Fifth Edition. Still, it seems possible that there are differences between the constructs. This possibility is suggested by the finding that the amount of variance accounted for is approximately 35% in the case of the General scale score, while the Total score shares approximately 46% of the variance. Further research is necessary and may clarify this issue.
The regression equation for CFSEI-II Social scale score added other 16PF Fifth Edition factors beyond the inverse relationship between AX (Anxiety) and IN (Independence). In the equation for the Social scale, the 16PF factors of EX (Extroversion) and TM (Tough-Mindedness) were added. This suggested that while the Social scale shared the lower AX (Anxiety) and greater IN (Independence) factors found in the other dimensions of self-esteem, the factors of increased social participation and a more tough-minded stance on issues were included. The regression equations for the CFSEI-II Personal score were similar to the equations for the Social scale, minus the social participation factor.
Prediction of three of the four scores of the CFSEI-II was possible using the primary factors of the 16PF Fifth Edition. However, only one of the final multiple regression equations exceeded 50% shared variance with the CFSEI-II. This final regression equation was for the CFSEI-II Total score composed of the 16PF primary factors of C (Emotional Stability), H (Social Boldness), and Q1 (Openness to Change; adjusted r2 = .53). Rieke and Conn (1994) also found these primary factors related to overall self-esteem on the SEI. In their analysis, they also found A (Warmth), M (Abstractness), N (Privateness), and O (Apprehension) as significant predictors. While factor A (Warmth) did appear in one of this study’s equations, it did not consistently appear across the three regression equations predicting the CFSEI-II Total score. These differences may be due to variability in the samples used or dissimilarities in the measurement of self-esteem between the SEI and CFSEI. To clarify these differences, we suggest further research.
Consistent with the global factor results, the CFSEI-II Social scale score was the most difficult to predict. No primary factors were identified by the regression equations to construct a stable prediction. The regression equations for the CFSEI-II General and Personal scores accounted for approximately 35% and 40% shared variance, respectively.
The primary factor C (Emotional Stability) was the most consistent predictor of all facets of self-esteem as measured by the CFSEI-II. Primary factor C (Emotional Stability) was the only consistent predictor for the CFSEI-II Personal self-esteem score. The results of this study indicate, as previous research has suggested, that factor C (Emotional Stability) is consistently related to various aspects of self-esteem (Rieke & Conn, 1994). Primary factor Q1 (Openness to Change) was the predictor present in the CFSEI-II Total score equation that was not present in the CFSEI-II General score equation.
Perhaps the most interesting finding in this study was the lack of primary factor O (Apprehension) in any of the final equations, although it correlated significantly with the CFSEI-II Total scale and its subscales (see Table 2). Factor O (Apprehension) has been related to self-esteem in research with previous editions of the 16PF (Cattell, 1989), the current edition of the 16PF (Rieke & Conn, 1994), and is a central component of calculation of the global factor AX (Anxiety). Therefore, we expected factor O (Apprehension) to take a more central role in predicting at least global self-esteem. However, factor O (Apprehension) was present in only one of the three equations predicting the CFSEI-II General scale score. In addition, it did not play a role in any of the other regression equations. This finding is different from previous studies (Rieke & Conn, 1994), which used different samples, measures of self-esteem, and validation methods. Based on these results, we suggest further research to clarify this issue.
A secondary goal of this study was to make available split sample–validated equations for the user of the 16PF Fifth Edition. We anticipate that this will enable these users to apply the 16PF Fifth Edition to their setting using an alternative model of self-esteem. The following regression equations serve only as experimental measures. Further research to examine their reliability and validity is obviously needed; however, they may serve as an entry point for examining the relationship between a multidimensional model of self-esteem and the 16PF Fifth Edition. Table 5 provides the final regressions of the CFSEI-II from the 16PF Fifth Edition. Descriptive statistics are there, as well. The regression equations are reported using Sten scores for both the predictor and dependent variables as is traditional when using the 16PF Fifth Edition (Rieke & Conn, 1994).
Final Regression Equations of the CFSEI From 16PF (N = 234).
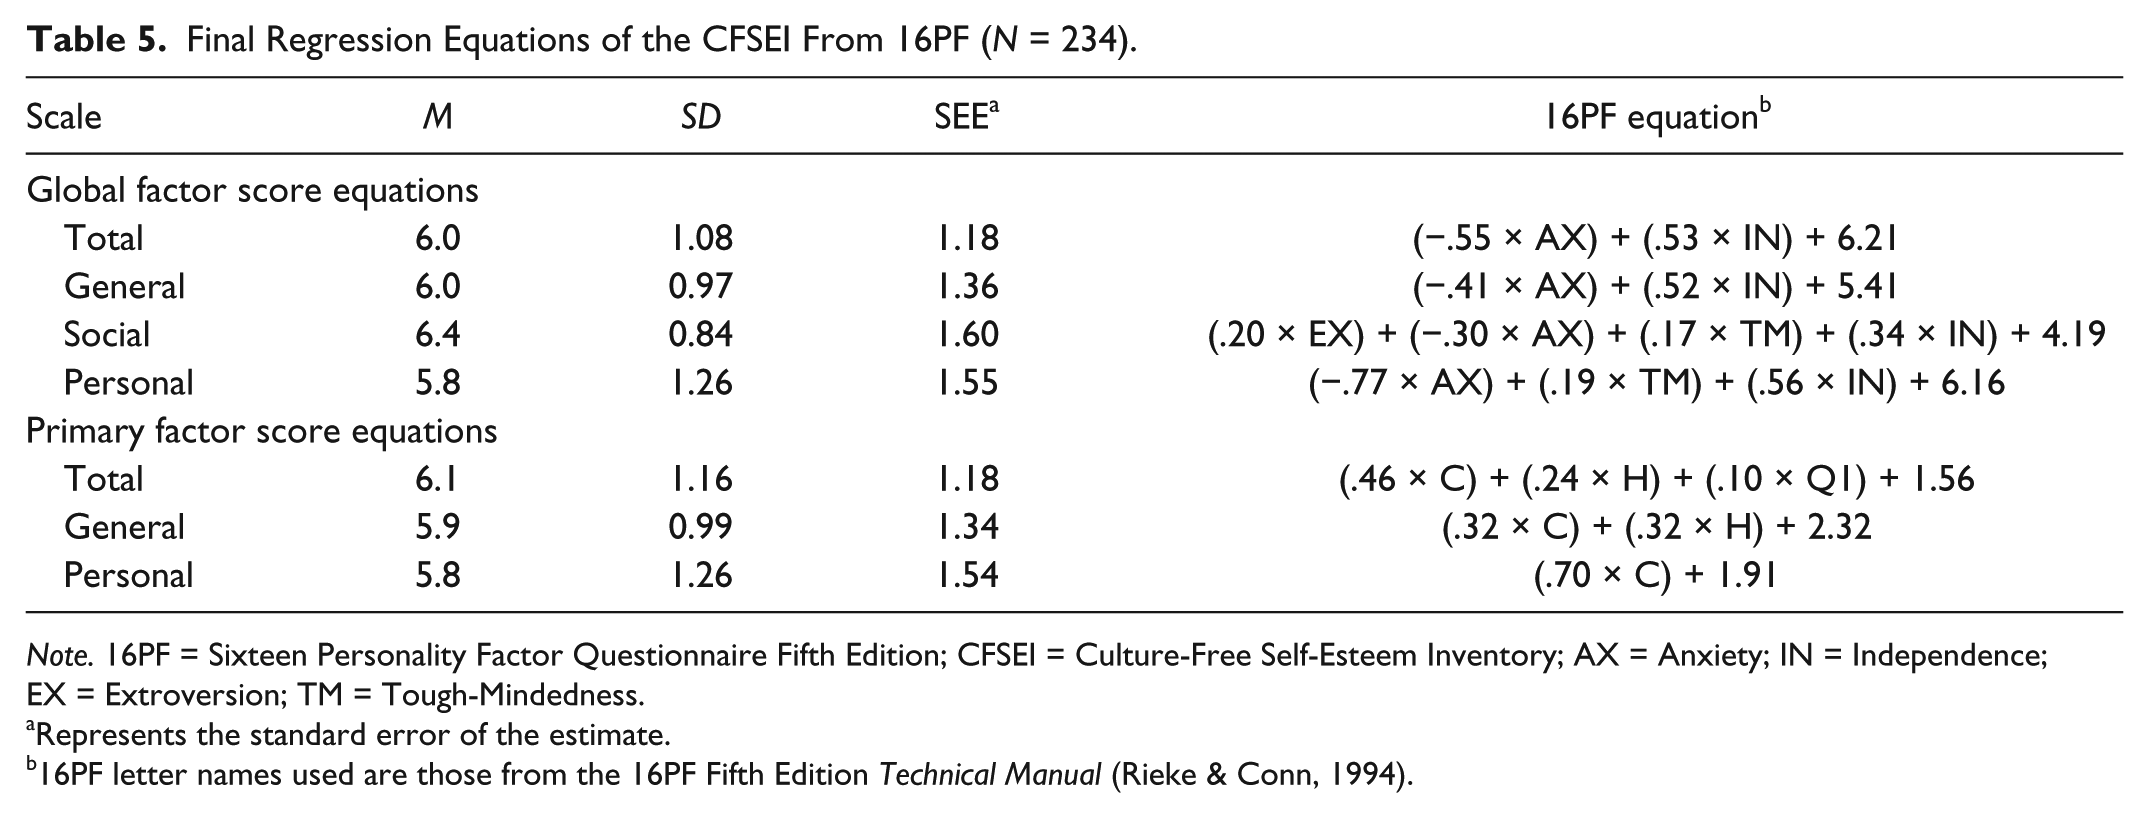
Note. 16PF = Sixteen Personality Factor Questionnaire Fifth Edition; CFSEI = Culture-Free Self-Esteem Inventory; AX = Anxiety; IN = Independence; EX = Extroversion; TM = Tough-Mindedness.
Represents the standard error of the estimate.
16PF letter names used are those from the 16PF Fifth Edition Technical Manual (Rieke & Conn, 1994).
Limitations and Recommendations
The limitations of this study simultaneously offer interpretative caution and research opportunities. First, the sample, although racially and ethnically diverse, was biased heavily toward females (71% of the sample). Future research should include larger and more representative samples. We suggest greater consideration of the variables gender and self-esteem. Along these lines, other measures of self-esteem might be utilized or compared with the CFSEI-II. Third, multiple regression is sensitive to the type of validation utilized, especially data splitting (Arlot, & Celisse, 2010). Furthermore, with any multiple regression study, there is no substitution for multiple replication studies to refine the finding of any given study. Fourth, as with any assessment tools, the application and interpretation of the 16PF Fifth Edition and CFSEI-II need to take place in the context of sound clinical practice marked by an appropriate understanding of assessment. Clinicians should use assessment materials with proper training and experiences. Furthermore, for clinicians to reach meaningful and useful interpretations of assessment data, they should integrate such information in the context of other relevant client data, such as family and cultural influences.
Footnotes
Declaration of Conflicting Interests
The author(s) declared no potential conflicts of interest with respect to the research, authorship, and/or publication of this article.
Funding
The author(s) received no financial support for the research and/or authorship of this article.