
Abstract
This article examines how the print media in Kenya reported road traffic accidents (RTAs). Using the priming theory, the article sought to identify the patterns of reporting and issues arising from such reporting of RTAs in the print media in Kenya. This is because the cost of RTAs in Kenya to the economy is estimated at Ksh. 14 billion per year. The study was a content analysis of two leading newspapers in Kenya—Daily Nation and the Standard newspapers. Data were collected using an analysis of the stories contained in the leading newspapers that related to RTAs. The content of 251 articles on RTAs was reviewed. A thematic analysis was done on the data which was then presented using simple tabular comparison of means, graphs, charts, and text. It was found that the newspapers play a significant role in passing on RTA information to the public, although a lot still needs to be done to address an obvious gap. Print media should improve its reportage of RTAs, the way it reports and primes it, and the amount of space allocated to stories on RTAs. Therefore, more space needs to be allocated to road safety issues even as all stakeholders should be encouraged to share information and opinions regarding road safety through the media. Information on RTAs and associated issues need to be published in prime pages regularly and not only when reporting on road crashes.
Introduction
The United Nations has declared the years 2011 to 2020 as the Decade of Action for Road Safety. The objective of declaring a decade-long action plan is to arrest the escalating levels of fatalities and injuries, thereby reducing the trend by half by 2015 (World Health Organization [WHO], 2013a). Road traffic accidents (RTAs) are an emerging public health problem worldwide with more than 1.2 million deaths and 10 million injured or crippled annually. Globally, RTAs are the 9th leading contributor to the burden of disease and the 10th leading cause of death by injury. Deaths from injuries are projected to rise up to 8.4 million worldwide by 2020. In developing countries, accidents are common and yet remain underreported mainly due to inaccurate statistics on road deaths. In Kenya, more than 3,000 lives are lost and more than 3,000 are left with serious disabilities annually due to RTAs (Manyara, 2013). RTAs also exert a considerable economic burden on developing countries, estimated to cost 1% to 4% of a country’s gross national product (GNP) per annum (Zwi, 1993).
Developing countries bear a large share of the burden, accounting for 85% of annual deaths and 90% of the disability-adjusted life years (DALYs) lost because of road traffic injury. Since road traffic injuries affect mainly males (73% of deaths) and those between 15 and 44 years old, this burden is creating enormous economic hardship due to the loss of family breadwinners (Worley, 2006). According to the recently published WHO Global Status Report on Road Safety, there are no laws for helmet wearing, blood alcohol concentration levels for drivers, or child restraints in Kenya, and where road safety laws do exist they are poorly enforced. Kenya is one of the 10 countries included in the WHO Road Safety in 10 countries project which will be conducted over 5 years by a consortium of six international partners.
A number of developing countries are currently experiencing a steady increase in the proportion and absolute number of fatalities from RTAs, whereas deaths from infectious diseases are on the decline. In Nigeria and Kenya, for example, a fivefold increase in the numbers of RTA fatalities was observed over the last 30 years. When compared with European and North American countries, African and Asian countries experience substantially higher fatality rates per 10,000 vehicles.
RTAs in Kenya
The public transport industry plays a vital role in the Kenyan economy. The industry serves other sectors and hence affects their growth and performance. The matatu industry alone contributes more than Ksh. 2.9 billion to petrol stations per month in the form of fuel consumption. In its Economic Recovery Strategy for Wealth and Employment Creation Programme (2003-2007), the Kenyan government marked the transport sector as the third pillar of the economic recovery effort set to achieve an increase in the gross domestic product (GDP) growth rate. According to this strategy, Kenya expects the transport sector to contribute to the reduction of poverty levels by the year 2015.
Kenya ranks among countries with the highest rate of road traffic crashes globally with an average of 3,000. The public service vehicles (PSVs) have been accused of overspeeding, carrying passengers beyond capacity, playing very loud music, reckless and careless driving, being rude to passengers, and driving un-roadworthy vehicles, among others. The problem has not been due to lack of road safety regulations but their poor enforcement (Chitere & Kibua, 2004). Other challenges currently experienced in the road transport subsector include lack of automation leading to loss of revenue, proliferation of fake documents, disregard of traffic laws, and inefficiency in service delivery. The cost of such road accidents to the economy is estimated at Ksh. 14 billion per year (Ogendi, Odero, Mitullah, & Khayesi, 2013).
In Kenya, the cost to the economy from RTAs is in excess of US$50 million exclusive of the actual loss of life. In the 1980s, the annual economic cost of RTAs was 5% of the country’s GDP (Yerrel, 1984). In 2011, the WHO estimated that Kenya lost US$4 billion annually due to road traffic fatalities; given that the GDP in 2012 was US$37.23 billion, this means the loss was approximately 11% of the GDP. This also means therefore that RTAs continue to wreak havoc on Kenya’s economy. As Kenya continues to grapple with high rate of RTAs which threaten economic growth, focus should be on the way the media have relayed and set the agenda for the RTAs issue to the masses. How have the media in Kenya profiled RTAs? Has it been informative enough or what role has it played? What kind of information have Kenyans received from the print media on RTAs especially after tough new transport rules and measures were put forth by the government of Kenya?
Odero, Khayesi, and Heda (2003) observed that Kenya, with an average of 7 deaths from the 35 crashes that occur each day, has one of the highest road fatality rates in relation to vehicle ownership in the world. They add, “Nearly 3,000 people are killed on Kenyan roads annually.” This translates to approximately 68 deaths per 1,000 registered vehicles, which is 30-40 times greater than in highly motorized countries. Road traffic crashes are the third leading cause of death after malaria and HIV/AIDS and present major public health problem in terms of morbidity, disability and associated health care costs (Odero et al., 2003).
Injuries from RTAs represent as much as 60% of all admissions to surgical wards.
According to the Police Department in Kenya, a total of 582 cases of motorcycle crashes were recorded in 2011 representing more than 7% of all road traffic crashes. The number of cases has continued to soar that several public hospitals have dedicated some wards to victims of boda boda accidents. For instance, recently, Kenyatta National Hospital’s wards 6A, C, and D have been converted into emergency wards to receive the swelling numbers of motorcycle victims. In 2012, the Head of Division of Noncommunicable Disease in the Ministry of Health reported that between 7% and 10% of all those in surgical wards of public hospitals are injured in boda boda accidents.
Kenya has already taken steps as part of the Bloomberg Philanthropies road safety initiative, founding an NTSA to tackle the problem. Significant hurdles remain and many deadly accidents appear to go unreported. In the WHO’s Global Status Report on Road Safety, the official figure for road traffic deaths in Kenya was around 3,000. But the organization estimated that the actual figure was much higher, at nearly 8,500 deaths. One third of all fatalities are passengers, many of them killed in what is termed as unsafe forms of public transportation (WHO, 2013a).
According to the Association for Safe International Road Travel (ASIRT; 2014), more than 3,000 people are killed in Kenya from RTAs every year. More than twice as many are permanently disabled by their injuries. These statistics need to be multiplied and seen in the context of deep family tragedy, of unimaginable grief and anguish, and of tremendous health and economic and disability costs. Huge sums of money are used in medical care: money that is desperately needed for preventative health care. With most people in Kenya employed in the informal sector, and having no health or life insurance and no social security, involvement in a road traffic crash by a family member has consequences for the entire household.
Road carnage continues to claim more and more lives of productive Kenyans, thereby wreaking havoc on its human productive resource. Recent steps by the Government of Kenya such as introducing alcoblow test on drivers to check their alcohol consumption levels and a ban on night travels for PSVs may be important steps. However, the way the media in Kenya report and inform the public on RTAs is important as it can provide information to Kenyans, which, in turn, may lead to decrease in RTAs, resulting in an overall socio-economic impact. If and when the media play an active and proactive role in reporting RTAs in an educative manner, it will help in galvanizing Kenyans to action. This is because the media influence both the public and policy makers and shapers, through collective engagement in making everyone informed and taking necessary steps to remedy the situation.
Kenya has seen a sharp increase in the number of registered motor vehicles over the past two decades from 1.4 motor vehicles per 100 people in 1985 to 2.7 motor vehicles per 100 people in 2007 (Odero, 1995). Road usage has correspondingly also gone up for every type of vehicle (Assum, 1998; Odero, 1995). Studies by Odero and the World Bank in 1995 and 1998, respectively, found that over the 7-year period from 1983 to 1990, there was a 125% increase in kilometers driven by cars and light vehicles, a 123% increase in kilometers driven by buses and taxis, and a 91% increase in kilometers driven by lorries (Assum, 1998; Odero, 1995). By 2003, the numbers of matatu were estimated at 40,000 (Asingo, 2004). In 2009, there were 1,221,083 vehicles registered in the country. The highest growth has been in personal cars and motorcycles. The number that is rising fastest is the rider-motorized two-wheelers imported (from India and China) mainly for boda boda taxi operations. According to the Economic Survey of 2010, the registration of new vehicles had increased from 45,000 units in 2005 to 161,000 units in 2009. Since 2005, the number of registered motorcycles in Kenya has increased almost 40 times, accounting for 70% of all newly registered vehicles in 2011 (Xinhua, 2012).
As it works toward achieving its “Vision 2030,” the Kenyan government has recognized that transportation is one of the key pillars in achieving its development goals, and therefore the country has invested not only in improving physical road infrastructure but also in road safety. NTSA was established in 2012 as the lead authority in Kenya for road transport and safety. In 2010, according to the Kenya Traffic Police department, there were 3,055 road traffic–related deaths in Kenya, though this is likely an underestimate. In the year 2013, the NTSA reported that 13,028 people were involved in road crashes. The social and economic costs to the country are huge: The NTSA estimates that RTAs cost Kenya’s economy about 14 billion Ksh. (approximately US$160 million as of June 2014) annually, or 5% of the country’s GDP (NTSA, 2012).
Causes of RTAs in Kenya
Based on the Accident Cause Code Classification, Kenya Police reports reveal that 85.5% of crashes are caused by poor driver behavior, of which driver error represents 44.4%, pedestrians and passengers 33.9%, and pedal cyclists 7.2% (Odero et al., 2003). Sometimes the transport industry stakeholders blame the poor state of Kenyan roads as the leading cause of accidents. With the recent improvement of infrastructure in Kenya, however, fatal road accidents continue to be reported. This has resulted in a blame game between especially the operators of the PSVs and the traffic department of Kenyan police, with the former blaming the poor state of Kenyan roads for accidents, while the latter blames PSV operators, especially drivers, for flouting the laid down regulations. PSV drivers have been blamed for careless driving, incompetence, overspeeding, drunk driving, and a myriad of other vices that render them prone to causing accidents that could have been avoided in the first place.
The Kenyan Traffic Police, on the contrary, while charged with enforcing The Traffic Act, have on numerous occasions been caught on camera receiving bribes, and have featured in various corruption indices reports as leading in the vice. In fact, while the Kenyan Police was reported as the most corrupt institution in Kenya by the East African Bribery Index Report, it is the traffic arm of this organization that tops the list. According to the Kenya Roads Board (KRB; 2013), there are 160,886 km of public roads of which 11,197 km, 7%, has been tarmacked. This therefore means that most of the roads may not be easily motorable. However, majority of the reported road accidents occur in the motorable sections with the three major highways—Nairobi–Thika road, Nairobi–Mombasa road, and the Nairobi–Nakuru–Eldoret roads, reporting most of the accidents. Thika road (50.4 km) and Mombasa road (470 km) happen to be some of the busiest roads in Kenya; hence, there has been a rigorous expansion plan in line with vision 2030. There are approximately 80 documented black spots, with the majority being along these three highways.
In examining the distribution of the accidents by various parameters, attention was given to the years 2004 and 2007. This is mainly due to the fact that 2003 saw the enactment and enforcement of more stringent traffic rules by the then minister of transport the late Hon. John Michuki mainly targeting the PSVs. Passenger capacity for matatu was reduced to 13; speed limit set to 80 km/hr and speed governors introduced, safety belts for all passengers was made mandatory, as well as the vetting of drivers and conductors, who now had to meet stricter guidelines.
Rapid growth in the use of motorized two-wheeled vehicles in many countries has been accompanied by increases in injuries and fatalities among their users. Motorcyclists comprise a third of all road traffic deaths in the South-East Asia and Western Pacific Regions, but are also increasingly represented among deaths in Africa and the Americas, which are seeing rapid increases in motorcycle use.
Priming theory is a concept through which the media effects among the people are enhanced by providing a basic perception that human minds take decisions based on the preconceptions that have already been stored in our memory. The memories are stored as a form of nodes, and they are interconnected effectively and mostly act as a frame of reference to the decisions that we make. Priming enables the audience to evaluate the situation and to conclude how effective the media have been to make a decision by providing a frame of reference. Thus, media create an influence among people to make a judgment or a decision.
Iyengar and Kinder (1987) introduced the concept of priming to describe how the media could go beyond telling people what to think about and shape the criteria used by individuals to judge the merits of their political leaders and the pressing political issues. Priming presumes that when evaluating political phenomena, people do not take into account all they know, even if they wanted to; time often prevents them. Instead, people rely on what comes to mind, “those bits and pieces of political memory that are accessible.” Iyengar and Kinder found evidence to support the claim that “television news was a powerful determinant of what springs to mind and what is forgotten or ignored.” For Iyengar and Kinder (1987), the power of the media does not rest in persuasion but in “commanding the public’s attention (agenda setting) and defining criteria underlying the public’s judgments (priming)” (Williams, 2003).
The concept of priming comes from cognitive psychology and means a cognitive situation in which a prior stimulus modifies the propriety and ease of recognition or processing of a later stimulus (Scheufele, 2000). Priming was defined as communication criteria and standards used by recipients to evaluate political reality, which are issues most accessible in the media (most often and intensively reported).
Priming would occur because the primed information is “fresh” in memory. In this scenario, the time gap between exposure and decision is crucial. The more time passes before the decision is actually made, the greater the possibility that the primed material fades to long-term memory, nullifying the priming effect (Coleman, 2010).
Priming is often discussed in tandem with agenda-setting theory. The reason for this association is twofold. The first, both theories revolve around salient information recall, operating on the idea that people will use information that is most readily available when making decisions. The second is that priming is the latter part of a twofold process with agenda setting that takes place over time. Once agenda setting has made an issue salient, priming is the process by which “mass media can shape the considerations that people take into account when making judgments about political candidates or issues.”
Priming theory centers on the concept of planting an idea into the minds of the people and allowing that idea to dominate within the public. Priming is believed to work because members of the public have limited knowledge about certain issues, and they tend to focus selectively on portions of what they do know when they make voting decisions. They base their decisions upon the information that is in the forefront in their minds. The same thing happens when the press begins spending time on an issue that might ordinarily simmer on a back burner; once the issue becomes news, it tends to become relevant. For example, in spite of RTAs being a big problem on Kenyan roads for some time, what have the media done to foreground the issue so that it can have an impact it has on the opinions the public in Kenya forms about those at the center of the attention.
This question is important because those who subscribe to priming theory believe that the media have the power to control how audiences interpret new information (Scheufele & Tewksbury, 2007). Road crashes are a staple of our news media, but they contain little contextual information that would provide the community with a better appreciation of road safety issues and the measures available to improve personal and community safety (Jiggins, 2004). If this be the case then, does it mean that the media in Kenya have not been foregrounding the issue of RTAs as required? Is this what is leading to more injuries and deaths? Is it because the media do not prime the RTA issue well that the problem continues to grow?
Priming of RTAs in the Media in Kenya
The news media in Kenya have a tendency to over-report crash events as opposed to analyses of the factors that lead to crashes, remedies, trends, or issues. Knowing that journalists are under enormous pressure means that the packaged story, with relevant footage, spokespersons, and background material, has a much higher probability of getting positive media coverage (Anini, 2013).
Competition from the electronic media has resulted in newspapers moving toward the editorial and opinion business and away from the reporting business. Media organizations are also becoming more business orientated (Kirk, 2006) and the search for profit has impacted on the more costly forms of journalism such as investigative reporting with a significant decline in this area. The news media in Kenya have a tendency to over-report crash events as opposed to analyses of the factors that lead to crashes, remedies, trends, or issues. This is because news values related to impact, proximity, prominence, relevance, and human interest are all important in determining how much significance a news story is accorded by particular media (Marsh, 1991).
In the case of traffic, the impact value is determined by the perceived magnitude and consequences of the accident, namely, the number of cars wrecked and the number of “innocent” people injured, killed, or maimed. The more people affected, the bigger the impact of the story. The proximity value is realized through reader association, namely, the closer the target reading audience is to the event, the greater its news value. The proximity value influences which page the story will be printed on. In terms of the prominence value, the media assume that the public cares more about celebrities than they do about people they do not know.
Similarly, it is surmised that public transport commuters are more likely to be concerned about taxi-related crashes. So, for example, when celebrities die in a car accident, their death is likely to be reported on the front page, just as taxi-related crashes are likely to be widely reported on. The relevance value is signified when events such as traffic crashes affect the majority of South Africans, albeit directly or indirectly. Finally, an event is deemed to be newsworthy when it is associated with human interest. Even though a story itself may be weakly related to the other news values, it may be defined as news when, for instance, it gets people talking about the magnitude and serious consequences of crashes on South Africa’s roads (Marsh, 1991).
Chartier and Gabler (2001) also observed that drama seems to be the mainstay of media coverage. The media tend to highlight existing concerns, uncertainties, and conflicts; rarely question the legitimacy of any source; and 30 present all sources on an equal footing. Information is provided to the public with little or no analysis of its technical accuracy.
Other commentators (Connor & Wesolowski, 2004) have noted that newspapers presented fatal crashes as dramas with a victim/villain storyline; in keeping with this narrative strategy, newspapers were most likely to cover stories where a driver survived to take the blame. By highlighting crashes that diverge from the norm, focusing on the assignment of blame to a single party, and failing to convey the message that preventive practices such as seatbelt use increase odds for survival, newspapers remove crashes from a public health context and position them as individual issues.
Method
This article used content analysis as a method for examining the priming of RTAs by the leading newspapers in Kenya—Daily Nation and the Standard newspapers. This technique involves analyzing the content of documented materials including books, magazines, and newspapers and of other verbal materials that are either spoken or printed. Content analysis was first used by Harold Laswell to analyse the content of Nazi propaganda to find out why the propaganda had such great impact on those who heard it. Each and every article carrying RTA information was reviewed. A careful analysis of the stories as presented in the newspapers was also carried out. The study looked at placement, frequency, treatment, and size of articles. It also looked at use of photo captioning in seeking to establish whether the newspapers take into account the use of vital elements when reporting about road safety in Kenya. The research population entailed newspaper articles from both Daily Nation and the Standard newspapers published between January 2014 and June 2014.
Research Population
A population is a group of individuals, objects, or items from which samples are taken for measurement . The research population entailed newspaper articles from both Daily Nation and the Standard newspapers published between January 2014 and June 2014.
Data Collection Methods
The study entailed a sample size of all newspaper articles from Daily Nation and the Standard newspapers, which carried stories and information on RTAs from the period under study—the period between January 1 and June 31, 2014. This period was purposely sampled because the period saw various measures put into force by the Kenyan government in an effort to curb road carnage. First, there was the introduction of the alcoblow that measured drivers’ levels of alcohol consumption. At the same time, the government of Kenya introduced a ban on night travel.
The paper used textual content analysis to collect data. The study considered all the articles published in Daily Nation and the Standard newspapers. Under this approach, each and every item or unit constituting an article was selected for data collection. In this case, all newspapers that carried stories, articles, and information on RTAs were considered for analysis. This was the most convenient approach for this study since in the 6-month period considered, not every newspaper may have carried a story on RTAs.
Data Analysis and Discussion
This research analyzed articles on RTAs during the specified period (January 1 to June 31, 2014) in Kenya appearing in Daily Nation and the Standard newspapers. In this respect, the following aspects were analyzed and coded accordingly. The study used content analysis to collect data for this study. First, the process involved selecting a sample of all copies of Daily Nation and the Standard newspapers.
Once the study selected a representative sample from the population, the study embarked on perusing them while looking for stories on RTAs. The process involved identifying the story; classifying them into their respective categories, for example, a news item, a feature story, an editorial, an advertising feature, news in brief, opinion, letter to the editor, among others; measuring the amount of space allocated for them in square centimeters; and determining the source of the story, the placement of the story in the newspaper, the number of stories in the newspaper, the main event, the intention of the story, and the origin, that is, whether local or international.
The unit of analysis was an individual story (news story, feature, editorial, letter to the editor, or commentary, etc.) whose contents were examined in terms of the following:
Number of articles,
Their size (in cm2),
Type (whether news, opinion, feature, editorial, book review, letter to editor, or advertisement),
Placement (front page, page 2, page 3, other inside pages, special feature/magazine section, or back page),
Prominence (edition lead, page lead, main editorial, or special commentary).
The analyzed stories were then presented in the table (the main research instrument), which was designed in such a way as to ensure flawless entry of the data into a microcomputer for analysis. The subsequent data aggregation and analysis was done using the SPSS computer software and involved mainly charts to indicate associations and differences in the treatment of RTA stories by Daily Nation and the Standard newspapers.
Data Analysis and Interpretation
Frequency of Articles on RTAs
The first attempt of this study was to analyze the frequency of RTAs as reported in the two newspapers the Standard and Daily Nation as the data, which is summarized below.
As Table 1 shows, for the number of RTA articles appearing in the Standard newspaper, the month of January had the highest number of reports or articles that can be explained by the fact that the new regulations were announced in late December, 2013. Therefore, there was increased activity in the month arising from the announcement.
Frequency of Publishing Road Traffic Accident Articles by the Standard Newspaper.

As Figure 1 shows, during that period, for the Standard, January was the highest month of reportage.

The Standard newspaper publication of RTA articles.
On the contrary, Daily Nation reported the RTAs as summarized below.
As Table 2 shows, Daily Nation reported on RTAs with the highest reports still in January, 2014, just as happened in the Standard newspaper. The least reported were in May, 2014.
Frequency of Publishing RTA Articles by Daily Nation Newspaper.

Note. RTA = road traffic accident.
From the data above (Figures 1 and 2), it is clear that during the period under study, highest numbers of articles touching on RTAs were published in the months of January and April for both newspapers with each accounting for 33% and 22%, respectively, for the Standard, and 31% and 39%, respectively, for Daily Nation. The lowest cases were reported during the month of May in both newspapers. For the highest numbers in January, this could be because the new traffic regulations were put in place in December, 2014. Thereafter, there was coverage to educate the masses about the new traffic regulations. For the month of May, 2014, this could be attributed to the fact that on April 1, 2014, the high court in Kenya had suspended the new traffic regulations, a fact which the newspapers gave some considerable coverage. Overall, however, the coverage picture coming out of this data indicates that RTAs were not given adequate coverage or were given very little attention, thereby media role of setting the agenda did little to keep issues on RTAs in the public eye.

Daily Nation newspaper publication of RTAs articles.
Placement of Articles
Under this unit of analysis, sections of the newspapers where the articles were published were looked at. To manage this, the newspapers were divided into four major sections, namely, lead story (top story), pages 2-3, inside pages, and back page. Pages 1-3 and back page of the newspaper are usually considered prime placement. This is because information published on these pages is easily accessible to readers.
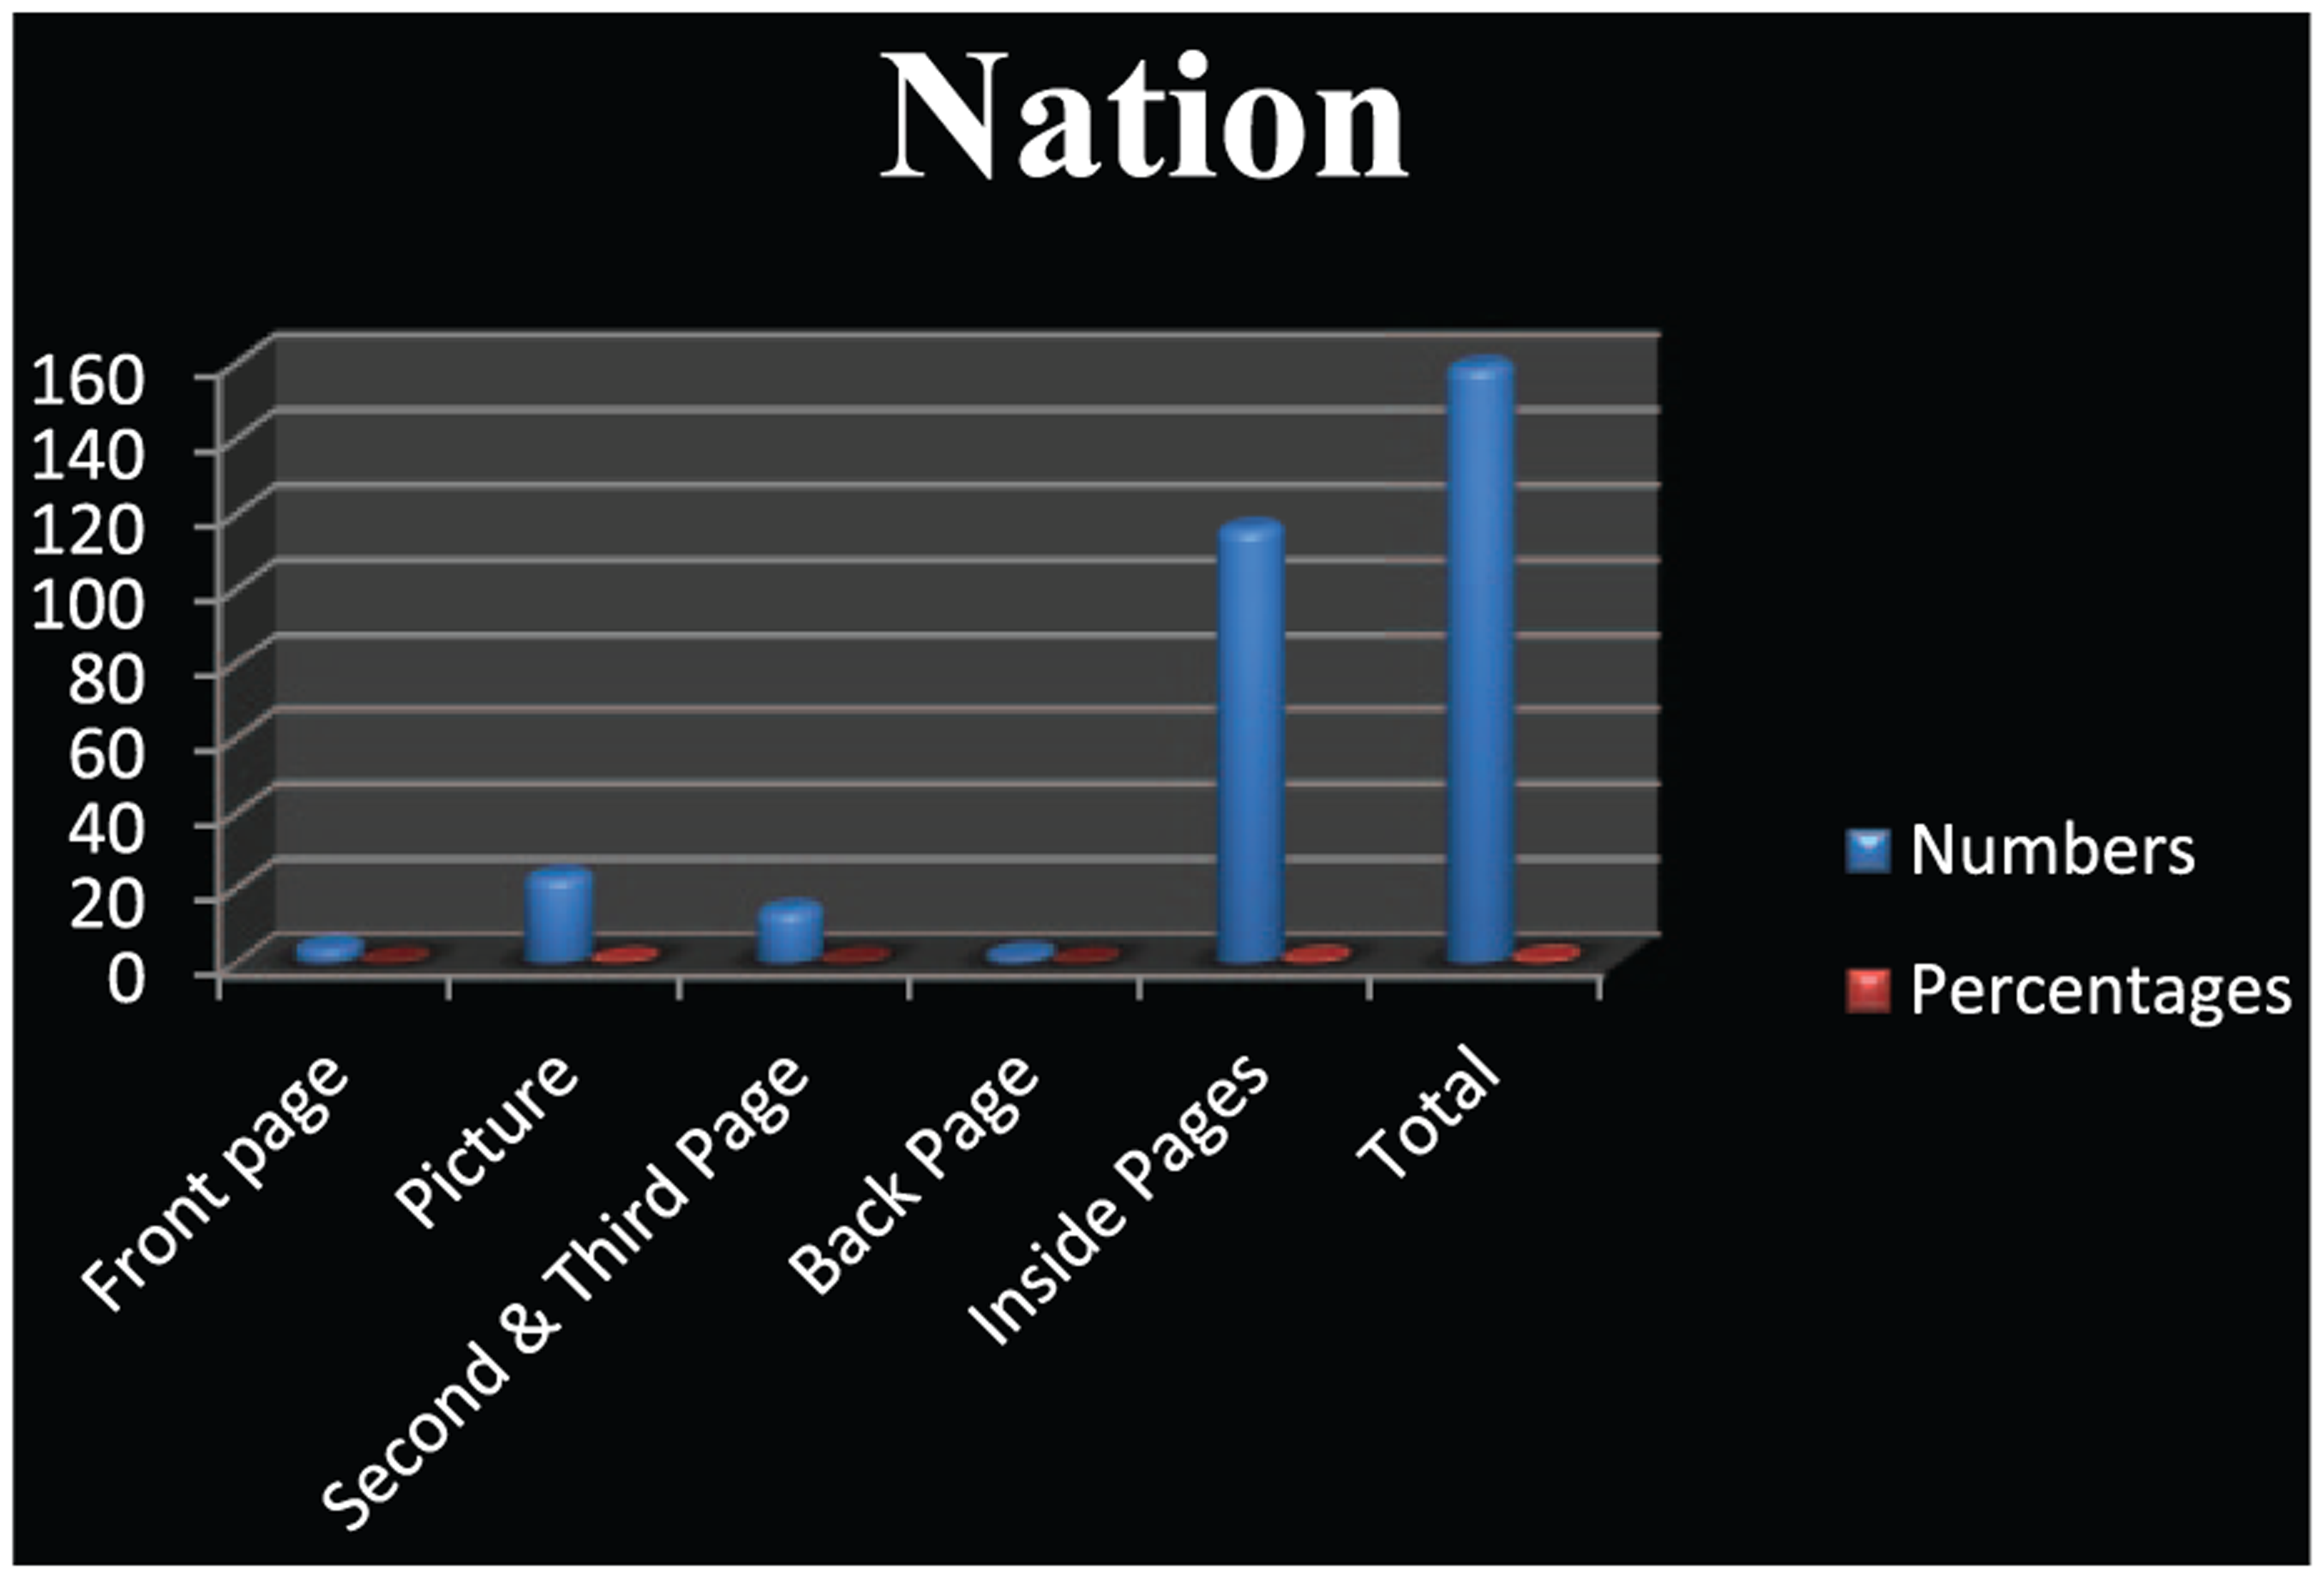
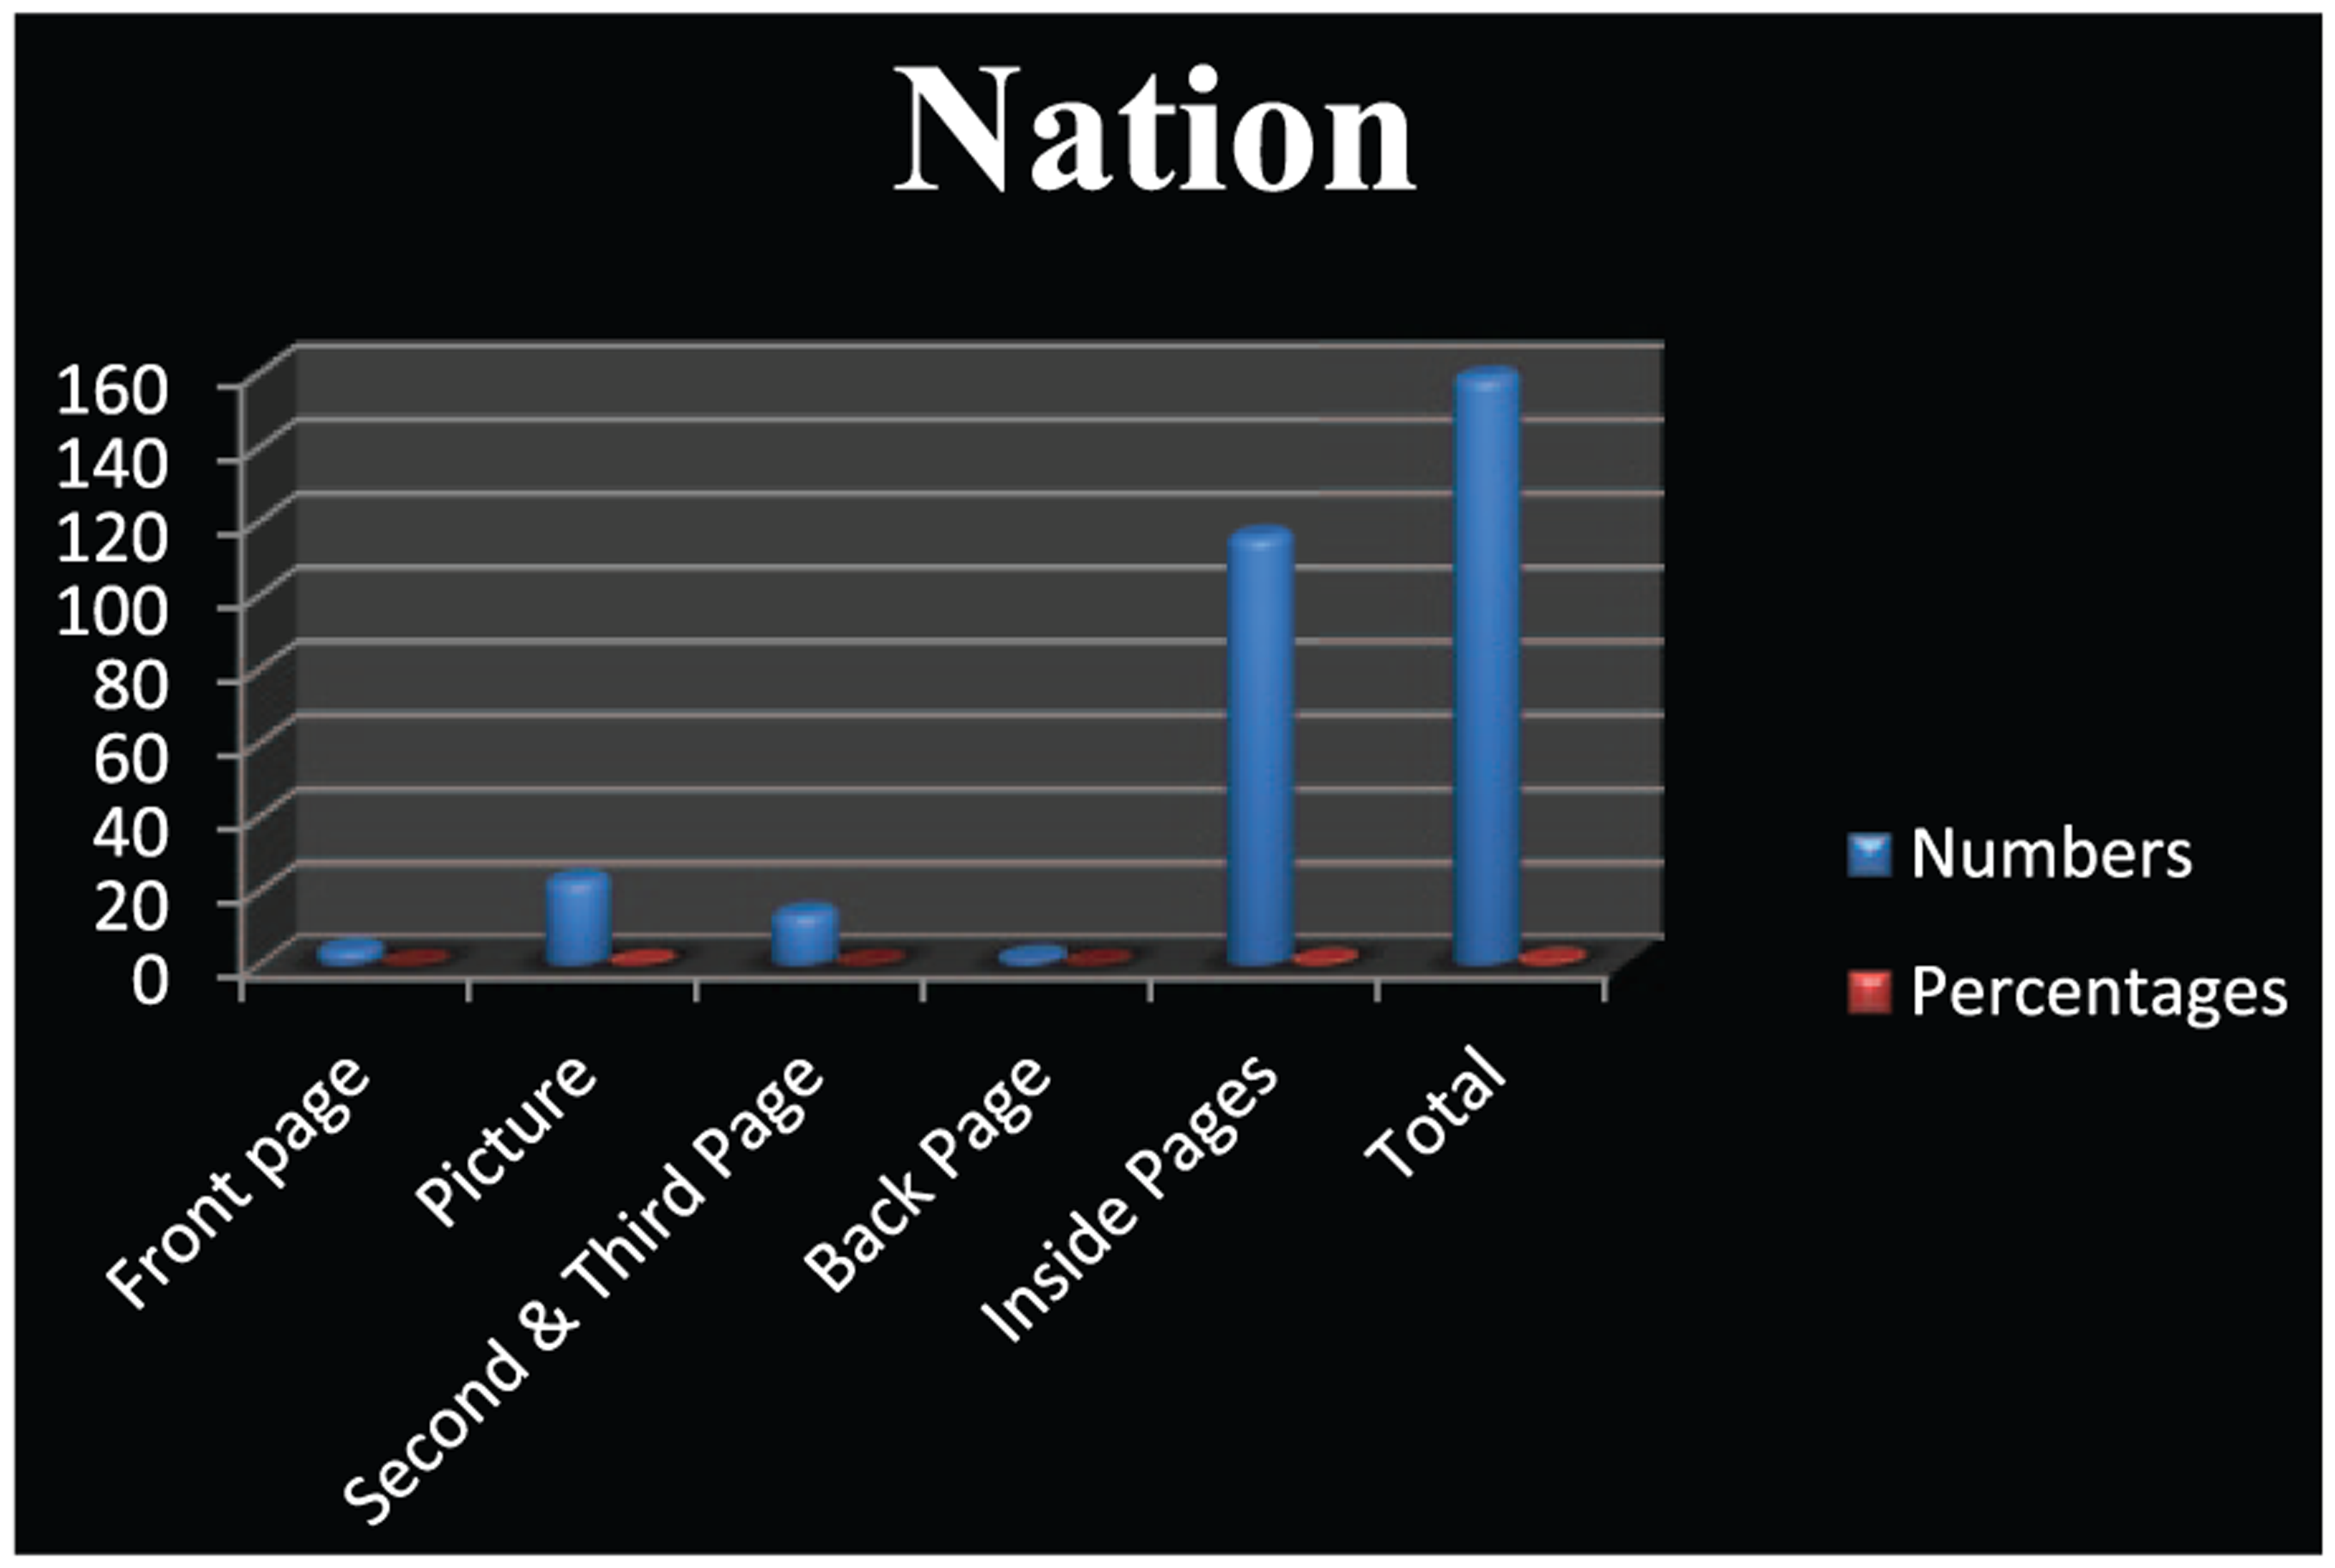
As shown in Figure 3 and Table 3, which have been generated using data from the Standard newspaper on placement of articles during this period, most articles were placed in the inside pages (83%) meaning that not much weight was placed on the articles, whereas there was nothing in the front pages or even back page. Pictures constituted 13% of the space allocated in the Standard newspaper.

Placement of articles on RTAs by the Standard.
Placement of Articles on Road Safety by the Standard.

In terms of placement, as shown in Table 4, Daily Nation had more than the Standard newspaper. It had at least 3% coverage in the front page on RTAs. Like the Standard, most of the articles were also placed in the inside pages (73%) whereas the back page had 1% representation. Pictures took 14% of placement. In media and communication, the use of pictures is important because some of them are worth a thousand words.
Placement of Articles on RTAs by Daily Nation.

Note. RTA = road traffic accident.
Therefore, a comparative analysis of the two newspapers’ placement of articles shows that (Figures 3 and 4) many articles dealing with RTAs were published in the inside pages of both the newspapers. This accounted for 73% and 83% for the Standard and Daily Nation, respectively. In both newspapers, stories on RTAs were covered minimally at page 1 or front page. The Standard had 0% coverage as lead story of the newspaper during the study period, whereas Daily Nation managed a paltry 3% of the newspaper lead story. Turning to pages 2-3, the situation was the same as minimal number of stories appeared on these pages with the Standard accounting for a mere 4% and 0% for its back page coverage.
Placement of articles on RTAs by Daily Nation.
Daily Nation had 9% and 1%, respectively, for pages 2-3 and back page. The use of pictures to tell stories on RTAs in the sampled newspapers was no better. It is understood that photographs in journalism inform, educate, and enlighten readers about current issues, enhance the credibility of the stories, and depict reality apart from furnishing evidence to show the authenticity of a news story or give proof of an event that occurred. Photographs also have aesthetic values that enable a photograph to serve as a tool to attract readers’ attention and break the monotony of news content. Thus, photographs enhance and beautify the pages of a newspaper (Buckler & Travis, 2005). This fact did not seem to play out in the newspapers under study during the period studied. Although the Standard had 13% of coverage, Daily Nation had 14% on that account. What these data mean is that the articles published by the Standard newspaper and Daily Nation newspaper are mostly confined to the inside pages. Only those reporting on fatal crashes where the casualties are many make it to page 1. This impacts negatively on accessibility of information on RTAs and public education on the same.
Space Allocated to RTA Articles
Research has shown that there is significant relationship between length of the news article and its perceived importance (Cissel, 2012). By analyzing the article length, the researcher was able to understand and draw conclusions about how important the media source felt the covered topic was or should be regarded by its reader. The reason is that the magnitude of a news article can be signified by the location of the story and its length. For example, a news story on the front page and 900 words long can be perceived as more important to its reader than one buried in the middle of the publication and written with only 200 words. The sizes of the articles were categorized depending on their length in cm2. The sizes of articles reflected some policy about the amount of space given to an item on RTAs and therefore some sense of editorial policy of the news organization on the subject.
According to Table 5 and Figure 5, majority of RTA articles in the two newspapers were small in size with January and April allocations in space leading in that order. As explained earlier, this could be because of the fact that new traffic regulations in Kenya were started in late December, 2013, meaning that in the month that followed, the press was trying to set the agenda on that issue. The high court in Kenya suspended the regulations in April, 2014, explaining why the month of April allocation within the newspapers’ space went up. Clearly, both newspapers gave the subject nearly the same space. Most of the stories in both newspapers were allocated between 10 and 20 cm2 (46%), whereas those which were allocated small space or were just fillers accounted for 36% of the space. Stories that had an allocation of space more than 25 cm2 in both papers accounted for 18% of total newspaper space. The study therefore found out that stories on RTAs were not given enough space by both newspapers. In competing for space with other stories, RTAs articles were edited to fit within the little space available.
Size of Articles (in cm2) on RTAs by the Standard and Daily Nation.

Note. RTA = road traffic accident.

Size of articles (in cm2) on RTAs by the Standard and Daily Nation.
Prominence of Articles
This relates to how the stories or articles were laid out on whichever page that they finally appeared. This was determined by looking at different levels of headlines, which was guided by font size. For the purpose of this study, stories were grouped into four categories: page lead, second story, third story, and brief. The data mined are as below.
According to Table 6 and Figure 6, prominence of stories in the Standard shows that most articles covered ended up as briefs (83%). In the pages in which they appeared, most stories were not prominent as only 13% of the stories appeared as the third top stories. Not a single article appeared as page lead. Essentially, what this means is that the articles on RTAs were given very low prominence in the two leading newspapers in Kenya.
Prominence of the Articles on RTAs by the Standard.
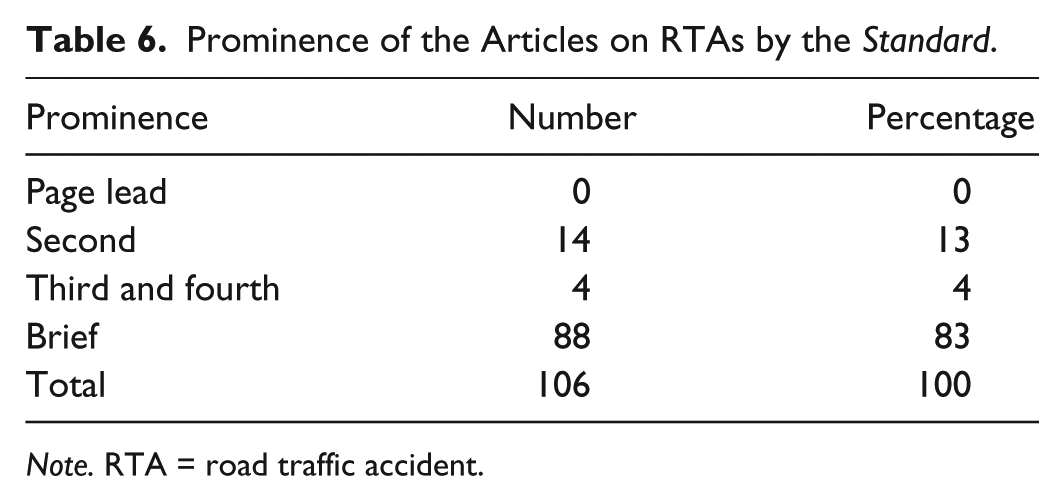
Note. RTA = road traffic accident.

Prominence of the articles on RTAs by the Standard.
As can be seen in Table 7, Daily Nation, the highest number of articles were placed as briefs (73%) whereas second leads on pages was at 9%. The Standard had 0% as page leads. At least Daily Nation had page leads that were at 3%.
Prominence of the Articles on RTAs by Daily Nation.

Note. RTA = road traffic accident.
Comparatively, as can be clearly seen from Figure 7 and figures above, the majority of articles on RTAs were briefs, having accounted for 83% and 73% for the Standard and Daily Nation, respectively. This means that the two newspapers never gave prominence to stories on RTAs, and thus did not adequately set the agenda for this issue effectively. Page lead came in at 0% for the Standard, whereas Daily Nation had 3% on this account. Stories or articles that are published as page 1 lead are easily noticed and picked out by a reader. Prominence tends to diminish as headline font size reduces. A story that is published as a brief does not project itself clearly from the page and is therefore easily bypassed by a reader. From these data, it is clear that both the Standard and Daily Nation put little emphasis on RTAs, having treated most of the stories as briefs. This may have compromised the effectiveness of stories capturing readers’ attention. Articles published as briefs do not reflect the seriousness of the subject. In this case, a reader is likely to ignore these stories and focus on those that are treated with big and bold headlines.
Prominence of the articles on RTAs by Daily Nation.
Type of Stories
There are various types of stories in a newspaper. For this study, stories were classified as news, features, editorials, opinion, and letters to the editor.
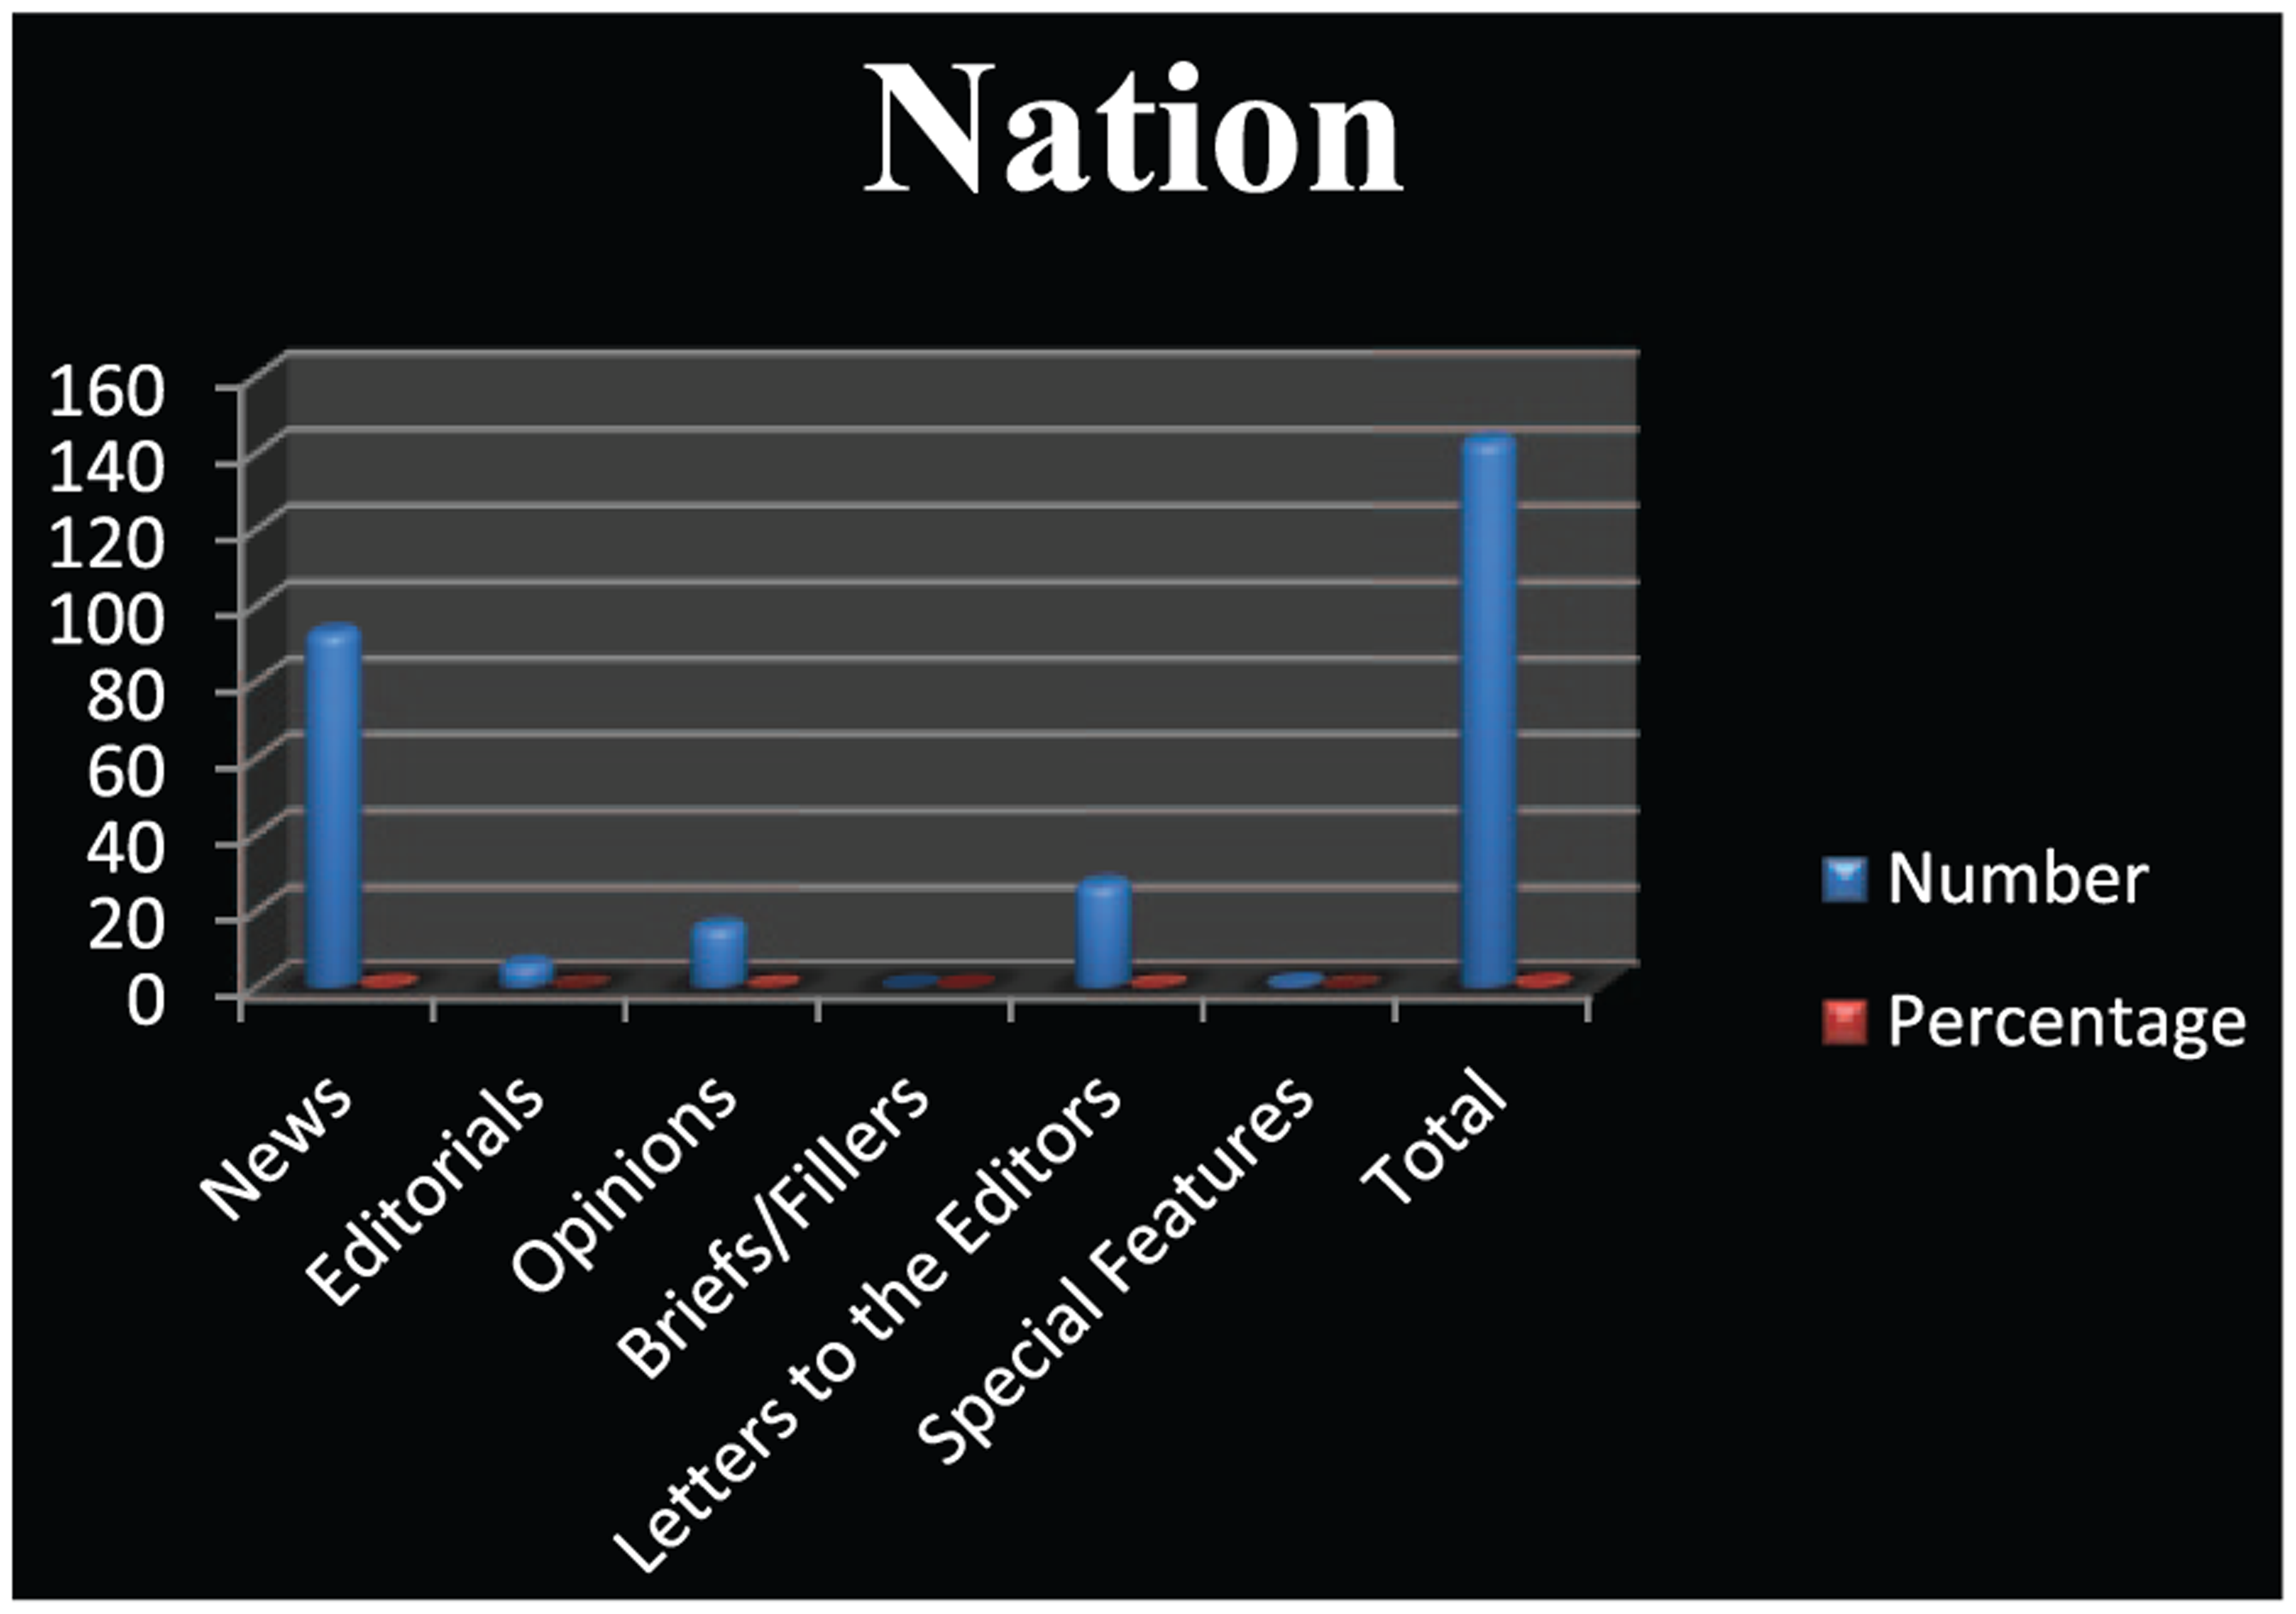
According to Table 8, the type of articles that appeared on RTAs in the Standard was mostly news (77%), whereas opinions and editorials accounted for 17% and 3%, respectively. Features were at 2% whereas there were no briefs or letters to the editor on the issue of RTAs.
Type of Articles on RTAs by the Standard.

Note. RTA = road traffic accident.
What Table 8 and Figure 8 mean is that little attention is given by the media in Kenya about RTAs because most of the articles are stories that are stuck in the inside pages, whereas important parts such as the editorials are a paltry 3% of newspaper content.

Type of articles on RTAs by the Standard.
Table 9 shows that Daily Nation followed what the Standard did in terms of the type of articles on RTAs as news coverage took the lions’ share (65%) followed by letters to the editor, which covered 19%, whereas features were at only 1%.
Type of Articles on RTAs by Daily Nation.

Note. RTA = road traffic accident.
Comparatively, as shown in Figures 8 and 9 and Tables 8 and 9, the type of stories carried by both newspapers is interesting. Both newspapers seem to have resorted to news as a way of informing the public about RTAs. This is clearly the point as of the 108 articles analyzed from the Standard for this study, 77% were news items. This compares unfavorably as editorial has 3%, opinion on the matter has 17%, letters to the editor comprise 2% leveraging with features at the same percentage.
Type of articles on RTAs by Daily Nation.
Daily Nation gave all other sections almost the same attention although Daily Nation dedicated less space to news than the Standard. At the same time, the study shows that Daily Nation gave quite some space to readers to react to the issue of RTAs through the letters to the editor section (19%) compared with the Standard which had dedicated 2% of space.
This kind of coverage is worrying because it depicts the newspapers as only interested in reporting on RTAs but not analyzing or interpreting issues on RTAs for the public through other types of articles. Coverage of issues through different types of articles such as opinions, features, and commentaries can have a greater impact on public education. This is the best way of agenda setting.
Discussion
First, the study has established that prominence of articles on RTAs was subdued in many ways than one. The Standard and Daily Nation newspapers had most of articles on RTAs tucked in the inside pages of the newspapers. This, in most cases, did not serve the purpose of informing and educating the public on issues related to RTAs. Again, even in such a situation, many articles were reduced to small stories and briefs. Information on RTAs only made it to the prime pages when there was a major accident involving many deaths. For example, both newspapers placed many articles dealing with RTAs in the inside pages of the newspapers during the study period. This accounted for 73% and 83%, respectively, for the Standard and Daily Nation. In both newspapers, stories on RTAs were covered minimally at page 1 or front page. The Standard had 0% coverage as the lead story of the newspaper during the study period, whereas Daily Nation managed a paltry 3% of the newspaper lead stories. In this case, both newspapers did not effectively play their role of setting the agenda. They downplayed their capacity to influence public opinion by failing to emphasize issues on road safety. Priming theory is about making certain issues most accessible in the media. Playing road safety issues small by publishing articles as briefs and hidden in the inside pages does not help. Information must stand out and scream for attention. Therefore, proper attention ought to be given to the treatment of this information.
Second, the focus of articles was skewed in favor of reporting incidents of RTAs other than information factors that lead to crashes, remedies, trends, or issues. This finding fits into what was pointed out in the literature review, where Wilson (2001) observed that stories that arouse fear sell newspapers and journalists exploit this. This is why news was the type of articles that were represented more than anything else. Out of a total of 108 articles analyzed from the Standard for this study, 77% were news items. This compares unfavorably as editorial has 3%, opinion on the matter has 17%, and letters to the editor at 2% features at the same percentage. Daily Nation had news coverage taking the lion’s share (65%), followed by letters to the editor, which covered 19%, whereas features were at only 1%.
This kind of coverage is worrying because it depicts the newspapers as only interested in reporting on RTAs but not analyzing or interpreting issues on RTAs for the public through other types of articles. The study also established that the focus of articles was directed at reporting on accident occurrences than on issues on policy and educating the public. This fits well into what Marsh (1991) observed that news values related to impact, proximity, prominence, relevance, and human interest are all important in determining how much significance a news story is accorded by a particular media. In the case of road safety, journalists and reporters tend to favor stories with perceived high magnitude and consequences in terms of deaths and serious injuries. This was confirmed by this study where only stories on fatal crashes were carried as splash. Even when most of the articles were just news items, another interesting issue which came out of the study is that majority of the articles did not have supporting images either as photos or graphics. Very few photos were published either accompanying stories or as standalones.
Third, the frequency of articles published during the period under study also pointed at a unique trend. In the months of February, March, May, and June, fewer articles on RTAs were published in the Standard and Daily Nation. Reportage was high in January because the new regulations came into force in late December, 2013. Therefore, as usual, the media reportage was in a reactionary manner in January. By February, the issue was no longer hot, explaining why there was a decline in the numbers in reporting on RTAs. Even on an issue such as the ban on night travel, the media were not proactive enough in educating the public. Articles reported on this issue during that period were just reports from stakeholder complaining or going to court about the new regulations.
Fourth, another interesting issue that came out of the study is that most of the stories analyzed in the study were reports from reporters. There was little analysis and interpretation of events or education for the public in most of the articles on RTAs. Both newspapers did not take time to analyze the factors that lead to, and how to avoid, the accidents, causes, trends, or issues. This finding fits into what Wilson (2001) observed that stories that arouse fear sell newspapers and journalists exploit this. The study also found out that the majority of the articles did not have supporting images either as photos or otherwise. Very few photos were published either accompanying stories or as standalones. Interestingly, Daily Nation performed rather better compared with the Standard in giving a voice to the readers to give their opinions (letters to the editor) on the subject matter of RTAs. In so doing, to that extent, it gave a platform to readers to even educate each other on various issues concerning RTAs. This situation can be explained by the fact that advertising occupied most of the space leaving a small percentage of space for editorial content. This fits into what researchers feel about the subject when they assert that media organizations are becoming more business oriented (Kirk, 2006). This is because advertising acts as source of revenue and profits for running media organizations. Search for profits has impacted on the more costly forms of journalism, such as investigative reporting.
Most articles reported on number of persons injured, and nearly every article indicated whether fatal injuries occurred. Articles rarely stated how victims were dealt with after the crashes. Few articles provided follow-up information on crash victims. There was little mention of other protective factors: divided roads, sidewalks, or securing vehicle loads. This kind of reporting makes newspapers an incomplete source from which to influence public perceptions and attitudes.
Finally, preventive steps were discussed in commentaries and editorials, but low coverage in crash reports represents a missed opportunity to link crash consequences with injury prevention. Commentaries were often written by the general public, some of whom are proficient in road safety. Editorials and informational pieces were written by editorial staff or national experts, often with experience covering public policy. Reports on crashes and pedestrian injuries were more commonly written by on-the-ground reporters, with little formal background in injury prevention.
Conclusion
First, the study established that the Standard newspaper and Daily Nation newspaper do not give priority to RTA issues. Most of the articles on RTAs were buried in the inside pages of the newspaper. Even in those pages where they are tucked in, they still have no prominence because they are placed as either third lead stories or as briefs. This means that media interests do not prioritize RTAs because as Altschull (1997) noted, “the content of the news media inevitably reflects the interests of those who pay the bills” (p. 259). With too many media outlets, it is the media owners who pay the bill to profit from their other business interests in the wider economic sector.
Second, the above factor could be related to the fact that media organizations are also becoming more business orientated (Kirk, 2006) and the search for profit has impacted on the more costly forms of journalism such as investigative reporting with a significant decline in this area. The impact of the Internet as an information source and the emergence of other forms of information technology, such as mobile phones, where images and voice “grabs” can be captured by anyone, published on the Internet or sent to media outlets, is impacting on the use of print media for road safety messaging.
Third, the study also established that the focus of articles was directed at reporting on accidents than on issues on policy and educating the public. Marsh (1991) observed that news values related to impact, proximity, prominence, relevance, and human interest are all important in determining how much significance a news story is accorded by a particular media. In the case of RTAs, journalists and reporters tend to favor stories with perceived high magnitude and consequences in terms of deaths and serious injuries. This was confirmed by this study where only stories on fatal crashes were carried as lead stories on their pages or lead stories for the newspaper. In addition, the media primed RTAs when and if the government intervened by introducing tough regulations or guidelines to curb road carnage. For example, from the study, the highest coverage for RTAs came during the month of January because the stringent road use regulations were introduced in late 2013: Daily Nation had 39% of its stories in January and the Standard had 23%, which were the highest of all months for both newspapers.
This scenario explains why a majority of newspaper reports used episodic framing. The majority of reports included information on the type of crash, but characteristics about people and vehicles were rarely reported. There were four times as many motor vehicle crashes reported as pedestrian injuries. This fits into what communication experts argued that the news media’s focus on stories of individual suffering and struggle had resulted in the public blaming individuals for their health problems as opposed to holding society, government, or other institutions responsible when appropriate.
However, as Chartier and Gabler (2001) noted, journalists are not educators or, at least, that is not their primary role. From this perspective, it is not surprising that media coverage seldom results in more than cursory coverage of an issue, contributing little if anything to the more complicated process of working through the problems. According to Yankelovich (1991), news coverage that presents positions as adversarial often actually retards progress toward dealing meaningfully with issues.
In conclusion, this article asserts that the Kenyan print media can play an important role in promoting safety on Kenyan roads. Increasing the media’s role in highlighting RTAs could be accomplished by improving dialogue between public health and media practitioners, as well as by considering specific measures. Therefore, media could play a greater role in putting the government to account by priming RTA information so that they act as the public education forum on RTAs. This can be further enhanced with the use of more photographs. In addition, the print media in Kenya should publish more articles on policy as opposed to focusing on road carnage incidents only.
Footnotes
Declaration of Conflicting Interests
The author(s) declared no potential conflicts of interest with respect to the research, authorship, and/or publication of this article.
Funding
The author(s) received no financial support for the research and/or authorship of this article.