
Abstract
This research highlights the influence of political context upon the measurement of postmaterial value orientations. Drawing upon a variety of international survey data, Inglehart claims that since World War II a shift has occurred in advanced industrialized nations from material toward postmaterial values. However, cross-sectional data from Australian Election Study surveys collected over more than two decades indicate that atypically for an advanced democracy, Australian value orientations tend toward the materialist pole. Australian Election Study values estimates are also at odds with those from other national social surveys that portray Australia as a far more postmaterialist nation. Regression analysis demonstrates that after controlling for election issues, attitudes toward political leaders, political party identification, and social background, predicted values estimates are substantially more postmaterial than the raw estimates. The findings have international implications as they suggest that measuring values during or soon after election campaigns may affect the measurement of postmaterial value orientations.
Keywords
Introduction
This research shows that postelection surveys are a problematic source for measuring value orientations, as national elections influence (in Australia suppress) the estimation of postmaterial values. What I refer to here as “political contextual” effects such as national election issues and the influence of party leaders in championing or rejecting political issues at an election (action on climate change is a contemporary example) may have implications for the measurement of postmaterial values. I contend that lengthy national election campaigns in countries such as Australia and the United States may produce the equivalent of what Inglehart refers to as “period effects” (Inglehart, 1981, 1997; Inglehart & Welzel, 2005), and influence the estimation of postmaterial values.
Ronald Inglehart’s thesis of the “Silent Revolution” of value change is one of the most influential claims in political science in more than 40 years. Inglehart (1971, 1977, 1990, 1997; Inglehart & Welzel, 2005) argues that the value priorities of citizens (i.e., their “broad societal goals”) in advanced industrialized countries have been shifting since the end of World War II, from concern over the economy and physical security (“materialism”) toward an emphasis upon quality of life (“postmaterialism”). Inglehart’s thesis is based upon two hypotheses related to the concepts of scarcity and socialization.
Inglehart (1997) claims “[A]n individual’s priorities reflect the socioeconomic environment: one places the greatest subjective value on those things that are in relatively short supply” (p. 33). Influenced by Maslow’s needs hierarchy (Inglehart, 1977), Inglehart (1997) argues that to survive, people must first have their basic material needs satisfied, such as food, shelter, and physical safety. When basic materialist needs have been satisfied and material security is achieved, people are free to explore higher order needs, such as improving their quality of life. Citizens of affluent countries are increasingly likely to pursue higher order goals leading “to a gradual shift in which needs for belonging, esteem, and intellectual aesthetic satisfaction became more prominent” (p. 34). In Inglehart’s terminology, citizens of affluent nations have become more “postmaterialist.” The socialization element of Inglehart’s thesis suggests that those born in advanced industrialized nations after World War II have grown up under relatively affluent conditions compared with their parents and grandparents. On average, postwar generations are claimed to be far more postmaterialist than their predecessors. This trend toward postmaterialism has continued (Inglehart & Welzel, 2005), so that since the end of the World War II, citizens of advanced industrialized countries have become increasingly postmaterialist.
These patterns are tendencies, as large proportions of citizens are classified as “materialists” by Inglehart, but typically, younger cohorts in advanced democracies are more postmaterial than their older counterparts, with the proportion of postmaterialists increasing over time (Inglehart, 1997; Inglehart & Welzel, 2005). Inglehart does not claim that postmaterialists are non-materialistic or that they are not concerned about physical security or the economy (Inglehart, 1997). Rather, with their material needs reasonably satisfied, they are free to pursue postmaterial goals, such as supporting environmental protection, human, women’s, and minority rights.
Measuring Value Orientations
Inglehart measures value orientations using two batteries of survey questions. The first is referred to as the “four-item index” or “short values index” consisting of questions that ask respondents to prioritize four items. The short values index is used extensively by survey researchers, for example, in the World Values Surveys (WVS), the International Social Science Program (ISSP) surveys, and the Australian Election Study (AES) surveys. 1
Critics of Inglehart often take issue with the way he measures value orientations, commonly attacking the validity of the materialism–postmaterialism index (e.g., Bean & Papadakis, 1994; Brown & Carmines, 1995; Clarke, 2000; Clarke & Dutt, 1991; Clarke, Dutt, & Rapkin, 1997; Clarke, Kornberg, McIntyre, Bauer-Kaase, & Kaase, 1999; D. W. Davis & Davenport, 1999; Duch & Taylor, 1993, 1994; Flanagan, 1982a, 1982b, 1987; Jagodzinski, 1982). For example, Clarke and Dutt (1991) find high unemployment is associated with increased levels of postmaterial values, rather than decreases as the values change thesis predicts. Duch and Taylor (1993) argue that the short values index measures pro-democratic orientations, whereas Warwick (1998) finds “that the original index registers support for democratic principals in particular, and not simply a more general postmaterialism” (p. 603). More recently, Clarke (2000) maintains the short index is a “seriously flawed instrument for measuring values and value change in advanced industrial (and other) societies” because of its “sensitivity to prevailing economic conditions” (p. 481), whereas Tranter and Western (2010) suggest the short index is subject to question order effects that influence estimates of values orientations.
Nevertheless, Inglehart and his colleagues have defended the value shift thesis vigorously (e.g., Abramson, Ellis, & Inglehart, 1997; Abramson & Inglehart, 1994, 1995; Inglehart, 1997; Inglehart & Abramson, 1994, 1999). Inglehart (1997) maintains the short index “has proven to be a very useful indicator of values” (p. 154) since 1970, whereas Inglehart and Abramson (1994) contend that on “the usual tests of validity” the index “has performed remarkably well” and the “dimensional structure of the measure . . . has a theoretically coherent structure across a wide range of countries” (p. 350). 2
Research Aims
This research is not a critique of Inglehart’s values change thesis per se, but attempts to show that estimations of postmaterial values based upon Inglehart’s widely applied short values index are subject to the influence of political events. The point of departure here is not in attacking the conceptualization or measurement of postmaterialist value orientations, but examining how Inglehart’s values measures are influenced by important political issues and leader effects that are present around national elections. I contend that “political context” must be accounted for, because, as Inglehart (1981) suggests, “Period effects” (p. 887)—short-term influences on values such as variations in the inflation and unemployment rates—influence the measurement of value orientations. Period effects may suppress, or alternatively, boost levels of societal postmaterial values at particular times, but according to Inglehart do not influence the underlying values formed during early socialization.
The posited effect examined here arises because of the way in which value orientations are measured. Arguably, all four items in the short index (see Appendix A), both the materialist items “maintain order in the nation” and “fight rising prices,” and the postmaterialist items “give people more say in important government decisions” and “protect freedom of speech,” are likely to be influenced during election campaigns. The “maintain order” item relates to bread and butter political issues and national and state security. Although security issues are frequently of concern to governments, they have become even more salient in recent years with the so-called “war on terrorism.” Similarly, border security is a highly publicized issue in many affluent countries faced with increasing numbers of refugees seeking asylum, such as Australia. Inglehart’s “rising prices” item is clearly associated with inflation, but perhaps also more broadly with economic management.
Importantly, all of Inglehart’s question items tap perennial political concerns. However, such concerns are increasingly important and visible, even to less politically engaged citizens, during national election campaigns when the voting public is bombarded with mass media coverage of salient political issues. For example, in recent federal election campaigns in Australia, election issues included border security (e.g., “turn back the boats”) and economic management/climate change issues (e.g., “stop the carbon tax”; Bean, McAllister, & Pietsch, 2014). Responses to relevant items on the values index are therefore very likely to be influenced during national elections.
The main aims of this research can be summarized in the following research questions:
Data and Method
Data analyzed here are from the AES surveys from 1990 to 2013 (Bean, Gow, & McAllister, 1998; Bean, McAllister, Gibson, & Gow, 2005; Bean, McAllister, & Gow, 2002; Bean, McAllister, Gow, & Gibson, 2008; Bean et al., 2014; Jones, Denemark, & Gow, 1993; Jones, McAllister, & Gow, 1990, 1996; McAllister, Bean, Pietsch, & Gibson, 2011; Bean, McAllister and Pietsch 2014). These data are systematically sampled from the Australian Electoral Roll, a list of all Australians registered to vote in federal elections. AES surveys are administered via mail with several follow-up strategies to maximize responses. Further details of these surveys, including response rates, are available at the AES site (http://aes.anu.edu.au/).
As mentioned above, Inglehart (1977, 1997) commonly measures postmaterial values with a four-item question, where respondents are asked to prioritize the two most important aims of the nation. The values questions as they appear in the AES are shown in Appendix A. In the WVS, the short index items appear as the second set of questions in a longer values battery. In the AES, the longer values battery is administered on occasion, however, in such cases the short index items appear first, in contrast to the WVS. This is a preferable form of administering these questions, because as Tranter and Western (2010) have shown, a question order effect arises that tends to inflate levels of postmaterial values when the short index questions appear in the middle of the longer values battery.
Ordinary least squares (OLS) regression is used in the analyses below, following Abramson et al. (1997). Primarily OLS is used here for ease of comparison of the results. The strategy in the tables containing regression estimates below is to first present what Inglehart (1997) refers to as the “materialist-postmaterialist percentage difference index” (PDI; p. 134) for various years. Several controls are then introduced to adjust for aspects of social background—age (years), 3 sex (1 = men), and education level (1 = degree) and the impact of political context. 4 The rationale for the latter is described in detail in the next section.
Technically, the intercept from the OLS regression models is analogous to the PDI. That is, the multiple regression models estimate the PDI for each AES survey from 1990 to 2013, where the PDI-dependent variable is regressed upon several independent variables to adjust for political context at each federal election. PDI estimates from four regression models are presented in Table 4 to show the adjusted PDI, after controlling for social background (Model 1), political issues (Model 2), leader thermometers (Model 3), and political party ID (Model 4). 5
Election Issues, Party Leaders, Party ID, and Political Context
Measuring postmaterial values with data from election surveys is potentially problematic when values are measured with the short values index. That is, the issues discussed during election campaigns may influence responses to the values index, because the issues that typically emerge during election campaigns tend to be associated with the items comprising Inglehart’s short index. For example, economic issues almost always tend to be high on the agenda of political parties in advanced industrialized nations. In Australia (and elsewhere), border security has in the last decade or so been an issue of contention for the major parties, both under the conservative party leadership of current Prime Minister Tony Abbott and John Howard before him (Devetak, 2004; Noble, 2005) and also under recent Labor governments led by Julia Gillard and Kevin Rudd. Economic and security issues should be associated with “materialist” values, as measured by Inglehart’s “maintain order in the nation” and “fight rising prices” items.
Although the relative salience of election issues varies from one election to the next, several issues have been important during campaigns in the period under consideration here (1990-2013). Data on these issues have been collected in the AES during this period, with economic management, and health and education the most important in recent elections. The importance of taxation and (un)employment vary according to prevailing economic circumstances while the environment (and more recently, global warming) has also been a relatively important issue in recent years. For example, during the “green” election of 1990 (Bean, McAllister, & Warhurst, 1990), the 1990 AES indicates that 29% of those sampled chose interest rates as the issue of greatest concern, 18% inflation, and 11% selected the environment, taxation, and unemployment, respectively, whereas only 9% selected health and 5% education in 1990. More than 20 years later, data from the 2013 AES suggest that 25% of the sample chose management of the economy as the most important issue, followed by 17% who opted for health and Medicare and 14% for education.
Although I am not able to offer a control/test experimental design to examine the hypothesis that political context influences responses on the short values index, another way of examining this hypothesized effect is to consider associations between political issues and postmaterialism using data from the most recent AES. A cross tabulation is presented using data from the 2013 AES (Table 1). Based upon responses to the question “Which of these issues was most important to you during the election campaign?” it is apparent that “materialists” tend to prioritize economic issues (i.e., taxation, management of the economy), whereas postmaterialists are more concerned with issues such as the environment, global warming, and education. However, because election issues tend to vary over time, as does the relative salience of perennial issues, the election issue questions included in each AES also vary, making consistent operationalization of election issues problematic over time. 6 The small number of relevant election issue question items available for analysis across all elections analyzed means that some measures of political context are missed. I therefore also examine the influence of three proxy variables of political context based upon voter evaluations of major party leaders and political party identification.
Percentage Difference Index and Most Important Federal Election Issues (%).
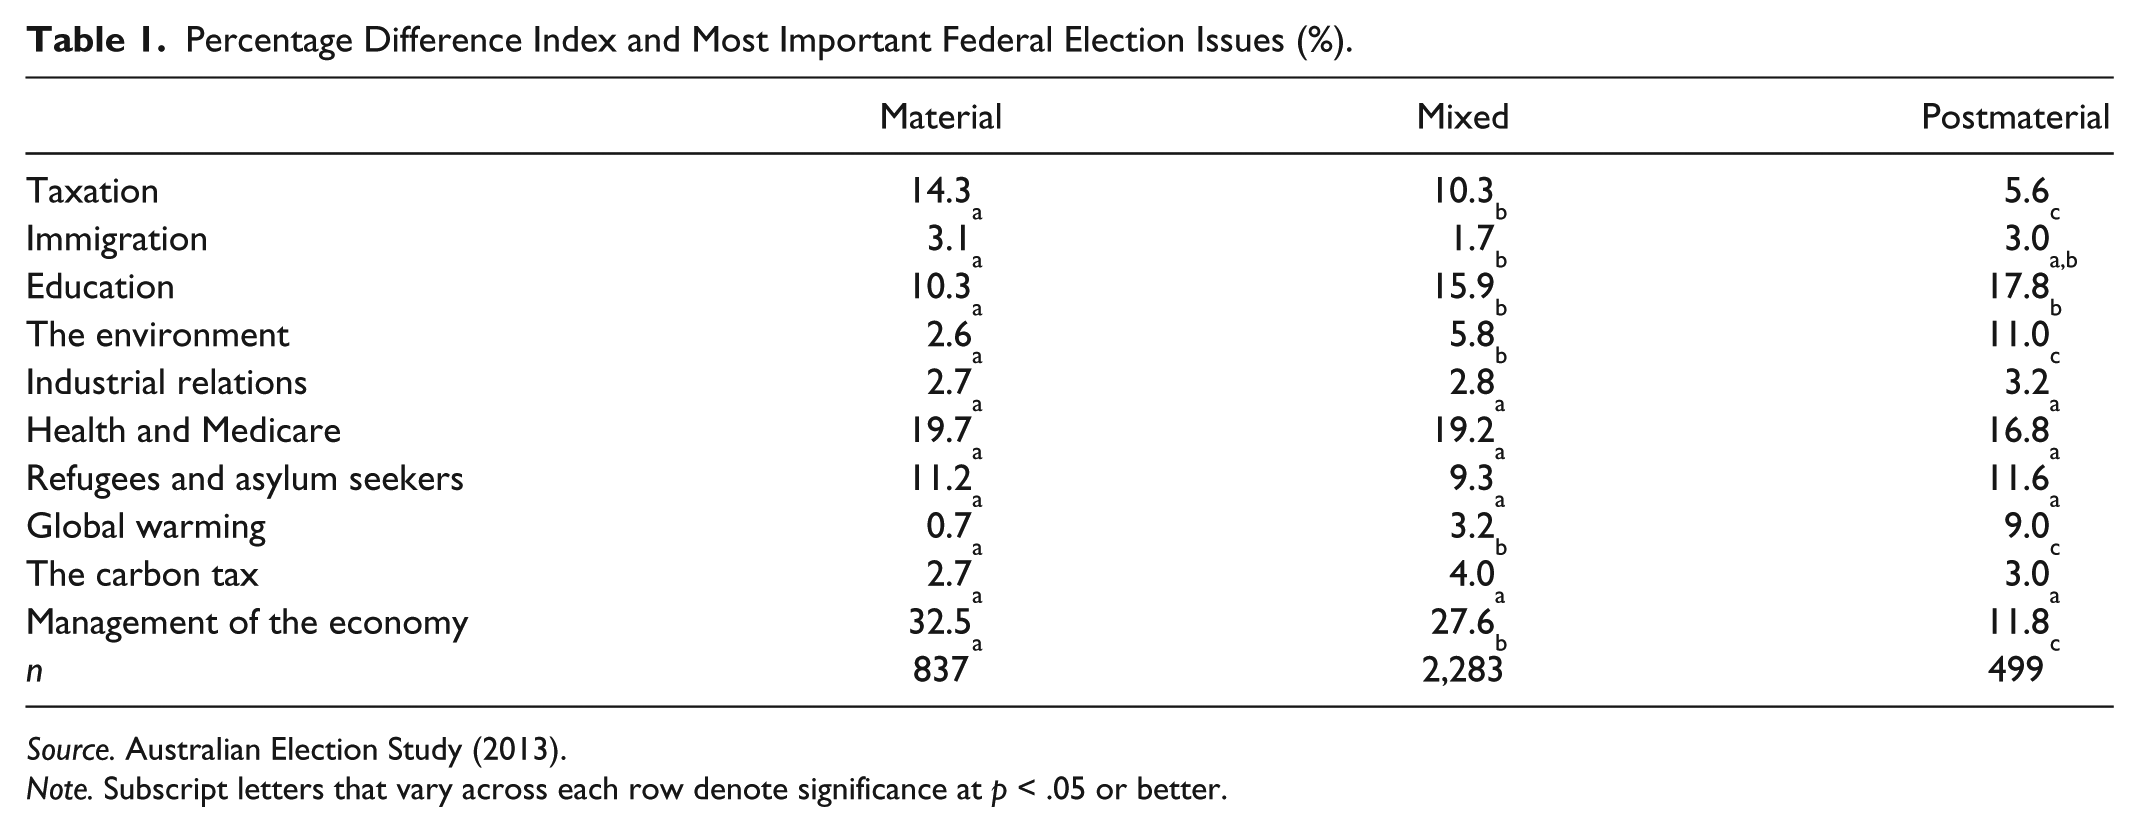
Source. Australian Election Study (2013).
Note. Subscript letters that vary across each row denote significance at p < .05 or better.
As the literature on political party identification indicates, political leaders offer voters cues about complex political issues. Party identification is claimed to form a “perceptual screen through which the individual tends to see what is favourable to his partisan orientation” (Campbell, Converse, Miller, & Stokes, 1960, p. 133). Although the partisan dealignment thesis suggests there has been a weakening of partisan loyalties (Dalton, 1996; Dalton, Flanagan, & Beck, 1984), partisanship remains a powerful predictor of voting in many countries (Bartels, 2000; Miller & Shanks, 1996), with Gilens and Murakawa (2002) arguing that partisans take the cues of political leaders more frequently than engage in “substantive assessment of competing evidence and arguments” (p. 21). In Australia, although the major parties both vie for public acceptance as stewards of the economy, AES data suggest the conservative coalition partners tend to have greater public acceptance in terms of their credibility on economic management. Labor has historically been associated with stronger policies on health, education, and industrial relations, and, along with the Australian Greens (although to a lesser extent) with the environment. I contend that feelings thermometer variables that measure voter evaluations of political party leaders, to an extent also capture variations in the political issues that are prioritized from one election to the next. In addition to the four issue priority variables, the political leader variables act as supplementary measures of political context at each federal election.
The AES presents a variety of possibilities for measuring voter evaluations of respective political leaders. Questions have been included in all AES from 1990 onwards regarding the qualities of the Prime Minister and the Leader of the Opposition (and on occasions, other political leaders). Such questions ask respondents to rate leader qualities such as their honesty, intelligence, strength of leadership, knowledge, trustworthiness, competence, and so on. However, these questions have not been asked in a consistent manner over time, so that only relatively few comparable items appear in all AES from 1990 to 2013. Alternatively, “feelings thermometer” questions have appeared in every election survey from 1990 onwards. For example, the “feelings thermometer” questions from 1990 ask, We would like to know your feelings about the party leaders. Please show how you feel about them by circling a number from 0 to 10. 10 is the highest rating, for people you feel very favorable about, and 0 is the lowest rating, for people you feel very unfavorable about. If you are neutral about a particular person or don’t know much about them, you should give them a rating of 5. How do you feel about: Bob Hawke? How do you feel about: Andrew Peacock?
For analytical consistency, the feelings thermometer variables are operationalized to measure the impact of political leaders upon value orientations at each federal election. Although these questions ask what voters “feel” about the major party leaders and do not capture the multidimensionality of leadership qualities, they serve as a useful proxy variable to capture voter evaluations of leaders. Evidence of this is apparent in the high correlations between multiple item composite leader scales constructed from various leader quality items and the single item 0 to 10 scales. For example, composite scales constructed from items measuring Labor and Coalition leader characteristics using 2010 AES data have strong Pearson’s correlations with the party leader thermometers (i.e., the Pearson’s r for the coalition leader variable is .76 and Labor leader is .78). 7 Feelings thermometer variables for the Prime Minister and Leader of the Opposition at each federal election are therefore used as an additional measure of political context in the analyses that follow. This approach has the advantage of applying consistent indicators to capture the influence upon value orientation estimates of the two most important major party leaders at each federal election.
Similarly, it is important to add political party identification as a control for “rusted on” partisans who may be aligned with particular election issues. Party identification is operationalized as Liberal and National party supporters scored 1; other parties and the non-aligned scored 2 and Labor identifiers scored 3. Placing the Australian Greens at the midpoint of the party ID scale given they are a party of the postmaterial left (Charnock & Ellis 2004; Western & Tranter, 2001) is potentially problematic here. The Greens formed as a national party in 1992. However, while a “Greens” party ID response category was included in the 1990 AES, it was omitted in 1993, although the number of respondents identifying as Greens continued to be very low throughout the 1990s. Therefore, once again for consistency, Green identifiers are coded to the midpoint of the party ID scale.
Analyses
Table 2 shows the percentage responses for materialists, postmaterialists, and those who hold mixed values based upon AES data from 1990 to 2013. Inglehart’s (1997) PDI is calculated to gauge the relative levels of postmaterial versus material values. Positive PDI results suggest that the proportion of postmaterialists is greater than the proportion of materialists in a given election year, with negative PDI indicating a preponderance of materialists over postmaterialists.
Value Orientations for Australia: 1990 to 2013 (%).
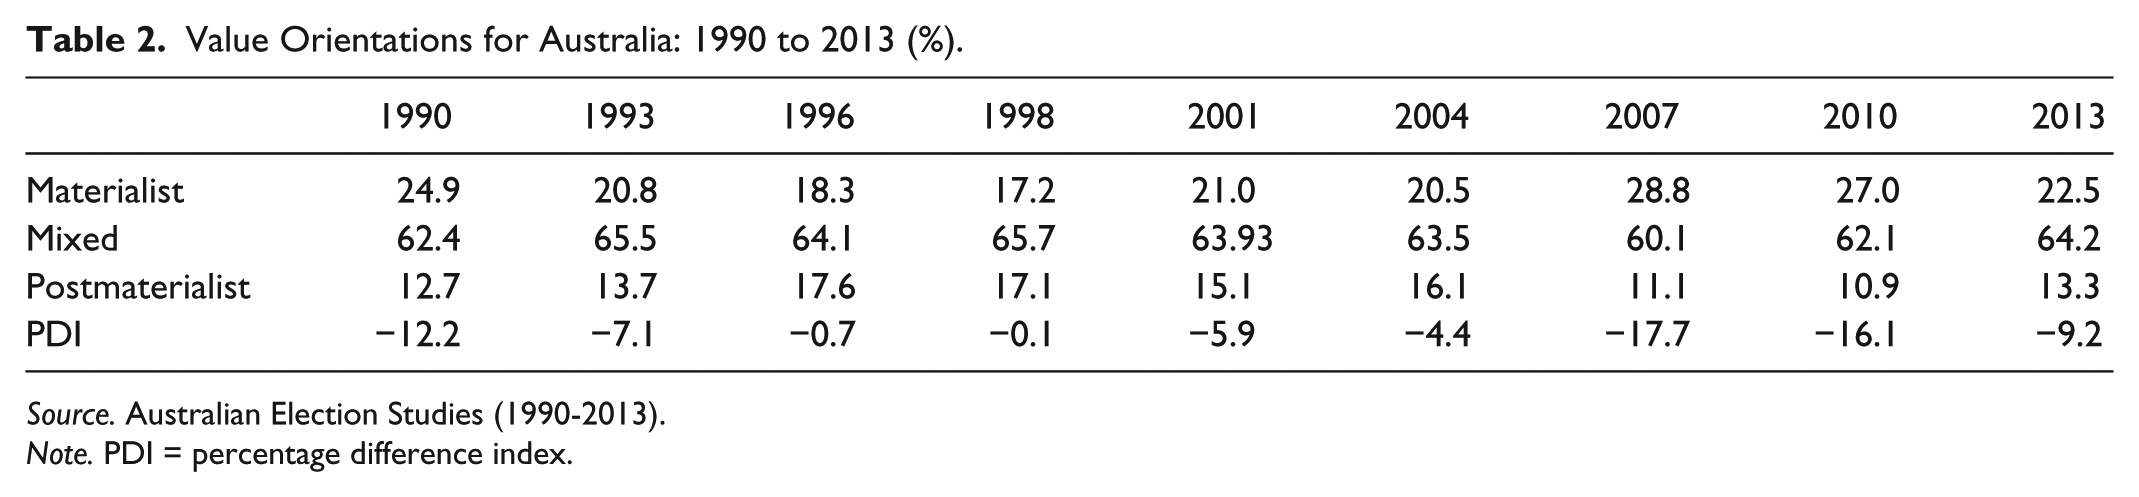
Source. Australian Election Studies (1990-2013).
Note. PDI = percentage difference index.
According to these results, Australia is not and has never been a “postmaterialist” country during the period examined here. The negative PDI of −12.2 for 1990 suggests that Australia was quite a materialist country around 20 years ago, although became less so throughout the 1990s. In 1996 and 1998, the proportions of materialists and postmaterialists were evenly balanced. However, in the new millennium, the results indicate that Australia has been shifting back to the materialist pole, so that in 2007 and 2010 it was even more materialist than two decades earlier.
These results are not necessarily contrary to what is expected according to Inglehart’s thesis. Inglehart allows for fluctuations in value priorities due to changing economic circumstances (e.g., increases to inflation rates) that he refers to as “period effects,” and claims that these may have a short-term impact upon the PDI. Yet he argues that serious social and economic events such as major wars or economic depression (or their lack) shape the value orientations of generations, particularly during their “formative years.” Furthermore, the values change thesis implies that younger people tend to become more materialist than their parents if they experience severe long-term economic downturns or threats to their physical security during their formative years. However, neither of these scenarios appears to explain the Australian case.
Australia, with its strong economy and having arguably benefitted from the economic stimulus package introduced by the Rudd Government, has enjoyed relatively favorable economic circumstances since the recession of the early 1990s and appears to have been relatively insulated from the global financial crisis (GFC). Although these results indicate that the GFC has had an impact upon PDI in Australia, reflected in the 2007 and 2010 estimates, the move back toward materialism appears to have begun even earlier, as is apparent in the dips toward the materialist pole in 2001 and 2004 compared with 1998. Although the country could be classified as most materialist in 2007 and 2010, it remains a materialist country in 2013.
However, other national survey data suggest that Australia is a far more postmaterialist country than the AES data indicate (Table 3). With the exception of the 2011 WVS data that also likely reflect “period effects” due to the GFC, other earlier WVS, AuSSA, and ISSP data suggest Australia tends toward the postmaterialist pole. Nevertheless, the anomalous values estimates from the 1994 ISSP and 1995 WVS require comment. The former appears to under-represent materialists and over-represent mixed values compared with other surveys in this series, resulting in a slight postmaterialist PDI for 1994. While the 1994 ISSP was also a mail out survey, unlike other surveys in Table 3, the 1994 ISSP sample comprises a panel from an earlier ISSP survey (Kelley, Evans, & Bean, 1995), so panel attrition may have had an impact upon the values estimates for 1994. 8 There may also be sampling and other issues underlying the extreme postmaterial estimates for the 1995 WVS. The 1995 WVS values questions were administered as part of the longer values index, and as mentioned above, Tranter and Western (2010) find that this approach inflates levels of postmaterial relative to material values estimates. The sampling approach used for the WVS is also potentially influential here. 9 It is therefore possible that question ordering effects and different sampling strategies have contributed to the anomalous values results for the 1995 WVS compared with other surveys in Table 3.
Value Orientations for Australia: 1990 to 2013 (%).

Source. Australian Election Studies (AES); International Social Science Program (ISSP; 1994); World Values Surveys (WVS; 1995, 2005, 2011); Australian Survey of Social Attitudes (AuSSA; 2003).
Note. PDI is the percentage of postmaterialists minus percentage of materialists calculated from 4-item index. Missing responses coded to the “Mixed” category. PDI = percentage difference index.
Nevertheless, data from the AES are at odds with those from other national surveys that use similar mail out designs and sampling frames (i.e., AES and AuSSA samples are both drawn from the Australian Electoral Roll using systematic sampling). What is clearly different is that the AES are postelection surveys, and responses to the short values index appear to have been influenced by election campaigns.
To what extent, then, do election issue priorities and leader variables influence the PDI in the multivariate case, that is, after controlling for known correlates of value orientations, respondent sex, age, and educational achievement? PDI for each election from 1990 onwards are presented in Table 4. The results of four OLS regression models for each year are also presented. The first model shows PDI after controlling for sex (men 1, women 0), age (measured as a continuous variable in years), and degree (1/0). The second model adds the four issue priority dummy variables, the third model adds 0 to 10 major party leader “feeling thermometers,” and the fourth political party identification scale in combination are included to adjust PDI for political context. The results in Table 4 indicate that the background variables in Model 1 have some impact upon the PDI, swaying the PDI considerably toward postmaterialism in some years, such as 2004, but only minimally in others such as 1996. The introduction of political issues variables in Model 2 tends to shift the PDI back toward the materialist pole, although the shift in some cases is modest. However, when the leader thermometer variables are added to the regression equation in Model 3, the regression estimates of PDI are far less materialist than the original PDI. 10 In fact after controlling for the proxy measures of political context—political issues and leader effects—the adjusted PDI for Australia becomes positive in six of the nine election years analyzed, compared with the original estimates that were all negative. Overall, this pattern persists after party identification is added (Model 4).
Political Context and Percentage Difference Index (OLS).
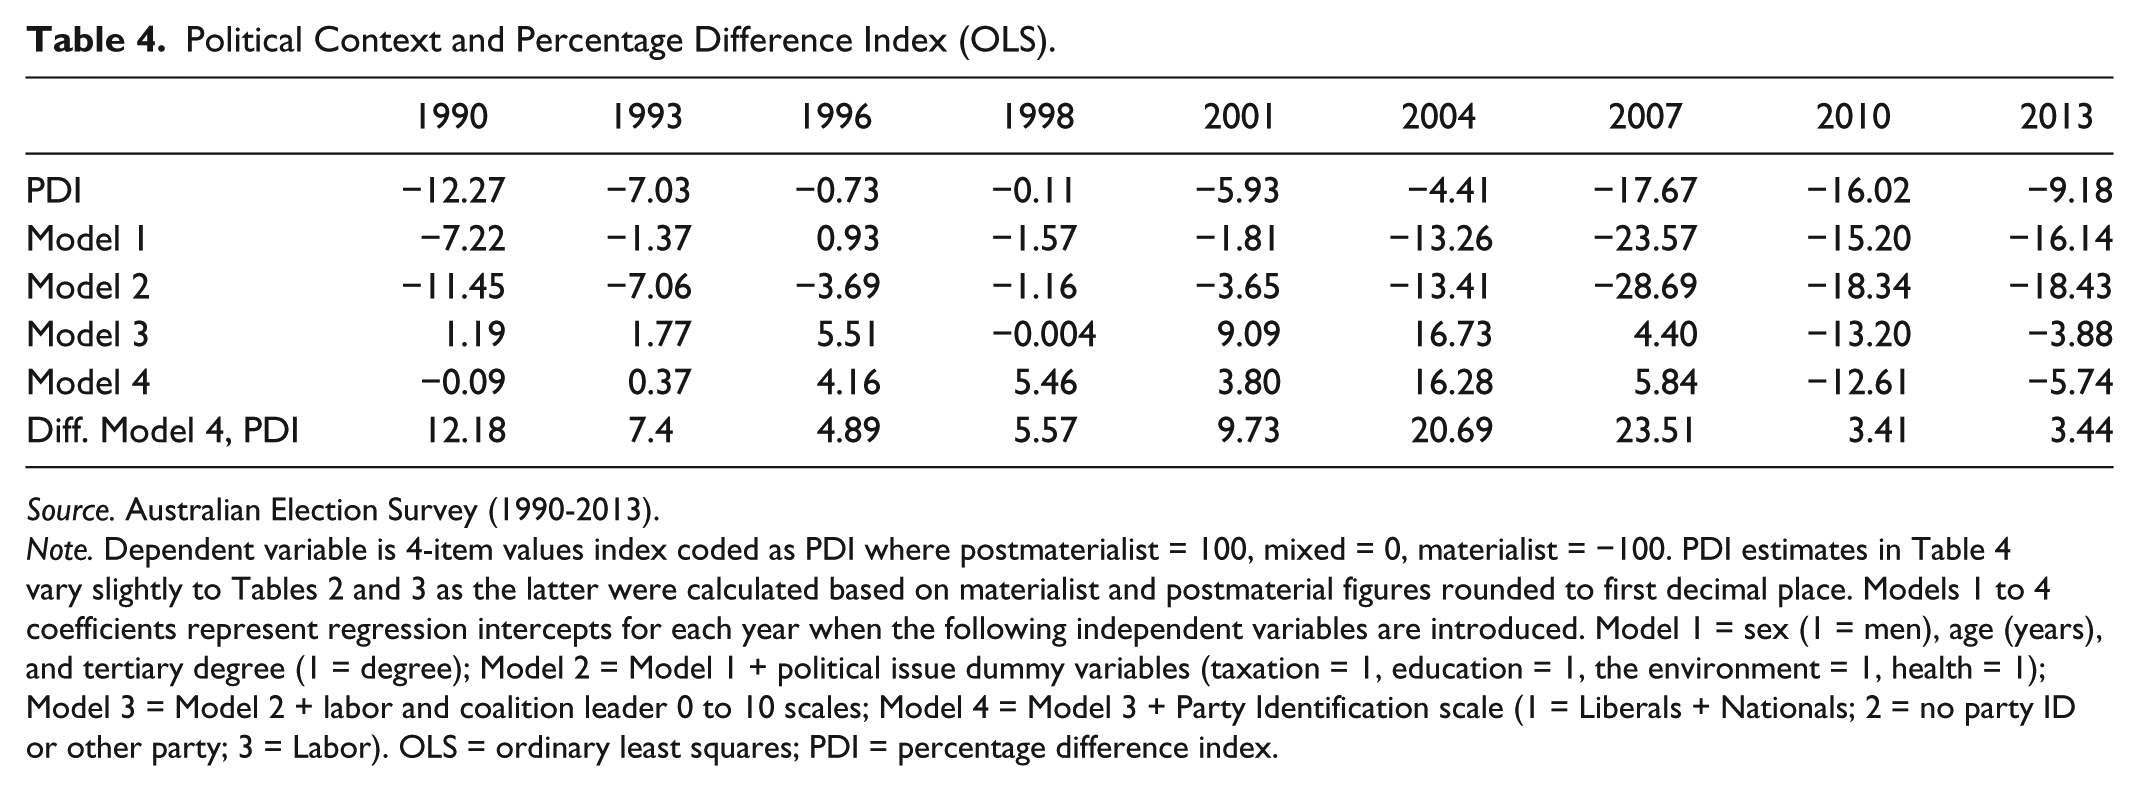
Source. Australian Election Survey (1990-2013).
Note. Dependent variable is 4-item values index coded as PDI where postmaterialist = 100, mixed = 0, materialist = −100. PDI estimates in Table 4 vary slightly to Tables 2 and 3 as the latter were calculated based on materialist and postmaterial figures rounded to first decimal place. Models 1 to 4 coefficients represent regression intercepts for each year when the following independent variables are introduced. Model 1 = sex (1 = men), age (years), and tertiary degree (1 = degree); Model 2 = Model 1 + political issue dummy variables (taxation = 1, education = 1, the environment = 1, health = 1); Model 3 = Model 2 + labor and coalition leader 0 to 10 scales; Model 4 = Model 3 + Party Identification scale (1 = Liberals + Nationals; 2 = no party ID or other party; 3 = Labor). OLS = ordinary least squares; PDI = percentage difference index.
The regression results suggest that political context does indeed influence the measurement of value orientations as measured with Inglehart’s short values index. In the Australian case, for all the election surveys the PDI becomes less materialist when political context is controlled, implying that the measurement of value orientations during or soon after election campaigns is potentially problematic. The influence of political context upon value orientations is more clearly demonstrated in Figure 1, where the PDI and adjusted PDI are portrayed graphically over time.

PDI and PDI adjusted for Election Issues, Leader ‘thermometers’, Age, Sex and Degree.
Discussion
AES data collected between 1990 and 2013 indicate that the postmaterialist difference index does not rise above zero during these years, suggesting Australia is relatively “materialist” for an advanced industrialized country. As Inglehart acknowledges (e.g., Inglehart, 1997; Inglehart & Welzel, 2005), the measurement of postmaterial values is influenced by “period effects.” Although generational replacement is claimed to account for intergenerational shifts in value orientations at the national level, Inglehart (1997) maintains, [I]ntergenerational population replacement is not the only factor involved: period effects, reflecting current conditions, also have an impact—but the direction of their impact is predictable . . . a major decline in the economic and physical security experienced by a given society would tend to retard or reverse the effects of intergenerational population replacement, and periods of exceptional prosperity would tend to magnify the effects of generational change. (p. 332)
The evidence from nine national election surveys from Australia suggests that measuring postmaterial values using postelection surveys influences the measurement of postmaterial values, in a similar manner to the “period effects” described by Inglehart. The influence of national elections upon values is analogous to period effects because many of the issues raised by political leaders during campaigns and promulgated by communications media are associated with, and influence responses to, items on the short values index. In a sense this phenomenon is not surprising, as the materialist items “maintain order in the nation” and “fight rising prices,” and the postmaterialist items “protect freedom of speech” and “give people more say in government decisions” could well have been designed with election slogans in mind.
Tranter and Western (2009) find higher levels of postmaterial values in polities with multiple parties, particularly where green parties had gained national parliamentary representation. This research also emphasizes the impact of political contextual factors, showing that the timing of survey administration also influences estimates of postmaterial values. The evidence from Australia suggests that measuring value orientations using postelection surveys tends to suppress the postmaterial difference index toward the materialist pole. This is demonstrated indirectly by comparing values estimates from the AES surveys with those from other reputable national surveys that were not administered during federal election years, and also by statistically adjusting the postmaterial difference index to control for political issues and major party leader effects. Australia appears to be a “postmaterialist country” based upon data from the WVS or the Australian Survey of Social Attitudes, but is far more “materialist” based upon AES data. Yet when important political variables are controlled, Australia is located on the postmaterial end of the values continuum in six of the nine election surveys analyzed here, closer to where Inglehart’s thesis predicts an advanced industrialized country should be situated. While contentious, Inglehart’s short values index is a useful predictor of social and political attitudes and behavior, although for estimating value orientations in a cross-national context, this research questions the comparability of values data from the AES.
Although this research is based upon Australian data, it has broader, implications for the study of value change over time and cross-nationally. This study demonstrates the influence of political factors upon the measurement of postmaterial values in an advanced industrialized nation, but also raises questions for further research. The short values index is sensitive to economic and social issues—economic recessions, high inflation and unemployment, or social upheavals—so-called “period effects” (e.g., Inglehart, 1997; Inglehart & Welzel, 2005). Yet it seems that salient political issues, such as economic management, border security, perceived threats of international terrorism, or politically divisive issues such as climate change (e.g., see McCright & Dunlap, 2011; Poortinga, Spence, Whitmarsh, Capstick, & Pidgeon, 2011; Tranter, 2011) and the leaders that champion such issues, also influence the measurement of postmaterial values. Although formal election campaigns may be relatively brief, in countries such as the United States, congressional campaigning is lengthy (Panagopoulos, 2013) and campaign duration appears to be lengthening in countries such as Australia. Long election campaigns should therefore be considered as having the potential to impact upon the measurement of postmaterial values. In light of this research, the accuracy of postmaterial values estimates would be enhanced by statistically controlling for political contextual effects where possible, or avoiding the measurement of value orientations during or soon after national election campaigns.
Footnotes
Appendix A
Appendix B
Percentage Difference Index, Election Issues, and “Feelings Thermometers” (Pearson’s r).
| 1990 | 1993 | 1996 | 1998 | 2001 | 2004 | 2007 | 2010 | 2013 | |
|---|---|---|---|---|---|---|---|---|---|
| Taxation | −.06 | −.01 | −.06 | −.07 | −.09 | −.15 | −.12 | −.08 | −.11 |
| Health | .02 | .02 | .06 | .03 | .001 | −.01 | .03 | .004 | .0002 |
| Education | .04 | .06 | .06 | .07 | .06 | .07 | .07 | .18 | .07 |
| Environment | .11 | .09 | .13 | .06 | .11 | .15 | .16 | .15 | .17 |
| Labor | −.04 | .06 | .08 | .11 | .11 | .17 | .08 | .13 | .03 |
| Coalition | −.07 | −.11 | −.13 | −.15 | −.22 | −.33 | −.27 | −.20 | −.20 |
| Party ID | .03 | .08 | .10 | .08 | .17 | .22 | .15 | .13 | .14 |
| Labor leader | Hawke | Keating | Keating | Beazley | Beazley | Latham | Rudd | Gillard | Rudd |
| Coalition leader | Peacock | Hewson | Howard | Howard | Howard | Howard | Howard | Abbott | Abbott |

Source. Australian Election Studies (1990-2013).
Note. Four-item values index coded as PDI where postmaterialist = 100, mixed = 0, materialist = −100. “Which of these issues was most important to you during the election campaign?” (taxation, education, the environment, health and Medicare, each scored 1/0). Labor and coalition “feeling thermometer” 0 to 10 scale, political party identification (1 = Liberals or Nationals; 2 = other party or no party identification; 3 = Labor party).
Appendix C
Political Context and Postmaterial Difference Index Model 4 by year (OLS).
| 1990 | 1993 | 1996 | 1998 | 2001 | 2004 | 2007 | 2010 | 2013 | |
|---|---|---|---|---|---|---|---|---|---|
| Men | 0.6 | 0.3 | −0.2 | 0.4 | 1.4 | −3.8 | 0.1 | 0.4 | 2.1 |
| Age (years) | −0.09 | −0.07 | 0.007 | 0.08 | −0.02 | 0.24** | 0.06 | 0.006 | 0.19** |
| Degree | 18.6** | 10.7** | 2.4 | 7.1* | 6.0 | 12.7** | 16.7** | 5.6 | 0.8 |
| Election issues | |||||||||
| Taxation | −10.0** | −0.8 | −11.0** | −9.9** | −11.9** | −12.5** | −10.3** | −8.4** | −12.1** |
| Education | 1.3 | 3.2 | 1.2 | 8.6** | 3.2 | 4.5 | 2.2 | −3.8 | 6.0** |
| Environment | 11.3** | 10.3** | 14.7** | 3.5 | 11.4** | 12.0** | 13.3** | 15.9** | 13.4** |
| Health | 3.0 | −5.0 | 4.1 | −0.9 | −7.0* | −8.3* | −1.1 | 2.5 | −5.3* |
| Thermometers | |||||||||
| Labor | −1.65** | −0.12 | −0.10 | 1.76** | 0.52 | −0.39 | −1.67** | 0.72 | −1.05** |
| Coalition | −1.19* | −1.64** | −1.90** | −3.08** | −2.69** | −5.22** | −4.54** | −2.58** | −2.95** |
| Party ID (scale) | 2.47 | 3.15 | 2.49 | −9.43* | 8.77* | 0.82 | −2.76 | −1.14 | 3.87 |
| R 2 | .04 | .03 | .04 | .04 | .07 | .14 | .11 | .06 | .07 |
| n | 2,037 | 3,023 | 1.797 | 1,897 | 2,010 | 1,769 | 1,873 | 2,061 | 3,955 |
| PDI | −12.27 | −7.03 | −0.73 | −0.11 | −5.93 | −4.41 | −17.67 | −16.02 | −9.18 |
| Intercept | −0.09 | 0.37 | 4.16 | 5.46 | 3.80 | 16.28 | 5.84 | −12.61 | −5.74 |
| Difference | 12.18 | 7.4 | 4.89 | 5.57 | 9.73 | 20.69 | 23.51 | 3.41 | 3.44 |

Source. Australian Election Survey (1990-2013).
Note. OLS = ordinary least squares.
p < .05. **p < .01.
Declaration of Conflicting Interests
The author(s) declared no potential conflicts of interest with respect to the research, authorship, and/or publication of this article.
Funding
The author(s) received no financial support for the research and/or authorship of this article.