
Abstract
The Partnership Questionnaire (PFB) is used favorably in the German language area to measure partnership quality. The goal of the present study is to re-analyze the subscales of the PFB (Conflict Behavior, Tenderness, Communication) via the Rasch model. Polytomous and dichotomous Rasch models were calculated in a population sample (N = 1,123) and a student-based cross-validation sample (N = 250) for the three subscales of the PFB. Final models were chosen based on several fit criteria. Good to very good model fit was obtained with symmetrical (Conflict Behavior) or nonsymmetrical (Tenderness, Communication) dichotomously collapsed categories. After adapting the instruction and dichotomizing the categories, the PFB can be used as a checklist (PFB-checklist). An additional cross-validation is needed to substantiate the obtained results.
Keywords
A considerable amount of research has focused on understanding what factors predict partnership satisfaction and dissolution (for reviews, see Amato, 2010; Bradbury, Fincham, & Beach, 2000; Hahlweg, Baucom, Grawe-Gerber, & Snyder, 2009). A happy relationship influences general life satisfaction, health, and well-being positively in many ways (Holt-Lunstad, Birmingham, & Jones, 2008; Kiecolt-Glaser & Newton, 2001). On the contrary, a disharmonic relationship influences the life situation of both partners negatively, especially concerning physical and psychological health (e.g., Kiecolt-Glaser & Newton, 2001; Whisman, 2007, for a review). Furthermore, relationship distress can impact treatment response for a variety of individual disorders (e.g., Beach, 2001; Hooley & Teasdale, 1989; O’Farrell & Clements, 2012). Accordingly, relationship distress, its antecedents, and consequences have been an active area of research (Hahlweg et al., 2009; Shadish & Baldwin, 2003, 2005; Snyder, Castellani, & Whisman, 2006).
The Partnership Questionnaire (PFB) developed by Hahlweg (1996; Hinz, Stöbel-Richter, & Brähler, 2001) is commonly used in Europe as a measure of relationship or marriage quality, that is, the subjective evaluation of one’s relationship/marriage, and has been translated into nine languages (English, Dutch, Afrikaans, French, Italian, South Africa English, Spanish, Chinese, Maleyish). In addition, a short form of the PFB, the PFB-K, has recently been developed and evaluated (Kliem, Körger, et al., 2012). Other instruments commonly used to gather information about relationship quality include the Marital Adjustment Test (MAT; Locke & Wallace, 1959), the Dyadic Adjustment Scale (DAS; Spanier, 1976), and the Marital Satisfaction Inventory (MSI; Snyder, 1981). Partnership quality, as measured via the PFB, can be seen as comparable with the other mentioned instruments. For example, the PFB total score correlates highly with the sum scores of the DAS (Spanier, 1976; r = .79- .85; Hahlweg, Klann, & Hank, 1992; Rossier, Rigozzi, Charvoz, & Bodenmann, 2006). Although the MAT, DAS, MSI, as well as other psychometric instruments have been re-analyzed using item-response-theory, and despite that relationship distress is an important problem in German-speaking countries (DESTATIS, 2010), no study up to date has evaluated whether the PFB, which is favorably used in German-speaking countries, conforms to the assumptions of Item Response Theory (IRT) (e.g., Funk & Rogge, 2007; Sabourin, Valois, & Lussier, 2005).
But why is it important to evaluate clinical instruments via IRT? IRT has several potential advantages over classical test theory, for example, by potentially giving invariant estimates and providing advanced reliability information. First, via IRT, one can obtain so-called invariant item and latent trait estimates. In classical test theory, the item means are dependent on the sample. If a researcher samples very satisfied participants, means on items assessing dissatisfaction will be lower than if he had sampled dissatisfied participants. Within sampling error, the estimates of a fitting IRT model should be the same (within a linear transformation; Embretson, 1996). Second, by using IRT models more precise measurements can be obtained. For example, via the Rasch model, it is possible to obtain detailed information regarding the precision of measurement (or reliability) of the scales. Whereas in classical test theory, only global measures of reliability are available, the Rasch model provides the researcher with the possibility to calculate precision of measurement statistics depending on the position on the latent continuum (see, for example, Embretson & Reise, 2000). This possibility is especially useful to decide which purpose the instrument might be used for. One could argue, for example, that a screening instrument should be able to discriminate extreme from nonextreme values on the latent continuum (maximum reliability in very high parts of the latent continuum) because it should adequately identify the at-risk population. An instrument used for the evaluation of therapy interventions, on the other hand, should detect changes most reliably in the middle and upper part of the latent continuum, because it should adequately reflect changes in the burden of patients. In addition, by analyzing the precision of measurement for specific items, one can determine which items best discriminate on what position on the latent trait. This information could be beneficially used for constructing short scales. For example, using this information, one could strategically select items to capture the whole latent dimension as efficiently as possible or concentrate on specific parts when developing questionnaires for specific populations. Without specific reliability measures, one cannot obtain this important information (for a comprehensive introduction into IRT see, for example, Embretson & Reise, 2000). Thus, it seems important to analyze clinical instruments via IRT.
The goal of the present study is to evaluate whether the widely used PFB, which was constructed by means of Classical Test Theory, could conform to the requirements of the Rasch model. Finding that the PFB conforms to the Rasch model would have important implications regarding, for example, the preciseness of the measurement of partnership quality and could thus be important in practical and theoretical applications. However, to the knowledge of the authors, this analysis has not been conducted before. Although other recent studies have evaluated relationship distress measures with IRT, these studies have all been conducted in the United States with English versions and are not necessarily translatable to other cultures and languages (DAS, Funk & Rogge, 2007; Sabourin et al., 2005; MAT, Funk & Rogge, 2007). However, statistics show that relationship distress represents a widespread phenomenon in German-speaking countries as well (DESTATIS, 2010). As the PFB is the most commonly used measure of partnership satisfaction in German-speaking countries, an evaluation of the PFB is needed. To fill this gap, we examine whether the PFB is Rasch scalable in a representative sample for the German population. Toward this end, we first determine an optimal response format for the PFB. Using this response format, we examine whether the Rasch model fits the PFB. Last, we cross-validate all results via a German student-based sample.
Method
Measures
PFB
The PFB consists of the three subscales Conflict Behavior, behavior shown during a conflict that does not further the solution of the conflict (e.g., “When we quarrel he or she keeps taunting me”); Tenderness, all activities that include physical contact (e.g., “He or she caresses me tenderly”); and Communication, communicative activities that are done by both partners and show their closeness (e.g., “We talk to each other for at least half an hour every day”). Each subscale contains 10 items with a four-point response format (never/very seldom, seldom, often, very often). A value of 0 to 3 points can be matched to each item, depending on the selected answer. Furthermore, a so-called “Happiness-item” (“How happy would you consider your relationship?”) based on the rating scale from 0 (very unhappy) to 5 (very happy) by Terman, Buttenwieser, Ferguson, Johnson, and Wilson (1938) is added to the PFB similar to other widely used marital distress scales (e.g., DAS; Spanier, 1976). Using a sample representative for the population of Germany (Hinz et al., 2001), good to very good reliability coefficients were confirmed for the three subscales (Conflict Behavior: α = .88; Tenderness: α = .91; Communication: α = .85; Total Scale: α = .93). In addition, the factorial validity of the PFB has been confirmed via exploratory and confirmatory factor analyses (see, for example, Kliem, Kröger, Stöbel-Richter, Hahlweg, & Brähler, 2012).
Participants
Population sample
In the year 1999, an independent polling institute interviewed 2000 people between the ages of 18 and 50 years on behalf of the University of Leipzig. Participants were chosen from households, which were selected following a random-route procedure based on the constituencies of the federal elections. Following this, one participant was chosen randomly from each of the selected households and interviewed at home. The response rate among those contacted was approximately 68% (for further details, see Hinz et al., 2001). The data collection was done in accordance with German procedures for human subject participation and data privacy laws (e.g., voluntary participation and deletion of identifying information). For the present study, people who were currently in a relationship (N = 1,344) and who had completed the PFB were eligible for analysis (N = 1,123 participants). Of all the participants, 700 were female (62%) and 870 had at least one child of their own. The participant’s mean age was 36.7 years (standard deviation [SD] = 8.3 years). The average duration of the current relationships was 12.8 years (SD = 8.4 years). The following total score means and SDs of the PFB for the subscales were found in the population sample: Communication: M = 19.7, SD = 5.1; Tenderness: M = 19.6, SD = 5.6; Conflict Behavior: M = 23.4, SD = 5.2. Furthermore, good to very good reliability coefficients could be confirmed for all subscales: Communication: α = .85; Tenderness: α = .90; Conflict Behavior: α = .88. The average satisfaction with the relationship was estimated through the “Happiness-item,” resulting in an average value of 4.8 (SD = 1.1), which corresponds to a happy relationship.
Student-based sample
Data for the cross-validation sample were obtained in an annual seminar about test construction for students of psychology at the Technical University of Braunschweig. The collection of data took place as an assignment in the seminar, with approximately 50 to 70 students completing the PFB themselves as well as collecting data from two additional people. A collection of data for the PFB is available from seminars taking place in the summer semesters from 2003 until 2010. Initially, 412 participants were surveyed; 277 participants reported being in a relationship and were eligible for the present study. Out of those, n = 250 people had filled out the PFB completely. Of all the participants, 166 (66%) were female and 73 (29%) had at least one child of their own. The participant’s mean age in the student-based sample was 29.9 years (SD = 12.3 years). The following total values for each subscale were found in the cross-validation sample: Communication: M = 20.8, SD = 5.6; Tenderness: M = 21.9, SD = 6.0; Conflict Behavior: M = 21.9, SD = 6.2. Similar to the population sample, reliability coefficients in the cross-validation sample ranged from good to very good: Communication: α = .85; Tenderness: α = .90; Conflict Behavior: α = .90. The average satisfaction with the relationship was 5.09 (SD = 1.0), which indicates a happy relationship.
Statistical Analysis
Several different Rasch models with varying response formats were calculated. First, a Rasch model with the original response categories never/very seldom, seldom, often, and very often was calculated. To examine whether the potential misfit of the previously calculated Rasch model might be due to the response format, we examined whether a dichotomous response format might better fit the response patterns of participants and might thus provide additional psychometric quality for relationship measurement. Thus, in addition to the Rasch model with the original response categories, three dichotomous Rasch models were calculated (“Collapsing Categories”; Bond & Fox, 2001; Lopez, 1996), where the dichotomization of the categories was symmetrical ([never/very seldom, seldom] vs. [often, very often]) or asymmetrical ([never/very seldom] vs. [seldom, often, very often] and [never/very seldom, seldom, often] vs. [very often]). Then, inter alia, Akaike’s information criterion (AIC; Akaike, 1973) and area under curves (AUCs) were determined via receiver operating characteristics (ROC) analysis. AIC is an information criterion that quantifies the relative fit of the model to the data, with smaller AIC values denoting better fit. AUC is also a measure of model fit (Mair, Reise, & Bentler, 2008). However, calculating AUCs is only possible for the dichotomous Rasch model. AUC values between .7 and .8 denote acceptable fit, values between .8 and .9 denote good fit, and values above .9 denote very good model fit (Hosmer & Lemeshow, 2000). The final model with either the original or a dichotomous response format was selected based on several fit criteria (Lopez, 1996; for an example, Elliott et al., 2006).
After the selection of an optimal response format, departures from the Rasch model could principally either occur due to the persons (e.g., younger participants value sexual aspects higher in a relationship than older participants) or because of the items (e.g., the items measure different constructs). Thus, the applicability of the Rasch model for the PFB was checked via the conditional likelihood-ratio tests, which test for misfit because of person heterogeneity, and the Martin-Löf test, which tests for misfit due to item heterogeneity (Andersen, 1973; Fischer & Molenaar, 1995). Both tests split the whole sample in subgroups according to a specific split criterion. Generally speaking, it is then tested whether characteristics of the persons (likelihood-ratio test) or the items (Martin-Löf test) are comparable across the subgroups, which should be the case if the Rasch model fits. Regarding the conditional likelihood-ratio test raw score, random split, sex, and age were used as split criteria for the subgroups. Regarding the Martin-Löf tests, raw score and random split were chosen as split criteria. If significant departures from the model assumptions were found, some of the items might not be scalable according to the Rasch model. Thus, to identify the items that evoked the misfit, Wald tests were additionally calculated. Because of the large sample size, even negligible small departures from the model assumptions might evoke significant model misfit. Thus, graphical model tests were conducted as well to take the effect size of the violations into account. Items were removed if Wald tests and the graphical model tests consistently identified items as misfitting. If an instrument conforms to the Rasch model and the correlation between the raw scores and the person parameters is high enough, the individual items might be collectively averaged and analyzed via the usual methods of statistical inference (see, for example, Bond & Fox, 2001). Contrary to everyday practice, these actions cannot be justified by classical test theory.
Statistical power plays a special role in Rasch analysis because a test cannot validate model fit. Thus, it might only show departures from model fit (model fit is the null hypothesis). Even if the sample size in this study might be regarded as large, the literature still lacks a grounded concept of power calculation in Rasch analysis. In this study, a conservative alpha of 5% is chosen, because an alpha of, for example, 10% would increase the risk of a Type 2 error disproportionately. To correct for multiple tests of model fit, the obtained p values will be corrected via the Bonferroni procedure and will be denoted as p*.
Item difficulties based on the Rasch model
To analyze the item difficulties, we calculated person-item maps. These person-item maps display the item location parameters together with the person parameters on the same scale. Difficult items, in which participants have to have a high person parameter to have a probable chance to solve the item, are found on the right. Thus, via the person-item maps, it is possible to also gauge the reliability of the scale in relation to the latent position.
Reliability based on the Rasch model
In Rasch analysis, the reliability of measurement depends on the position of the latent continuum one considers. We will therefore calculate the reliability of measurement with asymptotic 95% confidence intervals for all relevant raw scores (1, . . .,10). High reliability corresponds to a small confidence interval around the sum score. In addition, Andrich’s (1988) reliability (RelAndrich’s), a global Rasch reliability measure, was calculated, which is interpreted the same as Cronbach’s alpha. Here, the variance of the weighted person parameters is calculated in relation to the expected standard errors of prediction of all person parameters.
All analyses were conducted with the freely available statistics software R (Version 2.13.0, R Development Core Team, 2011). The eRm Package (Extended Rasch modeling), Version 0.14-0, from Mair and Hatzinger (2007a, 2007b) was used to calculate the Rasch models.
Results
Comparison of the Categorization Variants
To fully explore the potential Rasch scalability of the PFB, we first compared several categorization variants. Table 1 contains the fit criteria for the different categorization variants.
Comparison of the Different Rasch Model Conceptualizations Via Model Tests and Fit Indices.

Note. AUC = area under curve; AIC = Akaike’s information criterion.
The results for the polytomous Rasch model suggest severe model departures for all three subscales. In case of the subscale Conflict Behavior, very good model fit was obtained for two dichotomizations. Whereas the AUC favors a symmetrical dichotomization ([never/very seldom, seldom] vs. [often, very often]), the AIC suggests a nonsymmetrical dichotomization as the best-fitting model ([never/very seldom, seldom, often] vs. [very often]). The reason for this disagreement might be the so-called “variance-bias-dilemma,” that is, the phenomenon that observed variance in the data cannot easily be distinguished from bias because of ill-fitting models (Rosenberg et al., 2003). Consequently, the AIC may not be able to distinguish between ill-fitting models with low variance (e.g., a falsely collapsed scale where most participants have a specific value like “happy”) and good fitting models with high variance (e.g., a correctly collapsed scale in which the participants are evenly distributed between categories). Thus, the nonsymmetrical dichotomization might have been favored by the AIC because of a lack of substantial variance in the data. Figures 1 to 3 depict the raw-score boxplots after the different dichotomizations and seconds the suspicion of the occurrence of the variance-bias dilemma. Because a psychometric instrument with minimal variance, as indicated in Figure 1, may lack the diagnostic ability needed to fulfill its purpose, we chose the symmetrical dichotomization as the final model for the Conflict Behavior subscale.

Comparison of the boxplots depicting the sum scores of the scale Conflict Behavior of the PFB regarding a symmetric (left) and a nonsymmetric dichotomization (right; [never/very seldom, seldom, often] vs. [very often]) of the response formats.

Comparison of the boxplots depicting the sum scores of the scale Tenderness of the PFB regarding a nonsymmetric dichotomization (left; [never/very seldom, seldom, often] vs. [very often]) and a second nonsymmetric dichotomization (right; [never/very seldom] vs. [seldom, often, very often]) of the response formats.

Comparison of the boxplots depicting the sum scores of the scale Communication of the PFB regarding a nonsymmetric dichotomization (left; [never/very seldom, seldom, often] vs. [very often]) and a second nonsymmetric dichotomization (right; [never/very seldom] vs. [seldom, often, very often]) of the response formats.
Regarding the subscale Tenderness, the model fit criteria indicated good model fit for a nonsymmetrical dichotomization ([never/very seldom, seldom, often] vs. [very often]). Although the AIC suggested a symmetrical dichotomization again, the boxplots depicted in Figure 2 indicate the occurrence of the aforementioned variance-bias dilemma, so that the nonsymmetrical dichotomization was chosen as the final model.
In case of the subscale Communication, contradictory results emerged as well. Whereas the AIC suggested a nonsymmetrical dichotomization in ([never/very seldom] vs. [seldom, often, very often]), the boxplots depicted in Figure 3 indicate an occurrence of the variance-bias dilemma. Thus, the dichotomization ([never/very seldom, seldom, often] vs. [very often]) was preferred, and dichotomous categorization variants were preferred over the regular response scale of the PFB for all three subscales.
Rasch Model Fit
To examine the model fit of the previously selected dichotomous Rasch models, we calculated several fit criteria regarding the three subscales of the PFB. Regarding person homogeneity for the subscale Communication, no significant departures from model assumptions emerged for the split criteria raw score (χ2 = 18.54, df = 9, p* = .113), random split (χ2 = 13.00, df = 9, p* = .412), and age (χ2 = 19.21, df = 9, p* = .090). The likelihood-ratio test concerning the split criterion sex, however, was significant (χ2 = 24.07, df = 9, p* = .017). Concerning the item homogeneity, the Martin-Löf tests indicated one significant departure from model assumptions regarding the criterion random split (χ2 = 56.25, df = 24, p* < .001) but no further violation of model assumptions for the criterion raw score (χ2 = 32.33, df = 24, p* = .224). To further investigate the adequacy of the subscale, Wald tests were computed (Table 2). Only Item 29 was significant (“He or she tells me, that he or she likes me”). The graphical model test also suggested the exclusion of this item (see Figure 4). After eliminating Item 29, the cross-validation sample showed no significant model departures regarding person homogeneity (raw score: χ2 = 18.9, df = 8, p* = .059; random split: χ2 = 5.7, df = 8, p* = .990; sex: χ2 = 8.6, df = 8, p* = .847; age: χ2 = 16.9, df = 8, p* = .199) and item homogeneity (raw score: χ2 = 27.4, df = 19, p* = .183; random split: χ2 = 32.6, df = 19, p* = .055). Thus, after excluding one item, the collapsed Communication scale of the PFB conformed to the assumptions of the Rasch model.
Wald Tests for the Scale Communication.
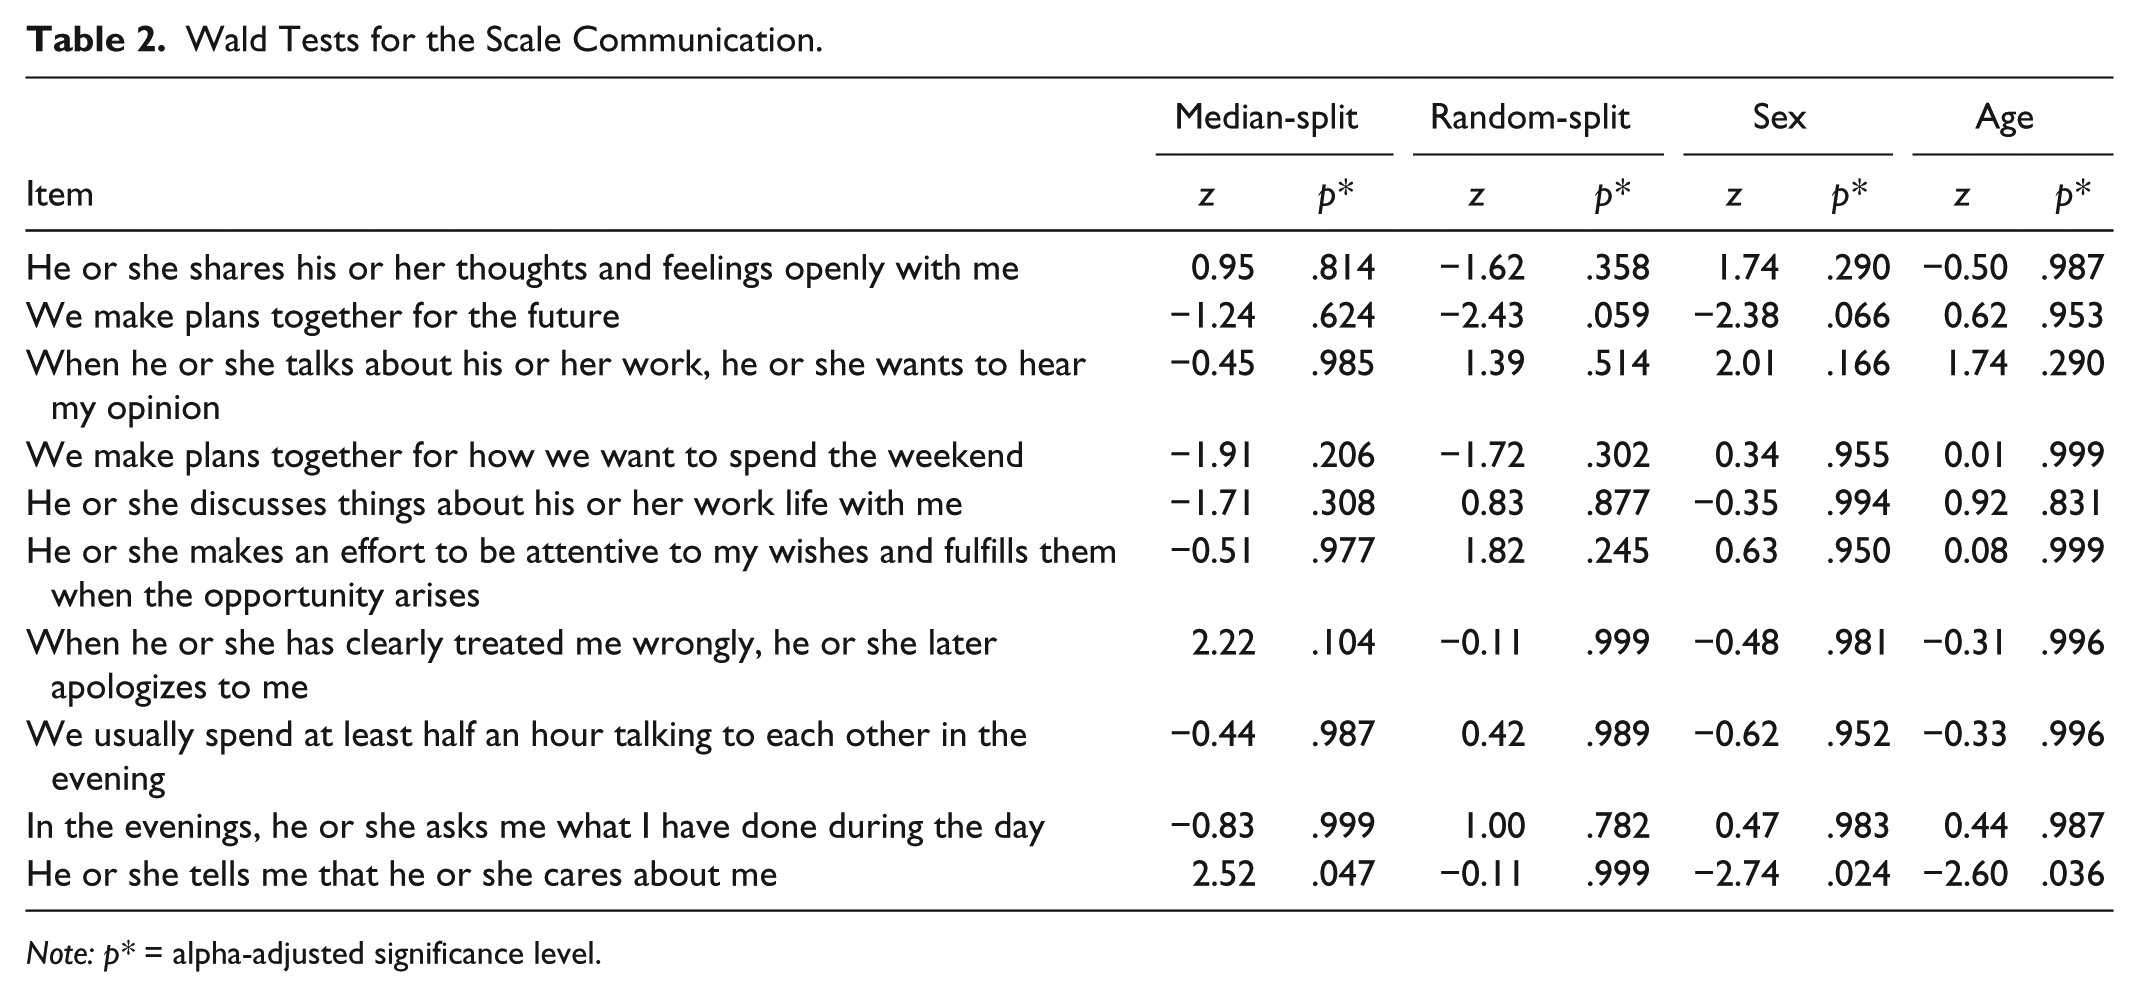
Note: p* = alpha-adjusted significance level.

Graphical model tests for the subscale Communication.
The subscale Conflict Behavior conformed to the Rasch model. No test was significant regarding person homogeneity (sex: χ2 = 3.45, df = 9, p* = .999; random split: χ2 = 13.37, df = 9, p* = .379; ; age: χ2 = 11.59, df = 9, p* = .558). Here, it was not possible to calculate a median split of the raw score because of the response patterns. Tests for item homogeneity led to no reason for concern (raw score: χ2 = 25.84, df = 24, p* = .740; random split: χ2 = 24.51, df = 23, p* = .757). The Wald tests and graphical model tests indicated no model misfit. The results in the cross-validation sample for person homogeneity (raw score: χ2 = 11.9, df = 9, p* = .632; random split: χ2 = 7.1, df = 9, p* = .981; sex: χ2 = 8.8, df = 9, p* = .911; age: χ2 = 11.0, df = 9, p* = .722) as well as item homogeneity (raw score: χ2 = 27.7, df = 24, p* = .378; random split: χ2 = 32.2, df = 24, p* = .229) also indicated no model violation. Thus, the collapsed Conflict Behavior scale of the PFB conformed to the assumptions of the Rasch model without further modification.
For the subscale Tenderness, the model tests indicated model conformity in the representative sample (raw score: χ2 = 15.14, df = 9, p* = .306; sex: χ2 = 6.49, df = 9, p* = .991; random split: χ2 = 6.74, df = 9, p* = .962; age: χ2 = 2.43, df = 9, p* = .999). Testing item homogeneity via the Martin-Löf tests indicated no model violation either (raw score: χ2 = 25.44, df = 24, p* = .618; random split: χ2 = 31.27, df = 24, p* = .271). The Wald tests resulted in no significant model departures on item level. The graphical model tests confirmed the results of the Wald tests. The results of the cross-validation sample seconded the results of our main sample; no significant departures from model fit were found regarding person homogeneity (raw score: χ2 = 19.7, df = 9, p* = .078; random split: χ2 = 10.6, df = 9, p* = .767; sex: χ2 = 16.6, df = 9, p* = .203; age: χ2 = 10.6, df = 9, p* = .764) and item homogeneity (raw score: χ2 = 22.4; df = 24, p* = .800; random split: χ2 = 15.3, df = 24, p* = .992). Thus, the Tenderness scale of the PFB conformed to the assumptions of the Rasch model without further modification.
Item Difficulties Based on the Rasch Model
To examine the reliability of the PFB in the general population sample across the latent dimension, we inter alia calculated person-item maps, which show the distribution of the item parameters together with the distribution of the person parameters. Figure 5 shows the person-item maps for the three subscales of the PFB. In general, it is desired that the difficulties of the items (lower part of Figure 5) span approximately the same positions on the latent trait as the person parameters (upper part of Figure 5). Regarding the subscale Communication, Item 19 (“When he or she has clearly treated me wrongly, he or she later apologizes to me”) had the highest and Item 10 the lowest item difficulty (“We make plans together for the future”). Of all participants, 290 (25.8%) answered all items of the Communication scale with often or very often; only 20 (1.7%) participants answered all items with very seldom or seldom.

Person-item maps for the three subscales of the PFB.
With respect to the subscale Tenderness, Item 27 had the highest (“He or she talks to me about his or her sexual desires”) and Item 23 (“He or she hugs me”) the lowest item parameter. Three hundred fifty persons (31.2%) responded to the items of the scale Tenderness with often or very often, 42 persons (3.7%) with very seldom or seldom.
The analysis of the subscale Conflict Behavior showed that Item 1 (“He or she keeps bringing up mistakes that I have made in the past”), marginally followed by Item 18 (“He or she makes derogatory remarks about my opinions”), had the highest difficulty and Item 22 (“He or she blames me when something goes wrong”) the lowest item parameter. Only 5 persons (0.4%) answered all items of the subscale with often or very often; 611 persons (54.4%) rated the items with very seldom or seldom (the scale is coded negatively). Thus, the item difficulties mapped very well to the general population sample, although the items of every subscale seemed to concentrate in the middle part of the latent continuum.
The reliability of the sum scores depending on the position of the latent trait is depicted in Figures 6 to 8. Figures 6 to 8 show which range of the latent continuum corresponds to the observed sum scores on the dichotomized Rasch scale. As one can see in Figures 6 to 8, the latent constructs covary almost linearly with the observed sum scores. The resulting high correlation of latent person parameters with observed sum scores (Communication: r = .97, Tenderness: r = .98, Conflict Behavior: r = .96) indicates that the scale quality might be judged as interval or metric, in the sense that differences in the latent dimension correspond to differences in the observed sum scores. All scales show the highest reliability (i.e., the standard errors around the estimates are smallest) in the middle part of the latent continuum. For example, an observed sum score of 5 on the similarity scale might correspond to a latent score of roughly −0.5 to +1, but an observed score of 8 might correspond to +1 to +3.5 on the latent dimension. Thus, measuring similarity in the extremes nearly doubles the uncertainty of the estimate. Regarding the overall reliability, the Rasch reliability coefficients indicated a good to very good reliability of all three scales (Communication: RelAndrich’s = .86; Tenderness: RelAndrich’s = .89; Conflict Behavior: RelAndrich’s = .79).

Reliability of the dichotomized Similarity scale of the PFB, depending on the position of the latent trait.
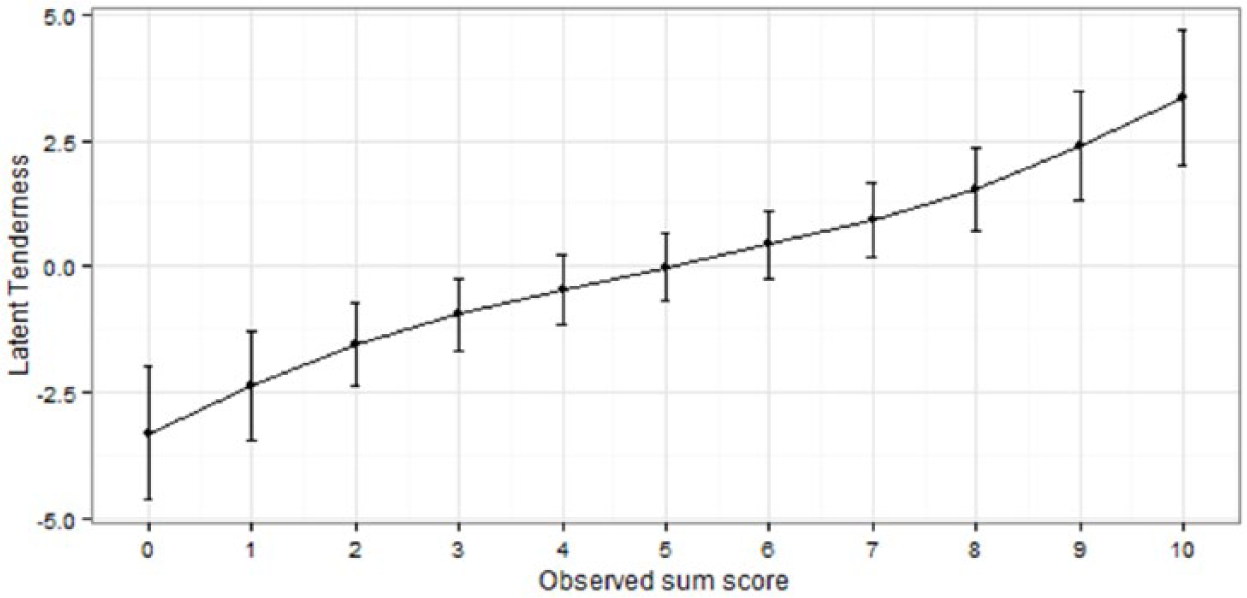
Reliability of the dichotomized Tenderness scale of the PFB, depending on the position of the latent trait.
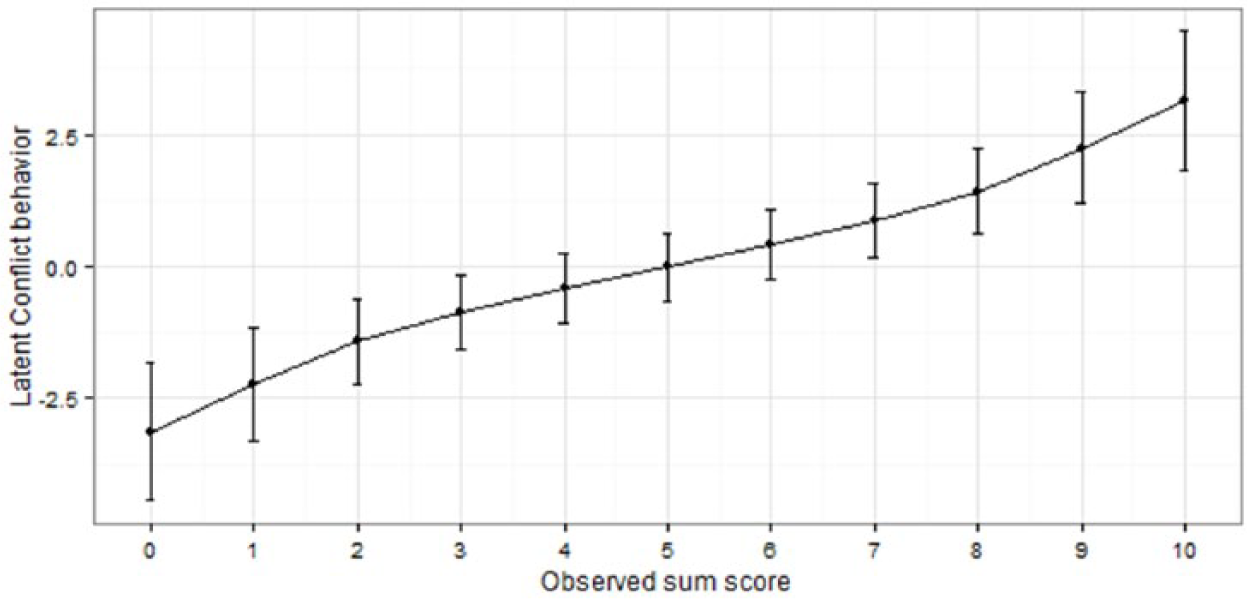
Reliability of the dichotomized Conflict Behavior scale of the PFB, depending on the position of the latent trait.
Discussion
The present article re-analyzed the subscales of the PFB, reviewing their compliance with the requirements of the Rasch model. An analysis on the basis of the 4-point Likert-type scales (never/very seldom, seldom, often, very often) in a series of tests for different model fits showed deviations from the requirements of the Rasch model. After dichotomizing the response categories for the subscales of the PFB, results in accordance with the Rasch model were achieved. This study is to our knowledge the first IRT study of measures of relationship satisfaction to test whether the response categories, beneath an item selection, could be adjusted to achieve model fit. Consequently, we are among the first to find that almost all items could be retained when the response scales are dichotomized. Only one item (subscale Communication, Item 29) had to be eliminated (we deleted rather than allocated Item 29 to be as close to the original PFB as possible). The elimination of Item 29, however, is consistent with the results obtained by Hahlweg (1996) in the exploratory factor analysis of the PFB, which resulted in the highest factor loading (.70) for this item on the subscale Tenderness.
Based on these results, the items of the PFB could in the future be used as a checklist (PFB-checklist; cf. Elliott et al., 2006 for the Symptom Checklist-90-Revised (SCL-90-R)). To be able to use the PFB as a checklist, the original instructions for the subscales Communication and Tenderness (Hahlweg, 1996), “In the following you can see a list of behaviors, which possibly occur in your relationship/marriage. ( . . . ). The numbers behind the statements have the following meaning,” have been changed to “In the following you can see a list of behaviors, which [VERY OFTEN] occur in your relationship/marriage.” For the subscale Conflict Behavior, the instructions have been changed to “In the following you can see a list of behaviors, which [OFTEN] occur in your relationship/marriage.” The response categories for the items would then be “no” (= 0) or “yes” (= 1). Even though the results of the present analysis have been cross-validated with a second independent sample, a further validation should follow, thus ensuring that the results can also be obtained with the presentation of the “PFB-checklist.” Provided the results can be replicated, the “PFB-checklist” would be a psychometric instrument in accordance with the Rasch model, applicable for the analysis of relationship quality (Embretson & Reise, 2000). Because the PFB-checklist has been shown in a representative sample of the German population to be most reliable, that is, to best discriminate between persons, in the middle part of the latent trait continuum, the instrument could be valuably used in nonclinical samples, whereas the original PFB might be used in clinical samples. One further case where the PFB-checklist may be used is when ease of use is of concern. Deciding between two instead of four answer categories might also be slightly faster. For studies where the added ease of use might not be important, researchers could also collect the data in the original response format and dichotomize the data afterward. However, it should be cautioned that these two options might not produce equal results. Future studies should empirically analyze if there are any significant differences in administrating a dichotomized as opposed to a polytomous-and-then-dichotomized PFB.
Due to the high correlation between the total values of the PFB subscales and the related person parameters, the determined total values can be seen as measurement values on interval scale level without problems (cf. Rost, 2004). Future research should examine whether the conceptualization of other partnership measuring instruments (e.g., the DAS) as dichotomized checklists could benefit the psychometric quality of these instruments as well.
These findings are in accordance with previous studies (e.g., Funk & Rogge, 2007), which also showed that other measure of partnership quality might conform to IRT assumptions. Consistent with the literature, we found that measurement properties could be improved by slightly adapting the instrument. While Funk and Rogge (2007) selected items as a strategy to improve the preciseness of the measurements across the latent trait, we used a different strategy and could obtain pleasing results by changing the response format of the instrument. One possible explanation for this result might be that the participants could not differentiate well between the original response categories but might be better judges of their partnership quality if only a dichotomous scale is provided. If proven replicable, these findings suggest that other instruments of partnership quality could also be made more efficient and precise by changing the response format. These more precise instruments could then be beneficially used to decrease the likeliness to find methodological artifacts and to increase the likeliness to find real antecedents and consequences of partnership quality. However, given that dichotomizing response scales might also lead to a loss of information, these results must be substantiated by further studies. Thus, focusing on the response format of measures of partnership quality might be a fruitful avenue for future research on the measurement of partnership satisfaction.
The reason why the usual polytomous Likert-type scale in the PFB does not allow a uniform separation between participants according to the measured constructs is still debatable. One explanation could be the different subgroups created through the use of split criteria. Different semantic meanings for each response category might exist within those subgroups (Low, 1988). For instance, the semantic meaning of the term often, used to describe frequency in sexuality, might diverge between older and younger or male and female participants. However, all participants in the population sample seem to view the term very often related to sexuality as contrary to the remaining terms of frequency. In addition, measuring partnership quality proved to be most efficient in the middle of the latent continuum. Consequently, individuals at the extremes of the latent continuum were comparatively harder to discriminate. One possible methodological explanation for this phenomenon, which is regularly found in the literature regarding the measurement of satisfaction in general, is that classical test theory prefers items which discriminate in the middle of the continuum, because these items can correlate most strongly with each other and thus tend to have the highest item-scale correlations. However, this finding could also point to a potential theoretical explanation, in that the construct of relationship quality itself best discriminates high-quality from low-quality partnerships. Following this line of thought, there could potentially be other constructs that might discriminate within the high-quality and low-quality groups. Last, this is an empirical question that must be answered by future research. In addition, a mixed-Rasch analysis could determine whether a good model fit might also be obtained for different polytomous Rasch models in independent subsamples.
Although the primary sample was based on a representative German community sample and some subpopulation differences were examined (age and gender), results may have differed for subpopulations not tested (e.g., according to duration of the relationship, eastern or western Germany, children in the relationship). Similarly, the student sample could have been biased in that some student dyads were included in the sample. Although the examination of the widely used PFB adds to the growing literature on the validity of relationship distress measures internationally (Funk & Rogge, 2007), the PFB should also be examined in other cultures and languages in which it is used. In addition, the utility and the validity of the suggested “PFB-checklist” with the Rasch model should be reviewed using a representative population sample, as well as a sample of unhappy couples receiving counseling or couple therapy, or in which one of the partners receives treatment of a psychological disorder.
In addition, the benefits of using the PFB in a checklist format as opposed to using the original scale and collapsing items afterward might be questioned. In a general population sample, people may be comparatively happy as opposed to a treatment-seeking sample, which might be the reason why people either endorsed the maximal response option or not, with the other options not providing a meaningful distinction. If one were to use the checklist in a sample of treatment-seeking couples, one may expect that discriminating between levels of dissatisfaction might be more important rendering the full PFB scale the more indicated in treatment settings. Thus, a PFB-checklist could be beneficially used to discriminate happy–unhappy relationships in a general population, but polytomous scales may be indicated for treatment intervention research. Future studies should validate whether the PFB-checklist could also be beneficially used in clinical samples.
Summing up, to increase the effectiveness of the PFB, the present study re-analyzed the subscales of the PFB (Conflict Behavior, Tenderness, Communication) via the Rasch model. We found in both a population sample (N = 1,123) and a student-based cross-validation sample (N = 250) that collapsing the response format to a dichotomy substantially improved the accuracy and effectiveness of the PFB, as judged by the fit of the Rasch model. Thus, after adapting the instruction and dichotomizing the categories, the PFB could be used as a checklist (PFB-checklist). Although our analysis should be replicated and extended upon, for example, regarding convergent and discriminant validity, the Rasch-based PFB-checklist could prove beneficial for measuring partnership quality.
Footnotes
Authors’ Note
Sören Kliem and Johannes Beller contributed equally to the article.
Declaration of Conflicting Interests
The author(s) declared no potential conflicts of interest with respect to the research, authorship, and/or publication of this article.
Funding
The author(s) received no financial support for the research and/or authorship of this article.