
Abstract
This study analyzed the vulnerability to flooding in Port Harcourt metropolis, Nigeria, by creating vulnerability indices and comparing these indices across the 13 zones that make up Port Harcourt metropolis. The integrated vulnerability assessment approach using indicators was adopted. The indicators were grouped into adaptive capacity, sensitivity, and exposure based on the Intergovernmental Panel on Climate Change definition of vulnerability. The data on these indicators were obtained from fieldwork, questionnaire, and map measurements. Principal component analysis was performed to obtain the first component scores which were used to weight the variables before calculating the vulnerability indices of the 13 zones. The vulnerability indices results show that Mgbuosimiri (Zone K) is relatively the most vulnerable, whereas the least vulnerable is Eligbolo (Zone D). Cluster analysis was used to group the different vulnerability indices to produce a vulnerability map showing the spatial pattern of the different flood vulnerability levels (i.e., very high, high, low, and very low vulnerability levels). The spatial pattern of the vulnerability levels increases toward the north west, south west, south, and north east, and decreases toward the central of Port Harcourt. However, the vulnerability map can be used for the reduction of damage potential by integrating its outputs into spatial planning and emergency planning.
Statement of Problem
A flood is the accumulation of too much water which rises to overflow land which is not normally submerged (Mukhopadhyay, 2010; Ward, 1978). Flooding can comprise overflow of a river as a result of prolonged seasonal rainfall, rainstorm, snowmelt, dam-breaks, accumulation of rainwater in low-lying areas with a high water table, or inadequate storm drainage. Floods could also be caused by intrusion of sea water onto coast lands during cyclonic/tidal surges (Handmer, Penning-Rowsell, & Tapsell, 1999; Stoltman, Lidstone, & DeChano, 2004).
The terms used to describe flooding are numerous and may mean different things to different scholars with respect to the context in which they are used (Brooks, 2003; Brooks, Adger, & Kelly, 2005). Social scientists and climate scientists often mean different things when they use the term “vulnerability”; whereas social scientists tend to view vulnerability as representing the set of socio-economic factors that determine people’s ability to cope with stress or change (Allen, 2003), climate scientists often view vulnerability in terms of the likelihood of occurrence and impacts of weather- and climate-related events (Fussel & Klein, 2006; Hinkel, 2011; Malone & Engle, 2011; Nicholls, Hoozemans, & Marchand, 1999; Vincent, 2004; Yusuf & Francisco, 2009). Vulnerability as used in this work is those biophysical and socio-economic factors that determine people’s ability to cope with flooding.
The occurrence of floods in Nigeria is not a recent phenomenon (Adeloye & Rustum, 2011; Ayoade, 1979; Ayoade & Akintola, 1980; Olaniran, 1983; Ologunorisa & Terso, 2006). The recent occurrences of flooding in the country such as the Sokoto flood in 2010, Ibadan flood in 2011, Lagos flood in 2011, and the 2012 floods in parts of Lokoja, Makurdi, Asaba, Ogbaru, Yenegoa and so on, had shown that flooding is one of the major environmental problems faced in Nigeria. Most research works had examined extensively the causal factors and have attributed flooding to topography, soil/vegetation/river alteration, increased heavy rainfall, land use change, and unplanned urbanization (Adeloye & Rustum, 2011; Folorunsho & Awosika, 2001; Ogba & Utang, 2008; Ologunorisa, 2004; Onokerhoraye, 1995; Oriola, 1994; Parker, 1999). The impacts and effects of flooding have also been noted to range from submerging roads, obstruction of traffic, coastal erosion, disruption of economic activities, displacement of people, loss of property, to loss of lives (Etuonovbe, 2011).
Scientific studies suggest that climate change is likely to cause shifts in the global pattern and intensity of flood events in some regions, thereby increasing the exposure of populations to severe flooding (Few, 2003), and that the impacts of future changes in climate extremes are expected to fall disproportionately on the poor (Intergovernmental Panel on Climate Change [IPCC], 2001, 2007; Midgley, Davies, & Chesterman, 2011).
Studies on vulnerability to climate change and climate risks, including floods, have been undertaken in different regions of the world (Ali, 2007; Aragon-Durand, 2007; Bankoff, 2003; Dutta, Khatun, & Herath, 2005; Gbetibouo & Ringler, 2009; Heltberg & Bonch-Osmolovskiy, 2011; Metzger & Schroter, 2006; Midgley et al., 2011; Thieken, Kreibich, & Merz, 2007; Thorton et al., 2006; Yusuf & Francisco, 2009). Some excellent conceptual and applied work has emerged in the fields of climate change vulnerability and adaptation (Adger, 2006; Fussel & Klein, 2006; Smit & Wandel, 2006; Vincent, 2004). However, it has been challenging to convert conceptual and qualitative approaches into a quantitative index of vulnerability (Hinkel, 2011).
Climate risk and vulnerability mapping have been conducted mostly for the developed countries, but in developing countries, there however exists a gap in the knowledge of vulnerability and coping capacities of African societies to flood hazards, where many of recorded flood disasters are consequences of natural hazards aggravated by development flaws in affected communities (Adelekan, 2010; Olorunfemi, 2011). Nigeria is not an exception; knowledge is still sparse in the literature on flood vulnerability mapping in the country. However, some studies have been carried out on flood vulnerability assessment in some Nigerian areas using different approaches (Ologunorisa, 2004; Ishaya, Ifatimehin, & Abaje, 2009; Ologunorisa, 2004). The study approach of Ologunorisa (2004) was basically an assessment of flood vulnerability zones in the Niger Delta using hydrological techniques based on some measurable physical characteristics, whereas Ishaya et al. (2009) mapped areas vulnerable to flood hazard in Gwagwalada urban area of Abuja using Landsat™ image of 1991 and 2001. Adelekan (2010) approach was based on using the vulnerability characteristics of people to assess the disastrous Abeokuta flood that occurred in 2007. Hitherto, none of these studies provides information on the integrated flood assessment in any part of the country. This is unfortunate, because it has increasingly been acknowledged that an area like the Niger Delta region, which experiences perennial floods owing to its location and low-lying topography, and heavy rainfall (Ogba & Utang, 2008; Ologunorisa & Abawua, 2005), should have been assessed using the integrated method. Port Harcourt is one of such areas considered to be vulnerable to flooding (Oku, Wichendu, & Poronaike, 2011). In 2006, Port Harcourt experienced an unprecedented flooding which submerged houses, paralyzed economic activities, and rendered some people internally displaced in some zones (Zabbey, 2006). Therefore, the need to show the spatial variations to flood vulnerabilities within zones in Port Harcourt metropolis, which will be used in emergency planning and policy making, forms the purpose of this study.
Objectives of the Study
The objectives of the study are to
examine the socio-economic characteristics and adaptive capacities of residents,
examine the sensitivity and exposure indicators used in creating the vulnerability for the 13 zones in Port Harcourt metropolis,
assess and map the vulnerable areas/zones using both biophysical and socio-economic indicators,
examine the spatial pattern of flood vulnerability levels in Port Harcourt metropolis, and
suggest measures for reducing future flood vulnerability in the study area.
The Study Area
Location
Port Harcourt metropolis is located between Latitude 4°45’N and Latitude 4°55’N, and Longitude 6°55’E and Longitude 7°05’E in Rivers State. It is a city in the Niger Delta region of Nigeria. The city lies at the mouth of River Bonny in Rivers State. It is located at about 25 km from the Atlantic Ocean and is situated between the Dockyard creek/Bonny River and the Amadi creek. It lies at an average altitude of about 12 m above mean sea level. Port Harcourt metropolis spans over two local government areas (LGAs) viz Port Harcourt and Obio/Akpor (Figure 1 and Figure 2).

Map of Rivers State showing Port Harcourt metropolis.

Map of Port Harcourt metropolis.
Climate
The study area lies within the Koppen Tropical Rainy Af climatic zone of the Koppen classification (Koppen, 1936). Here, the average temperature for every month is above 18°C, and there is adequate moisture in virtually all the months. Port Harcourt metropolis experiences two seasons, that is, dry and rainy seasons. Temperatures over Port Harcourt metropolis are constantly high with a mean maximum of about 34°C and a mean minimum of about 21°C. The highest temperatures are recorded between the months of April and October.
Research Method
To achieve the aim of this research work, the already delineated map of Port Harcourt metropolis into 13 zones by the Survey Department was used (Figure 3). These zones are Rumukwurushi (Zone A), Rumuodara (Zone B), Elekahia (Zone C), Eligbolo (Zone D), Bori Camp (Zone E), Bodo (Zone F), Orogbum (Zone G), Golf Course (Zone H), Mgbuoba (Zone I), Rumuepirikom (Zone J), Mgbuosimiri (Zone K), Amatagwolo (Zone L), and Town (Zone M). Zones A to M were arbitrarily assigned by the researcher and were in most cases used for analyses instead of the zones’ respective names.
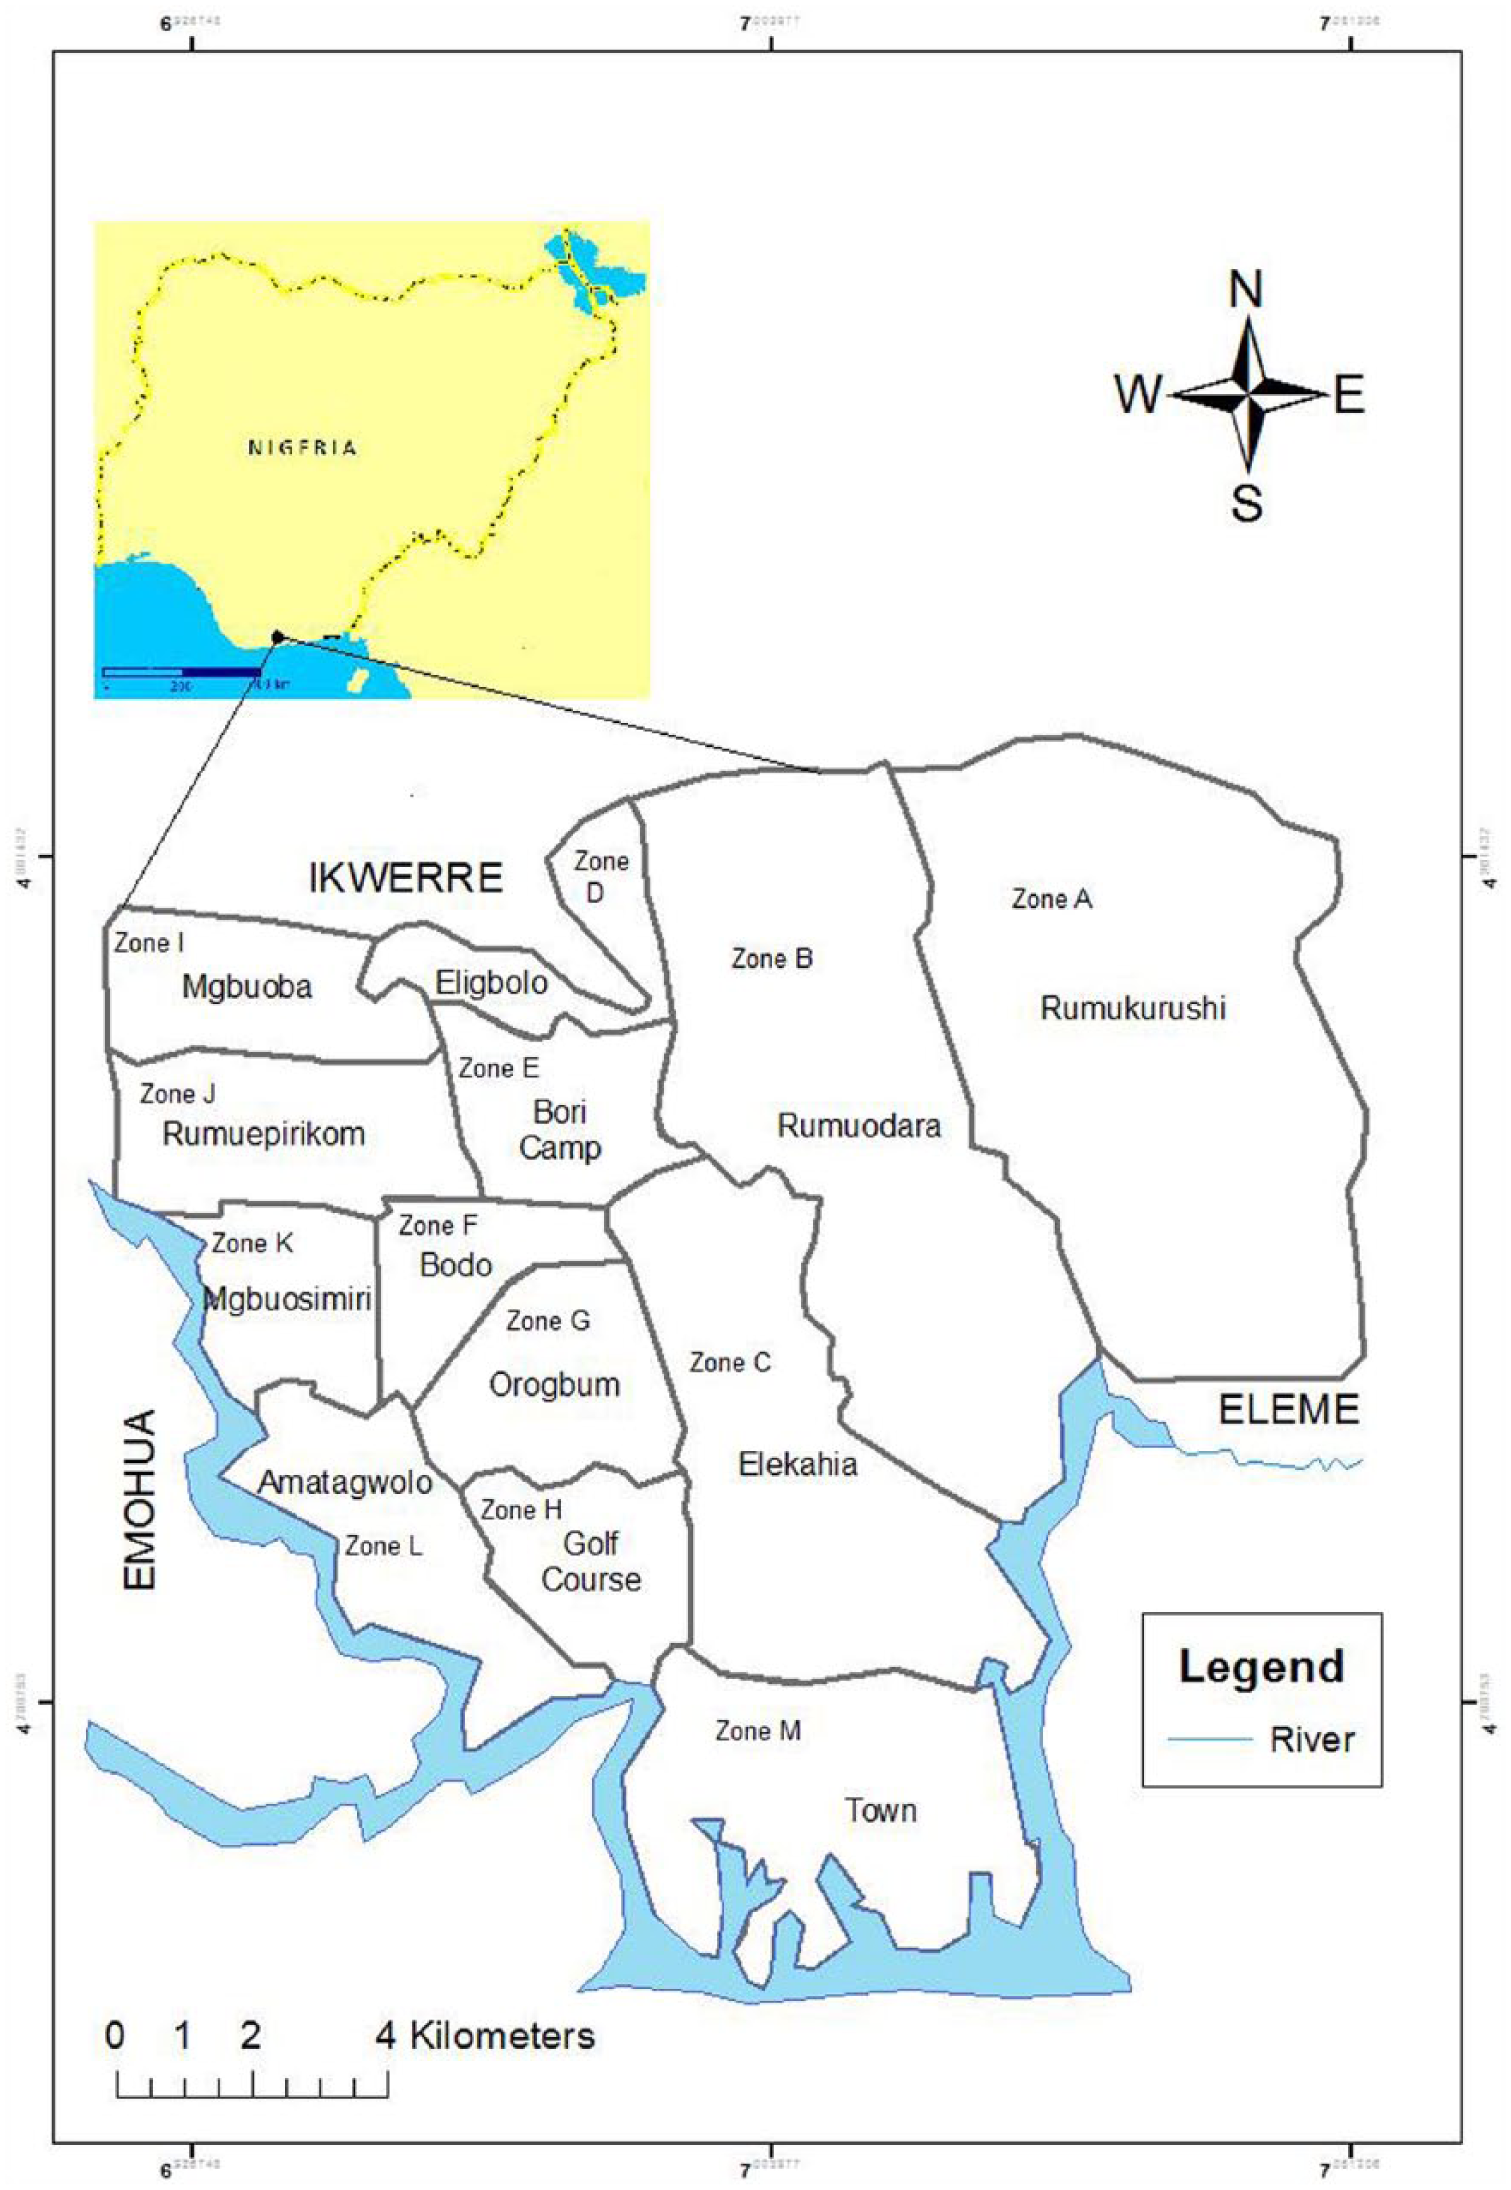
Map of Port Harcourt metropolis showing the 13 zones.
Field Techniques
Field survey, questionnaire, and interviews were used to achieve the objectives of this research. According to Yamane (1967) and Israel (1992), the sampling size of any population that is more than 100,000 persons is 400 using the equation below at ±5% level of precision:

where n is the sample size; N is the population, that is, census population figure; and e is the level of precision/sampling error.
A total of 650 copies (although these exceeded the benchmark of 400 persons as the population of Port Harcourt metropolis is more than 1,000,000 persons) of questionnaire were purposively distributed; 50 for each zone for equal and unbiased representation, and 613 were retrieved. The simple random sampling technique was adopted in administering the copies of questionnaire, from which the respondents’ household income level, level of education, ownership of radio/TV/phone, physical structures (building quality), impact of floods on welfare and income earning opportunities, economic diversification, residents’ experience with flooding, past flood experience, and flood resilience periods were understood. The period of study was from 2010 to 2012.
Poverty was measured using the United Nations poverty line, which says that anybody who earns less than $2/day is considered poor. Therefore, in this study, anybody who earns between N5,000 and N9,000 monthly is counted poor ($1 = N155, 310 × 30 days = N9,300).
Secondary data such as rainfall data were collected from the Port Harcourt meteorological station while a map showing the 13 zones in Port Harcourt metropolis was collected from the Survey Department, Port Harcourt.
Vulnerability Assessment and Indicators
Assessment of flood vulnerability is an important factor in determining where there are zones of different flood risk and why they are at risk. The integrated assessment approach and the indicator method in which both biophysical and socio-economic factors are systemically combined to determine vulnerability were adopted in this study to calculate the zonal vulnerability indices. Indicators were adopted to assess the exposure, sensitivity, and coping/adaptive capacity of the respondents based on the definition of vulnerability given by IPCC (2007) where vulnerability is defined as “ . . . a function of the character, magnitude and rate of climate variation which a system is exposed, its sensitivity, and its adaptive capacity” (pp. 89-90).
The selected vulnerability indicators and their determinants are shown in Table 1.
Vulnerability, Units of Measurement, and Their Relationship to Vulnerability.

Adaptive capacity indicators were chosen based on the following factors: socio-economic/physical factors that influence the ability of people to adjust to flooding, to moderate its potential/actual damages, to take advantage of opportunities arising from it, or to cope with the consequences (adapted from IPCC, 2007). Six adaptive capacity indicators were used, these are, monthly income (in Naira), educational qualification of respondents, group/association membership, receipt of assistance/relief materials, radio/TV/phone ownership, and quality of housing structures.
Sensitivity is the degree to which a system is affected either adversely or beneficially, by climate variability, for example, frequency of flooding (adapted from IPCC, 2007).
Four sensitivity indicators were used, these are, frequency of floods, severity of flood experienced, pre-flood awareness, and past (6 months) flood experience.
Exposure is seen as the nature and degree to which a system/people is/are exposed to significant flooding (adapted from IPCC, 2007). Two exposure indicators were used, these are, distance of dwelling units to a major river and height/depth of flood.
Data on the various indicators were collected using questionnaire except for those of proximity of dwelling units to a river, which were measured using maps.
Thus, vulnerability to flooding was calculated according to Deressa, Hassan, and Ringler (2008) as follows:

This equation was adopted because flooding is one of the consequences of climate change.
Equation 2 above was expanded as follows:
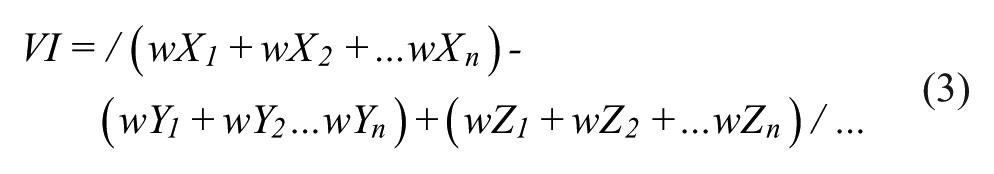
where VI is vulnerability index, w are weights of the first principal component scores, X1-Xn are adaptive capacity variables, Y1-Yn are sensitivity variables, and Z1-Zn are exposure variables (Madu, 2011)
Data Analysis
Both the descriptive and statistical methods of analysis were used in this work. SPSS Version 20.0 was used to run the correspondence analysis, principal component analysis (PCA), and cluster analysis. The weightings used in the correspondence analysis were based mainly on the assumptions made in Table 1. ArcGIS 10.0 was used to generate the vulnerability map.
Correspondence Analysis, PCA, and Cluster Analysis
Correspondence analysis was run on the variables to transform the non-metric data to a metric level and perform dimensional reduction. In essence, correspondence analysis was used to quantify the qualitative data obtained from questionnaire.
PCA was run on the variables, and weights were generated and attached using the first principal component scores of the indicators. The reason for assigning the weights determined by PCA to indicators is to avoid the uncertainty of equal weighting given the diversity of indicators used (adapted from Deressa et al., 2008). Thus, for the construction of the zonal vulnerability indices, the selected indicators of sensitivity and exposure were negatively associated with their first principal component because it is assumed that areas/zones with higher frequencies of flooding were subjected to higher sensitivity due to the adverse effects of flooding as well as being more exposed. On the other hand, adaptive capacity was positively associated with the first principal components because it is assumed that people with higher adaptive capacity are less sensitive to damages caused by flooding, holding exposure level constant. Thus, higher values of the vulnerability indices show less vulnerability and vice versa (adapted from Deressa et al., 2008; Madu, 2011).
Finally, hierarchical cluster analysis was performed on the vulnerability indices to group the zones according to similarity in their degrees of vulnerability using average linkage method, and the spatial pattern of the different vulnerability levels was mapped.
Discussion of Results
Result of the PCA
The PCA of the data set on vulnerability indicators extracted three components with eigenvalues greater than 1. Table 2 reveals that these three components explained 64.69% of the total variance in the data set. The first principal component explained most of the variation (43.036%), the second principal component explained 12.488%, and the third component explained the least (9.170%). The first principal component, which explained the majority of the variation in the data set (Table 3), was taken (i.e., it served as the weight) and used in the computation of the vulnerability indices of the different zones.
Total Variance Explained of Vulnerability Indicators.

Note. Extraction method: principal component analysis.
Component Score of the First Principal Component.
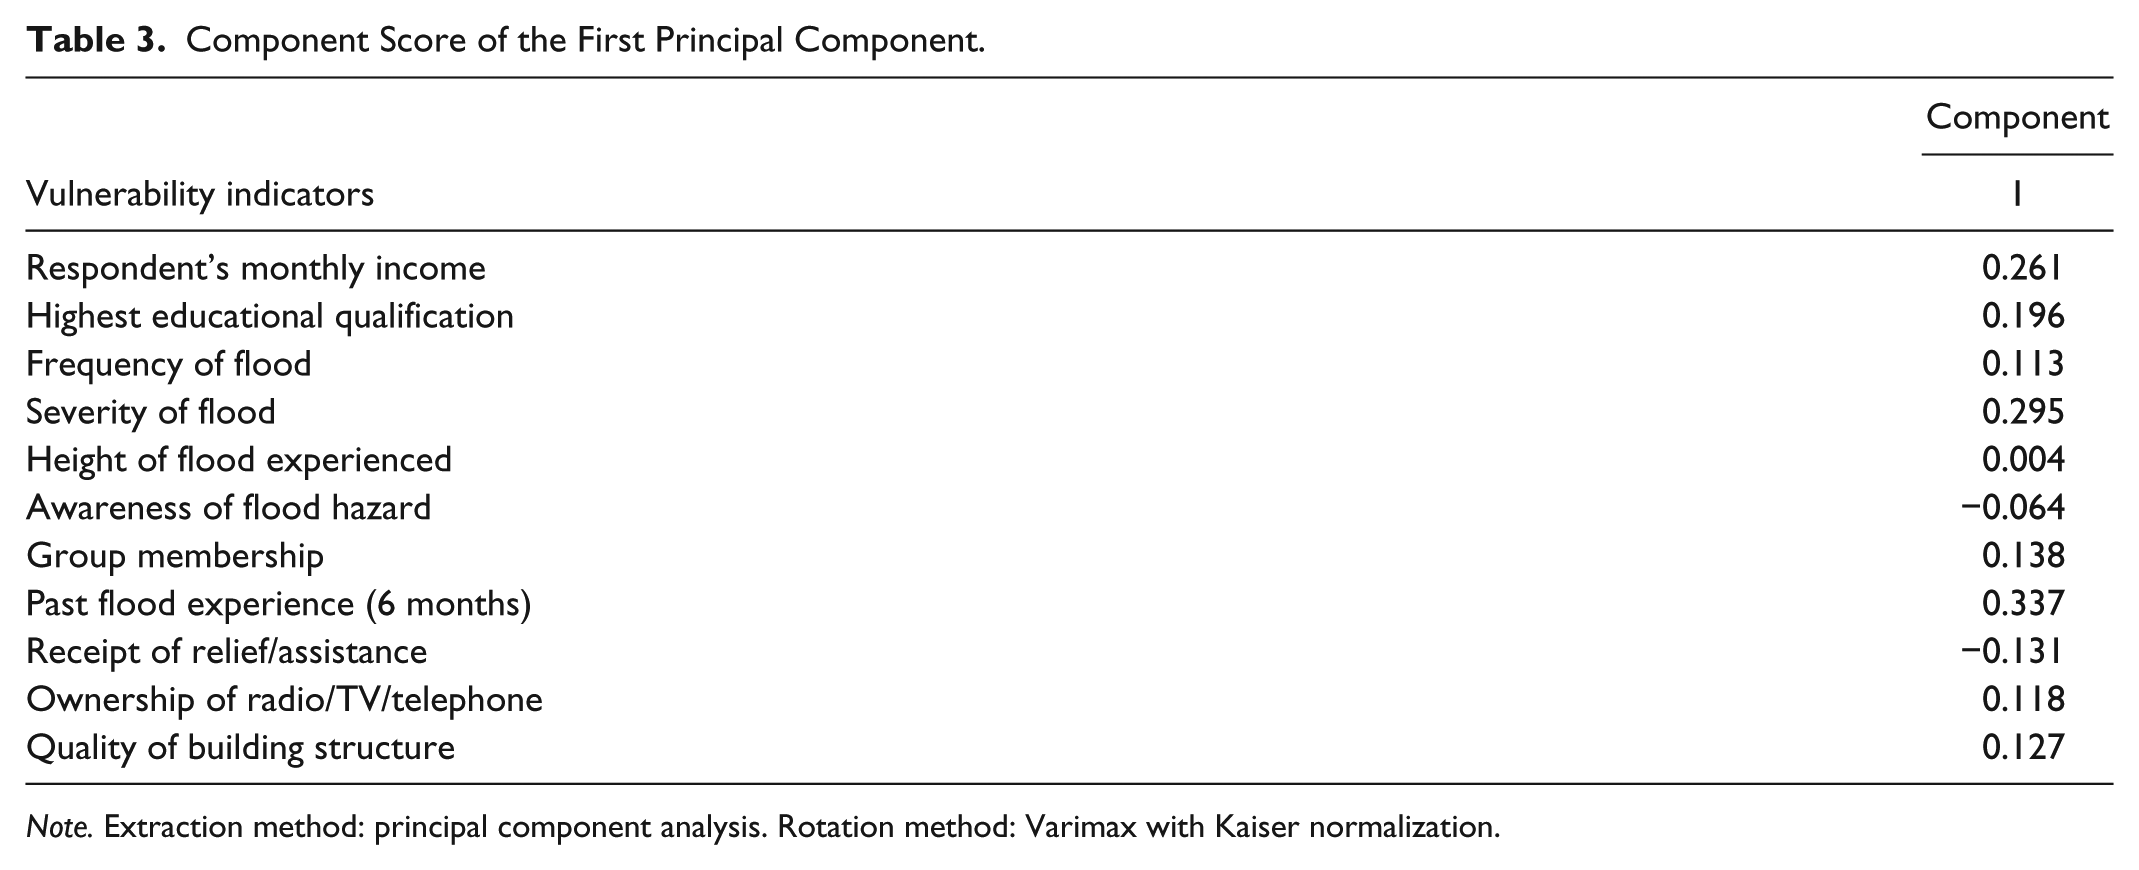
Note. Extraction method: principal component analysis. Rotation method: Varimax with Kaiser normalization.
Socio-Economic Characteristics of Respondents/Adaptive Capacity Indicators
Tables 4 to 10 below show the socio-economic characteristics of the respondents and the adaptive capacity indicators that were used in this research. Figures in parenthesis are the valid frequencies in percentages, whereas the figures outside the parenthesis are the actual number of responses. The variations in the tables show how individuals often vary in terms of age, occupation, level of education, economic status, access to technology, and so on, within and across different zones/regions.
Ages of Respondents in Port Harcourt Metropolis (%).
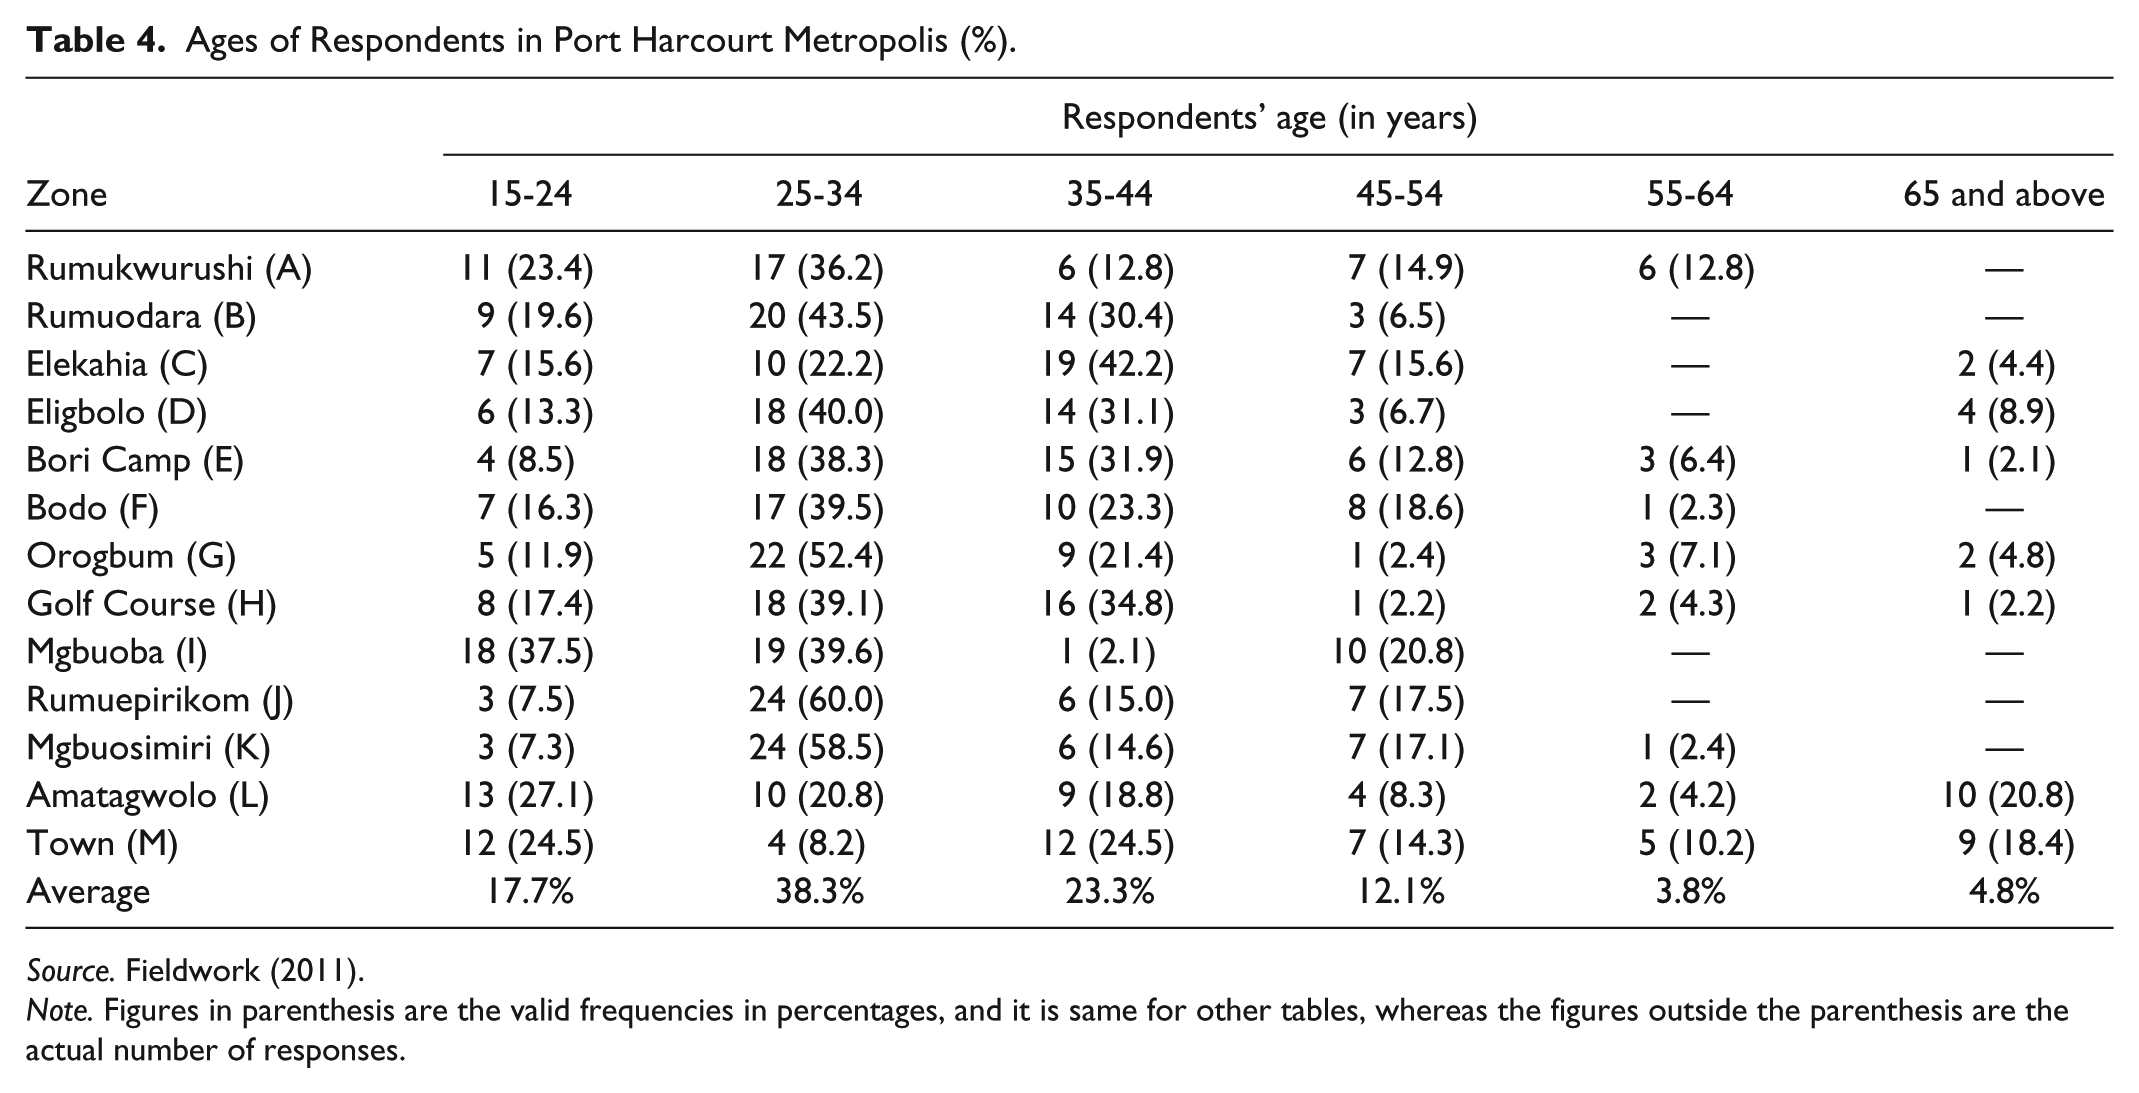
Source. Fieldwork (2011).
Note. Figures in parenthesis are the valid frequencies in percentages, and it is same for other tables, whereas the figures outside the parenthesis are the actual number of responses.
Monthly Income of Respondents in Port Harcourt Metropolis (%).

Source. Fieldwork (2011).
Educational Qualification of Respondents in Port Harcourt Metropolis (%).
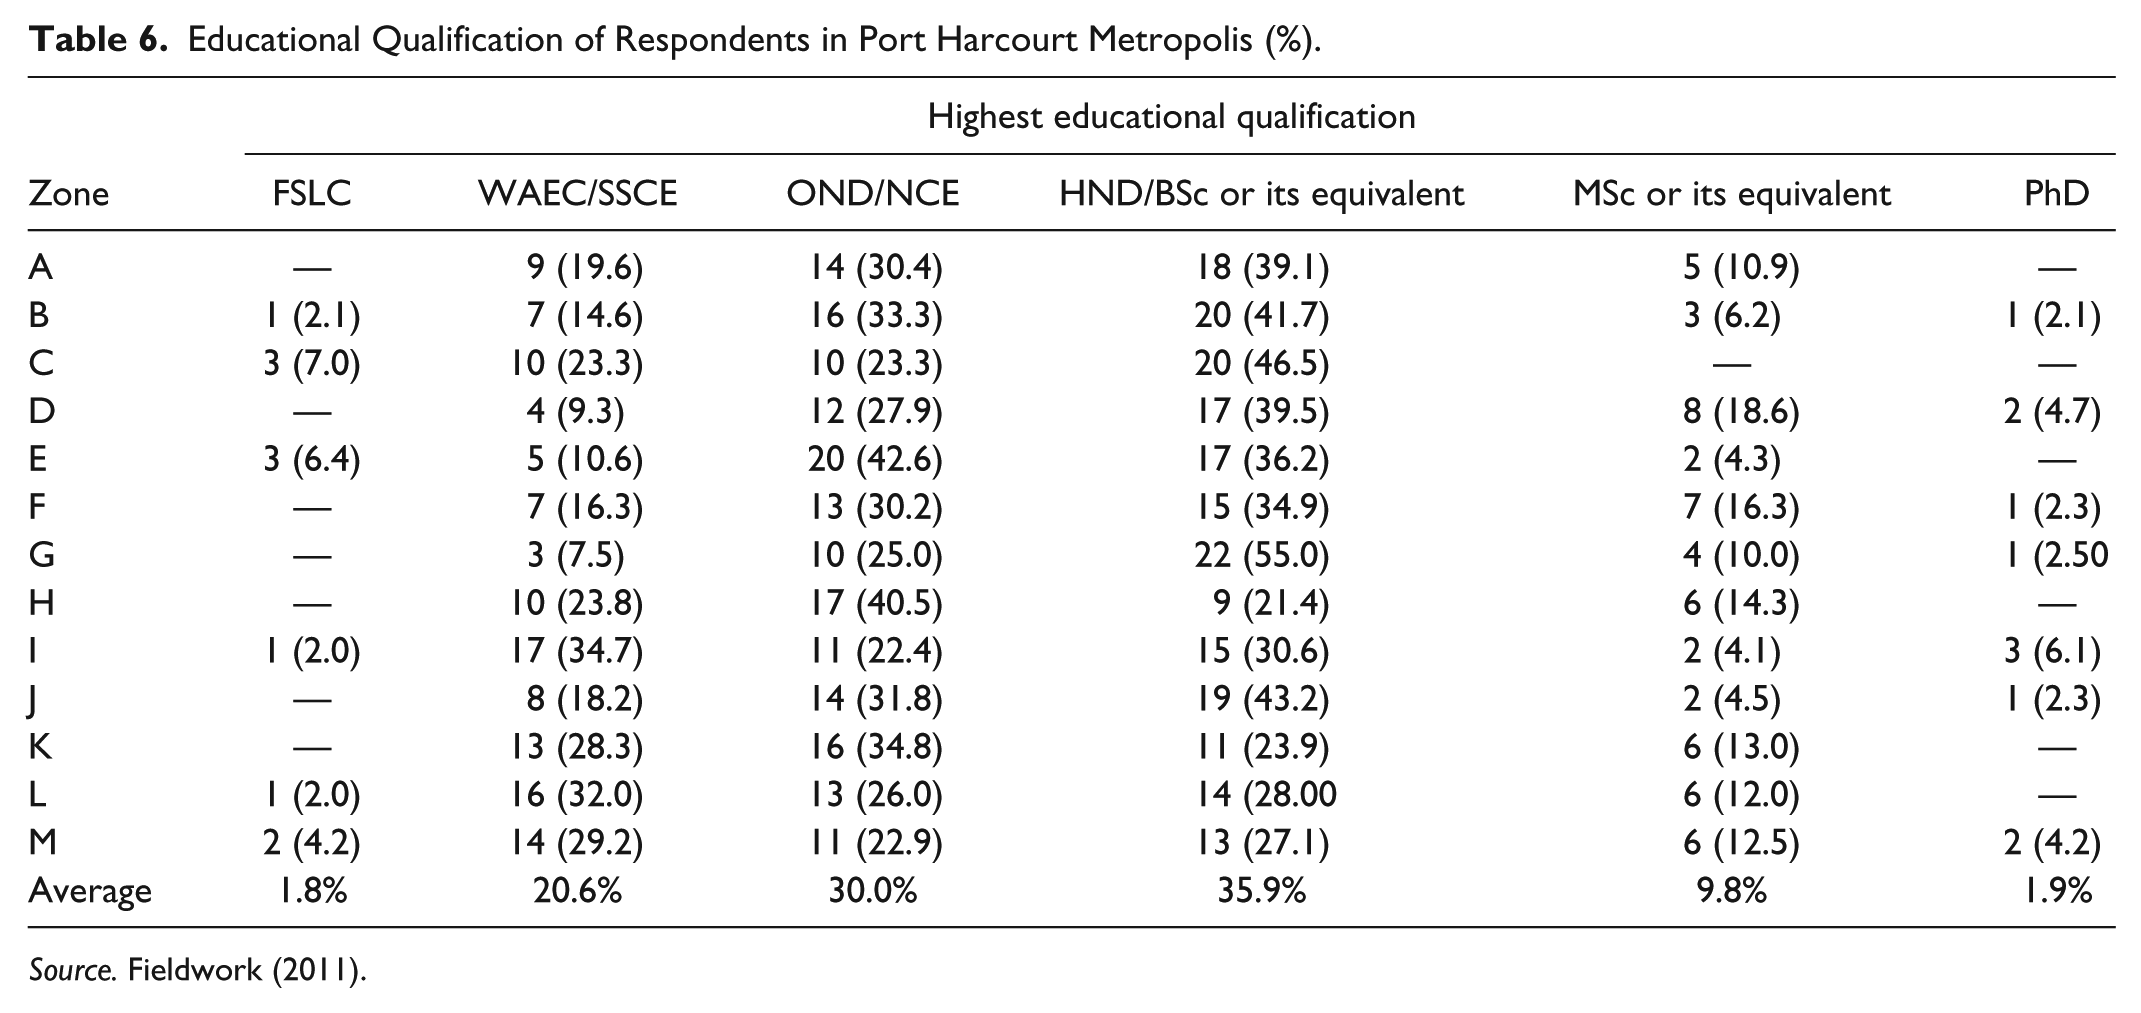
Source. Fieldwork (2011).
Group Membership of Respondents in Port Harcourt Metropolis (%).

Source. Fieldwork (2011).
Note. CBO = community-based organization.
Percentage of Respondents Who Received Assistance/Relief in Port Harcourt Metropolis.
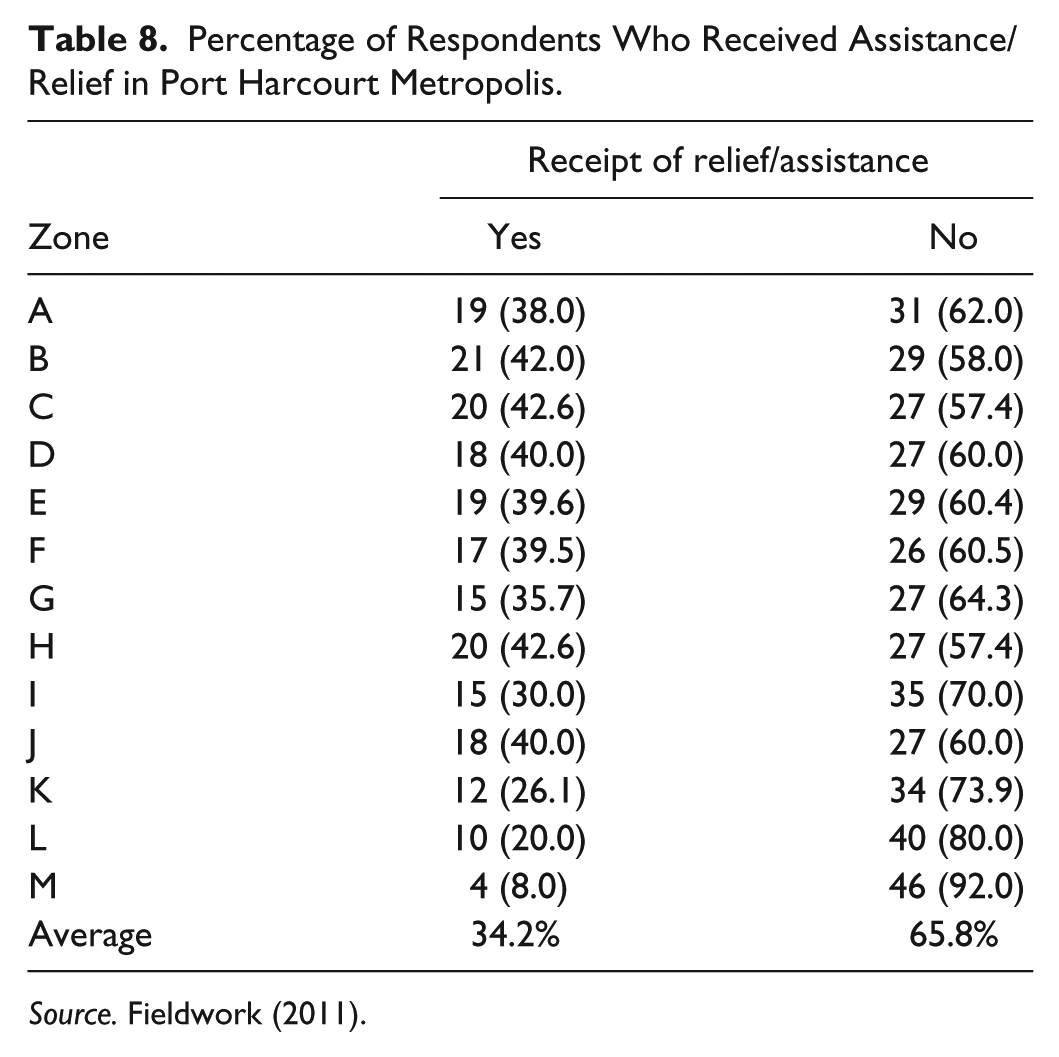
Source. Fieldwork (2011).
Radio/TV/Phone Ownership by Respondents in Port Harcourt Metropolis (%).
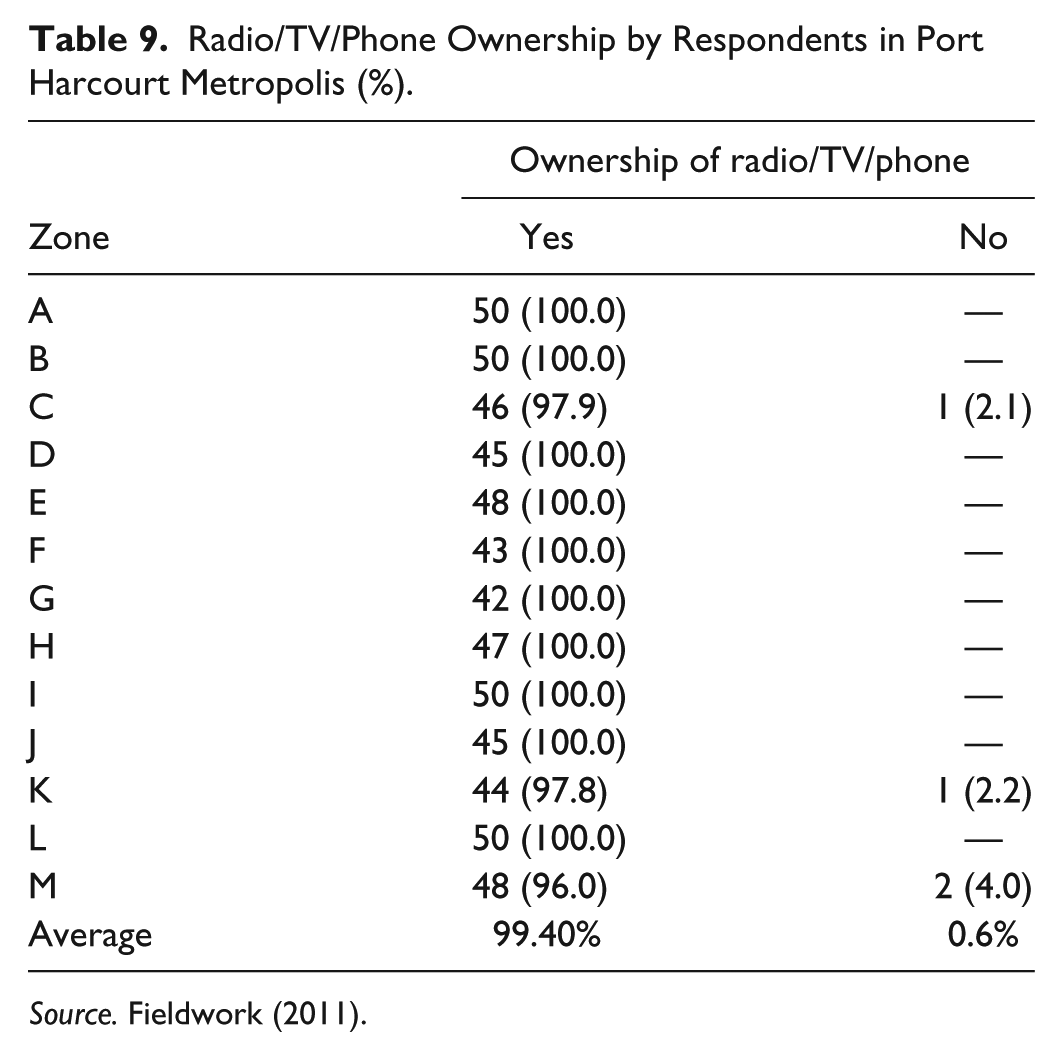
Source. Fieldwork (2011).
Quality of Dwelling Units as Indicated by Respondents (%) in Port Harcourt Metropolis.

Source. Fieldwork (2011).
Generally, in Port Harcourt metropolis, majority of the respondents are between the ages of 25 and 34 years, and this is followed by those between 35 and 44 years of age, 15 and 24 years, 45 and 54 years, 65 years and above, and finally by those between the ages of 55 and 64 years. These are represented by 38.30%, 23.30%, 17.70%, 12.10%, 4.80%, and 3.8%, respectively, of the sampled respondents (Table 4).
It is conceived that there is a negative correlation between monthly income of respondents and their zones’ vulnerability levels, as well as their educational level and their zones’ vulnerability levels.
In Port Harcourt metropolis, majority (15.40%) of the respondents earn N50,000 and above monthly, and this is followed by those who earn between N35,000 and N39,000, whereas only 2.70% of the respondents earn between N5,000 and N9,000 monthly. This shows that only 2.70% of the respondents live below the poverty line of $2 per day (Table 5).
On average, in Port Harcourt metropolis, literacy level is high, as 47.6% of the respondents hold either HND/BSc, MSc, or PhD, whereas 30% and 20.6% hold OND/NCE and WAEC/SSCE, respectively. Only 1.8% hold FSLC as their highest educational qualification (Table 6).
Membership in a support network improves social capital of members and thereby, their resilience. However, there is an inverse relationship or negative correlation between group membership of respondents and their zones’ vulnerability level. In Port Harcourt metropolis, 70.5% respondents belong to a group and 29.5% do not (Table 7).
A high percentage of respondents have never received relief materials or assistance of any form to help them recover from the shock of flood. This is believed to have a direct negative effect on the vulnerability levels of the individual zones. On average, in the study area, only 34.2% of the respondents indicated that they received assistance of any kind, whereas 65.8% did not (Table 8).
The ownership of radio/TV/phone is a measure of access to technology, and this is necessary as a means through which information on impending flood hazards could be disseminated. The data obtained (Table 9) indicate that only 2.1%, 2.2%, and 4.0% do not have access to either of these technological devices in Zones C, K, and M, respectively. All the respondents in other zones either own a radio set, television set, or phone. This indicator was among the least factors that determined the vulnerability levels of zones because the number of respondents without access to either radio or TV or phone did not vary significantly across the zones.
The quality of housing structure influences the degree of damage of flooding. Analysis of the collected information revealed that majority of the respondents live in houses constructed with concrete rather than zinc or wooden houses. Only 2% and 4% of the respondents in Zone M indicated that they live in houses constructed with zinc and wood, respectively (Table 10).
Sensitivity and Exposure Indicators
Frequency of flood has to do with how often flooding occurs in the various zones. It is however conceived that the more frequently floods occur in a zone, the higher that zone’s vulnerability level. It could be ascertained from Table 11 below that flooding is a problem in Port Harcourt metropolis because on average, only a few persons (11.7%) indicated that flooding occurs rarely, whereas 46.50% and 19.3% informed that floods occur whenever it rains and throughout the rainy season, respectively. In terms of severity of floods, floods experienced in the study area are moderate with 37.5% indicating this. The percentage of respondents who indicated that the intensity of the flood experienced is severe and mild are 35.4% and 27.1%, respectively (Table 12).
Respondents’ Perception of Frequency of Floods in Port Harcourt Metropolis (%).

Source. Fieldwork (2011).
Severity of Floods Experienced in Port Harcourt Metropolis as Perceived by Respondents (%).

Source. Fieldwork (2011).
Pre-flood awareness influences the place where people reside, flood preparedness, and thereby their exposure to flooding. Therefore, the higher the number of respondents with high flood perception, the lower their zones’ vulnerability levels (holding every other factor constant). In Port Harcourt metropolis, the highest proportion (36.2%) of the respondents indicated that they had little awareness of flood, which is followed by those who were fairly aware of flood events (29.2%). The next is the group that indicated that they were not aware at all (18.6%), and the minority (16.0%) indicated that they were highly aware (Table 13). There is also a direct relationship between past flood experience and vulnerability level. The majority of the respondents who had experienced flood in the last 6 months reside in Zones C, H, K, L, and M representing 63.8%, 68.1%, 79.1%, 80.0%, and 87.8%, respectively, of the total number of responses in the zones (Table 14).
Pre-Flood Awareness of Respondents in Port Harcourt Metropolis (%).

Source. Fieldwork (2011).
Past (6 months) Flooding Experience of Respondents in Port Harcourt Metropolis (%).

Source. Fieldwork (2011).
The location of houses in terms of their proximity to major rivers or creeks gives a measure of exposure to flood hazard. Relatively, Zone K recorded the mean shortest distance of any of its dwelling units to a river, whereas Zone D recorded the farthest (Table 15). With respect to the sampled population in all the zones and the location of houses, measurement results show that 39.32% of the respondents reside in zones located between 125 m and 360 m away from a major river. The percentage of respondents who are residing in zones that are located about 2,200 m to 2,700 m away from a major water body is 8.16%. The percentage of respondents who live in zones situated about 3.6 km to 4.7 km away from a water body is 14.52%, and 22.18% reside in zones that are located more than 5.6 km away from a river. The result shows that more than one third of the respondents stay in zones that are exposed to flooding in terms of their proximity to a major river, creek, or stream. Table 15 below shows the mean proximity of dwelling units of respondents to a major water body.
Measurements of the Shortest Distance of Zones to a Major Water Body.
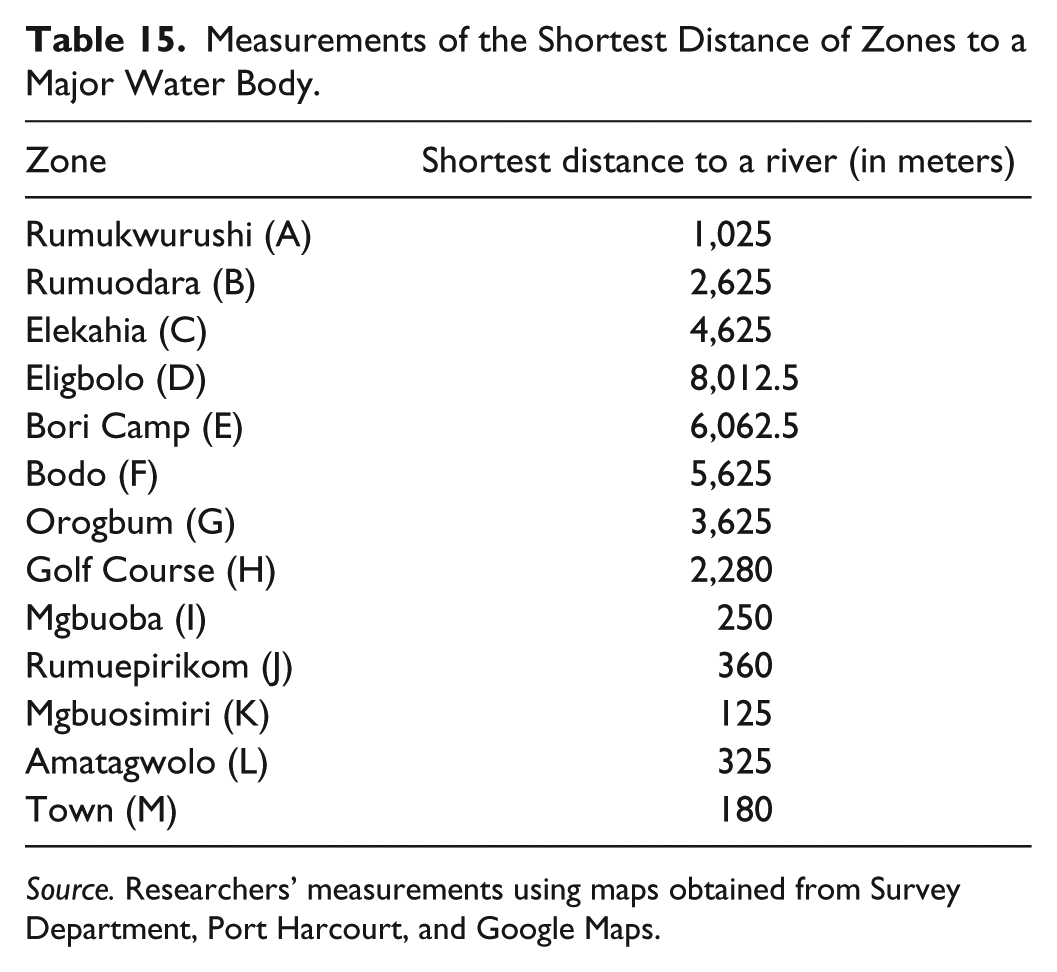
Source. Researchers’ measurements using maps obtained from Survey Department, Port Harcourt, and Google Maps.
How deep flood waters are in any zone has a positive correlation with its vulnerability level, in the sense that the deeper the flood waters, the more the damage and the vulnerability. About 49.2% respondents estimated the height of flood water to be between ankle and knee, 34.7% said it is often at knee length, 13.8% indicated it to be above knee length, and 2.3% informed it is often waist high in Port Harcourt metropolis (Table 16).
Depth/Height of Flood Water in Port Harcourt Metropolis as Perceived by Respondents (%).
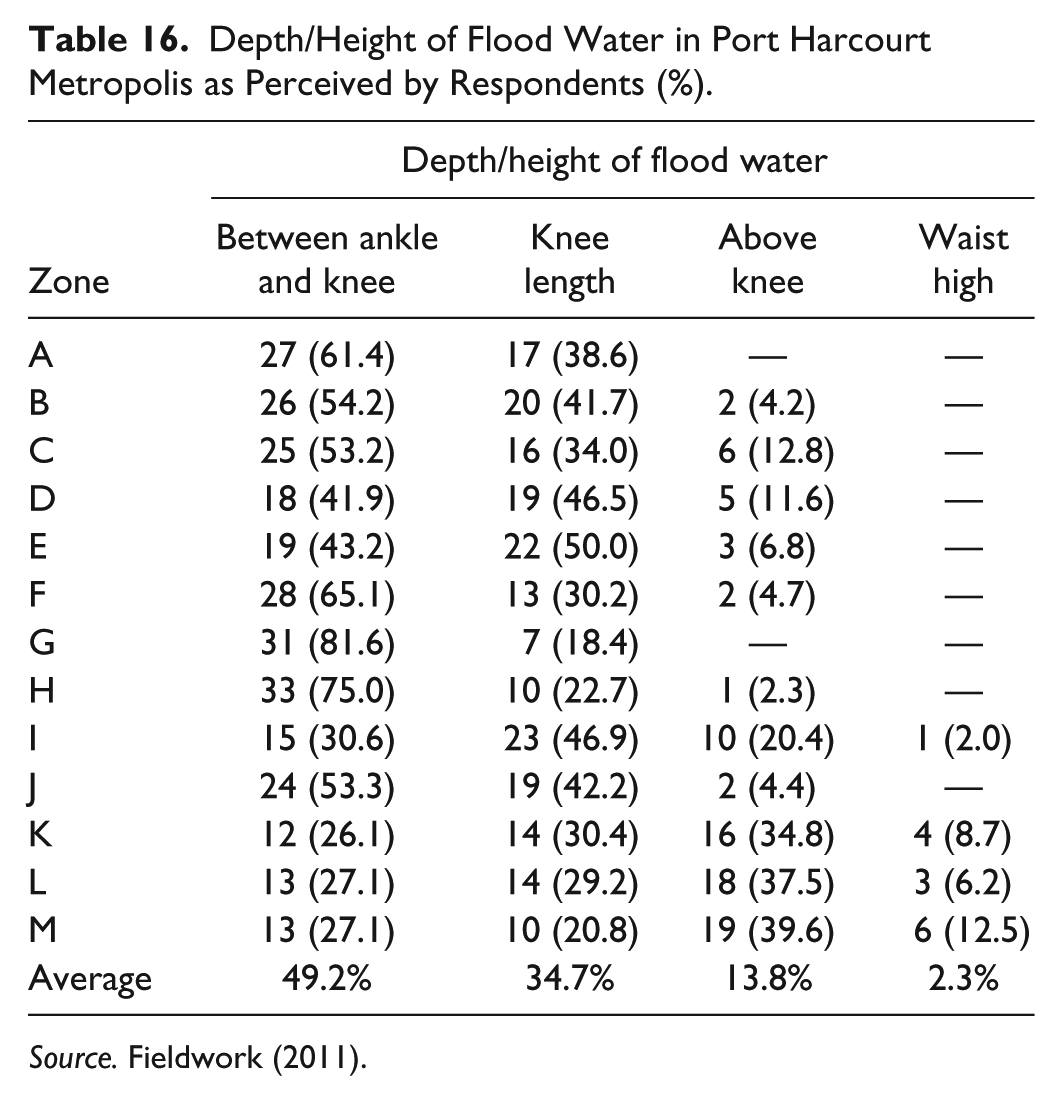
Source. Fieldwork (2011).
Results of the Vulnerability Indices to Flooding in Port Harcourt Metropolis
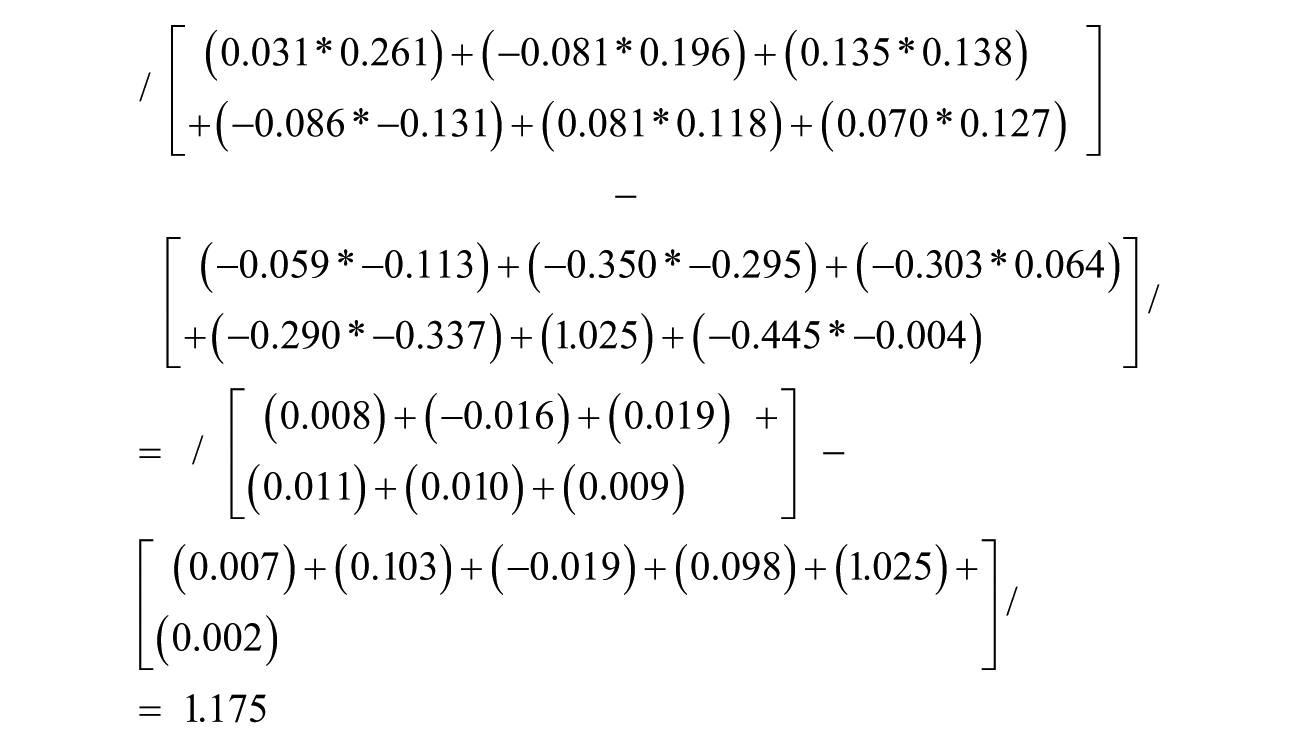
Using Equations 2 and 3, the vulnerability indices for the 13 zones were computed using the values in Tables 3 and 17 (derived from Tables 5-16). Table 18 shows the vulnerability indices for all the 13 zones that make up Port Harcourt metropolis. As indicated in the research methodology, factor scores from the first principal component were used to construct vulnerability index for each zone. For instance, the vulnerability index for Rumukwurushi (Zone A) is calculated as follows:
Correspondence Analysis Results of the Various Indicators.

Vulnerability Indices of the 13 Zones in Port Harcourt Metropolis.

Source. Fieldwork (2011).
Note. The lower the vulnerability index values, the higher the vulnerability of the zone.
The vulnerability indices calculations for the rest of the zones followed the same procedure (Table 18).
Table 18 reveals that Zone K (Mgbuosimiri) is the most vulnerable among all the zones followed by Zone J (Rumuepirikom), Zone I (Mgbuoba), Zone L (Amatagwolo), Zone M (Town), Zone A (Rumukwurushi), Zone B (Rumuodara), Zone G (Orogbum), and Zone H (Golf Course). These zones recorded a vulnerability index ranging from 0 to 3. The least vulnerable zone is Zone D (Eligbolo), followed by Zone E (Bori Camp), Zone F (Bodo), and Zone C (Elekahia), whose vulnerability indices are between 4 and 8 (Table 19).
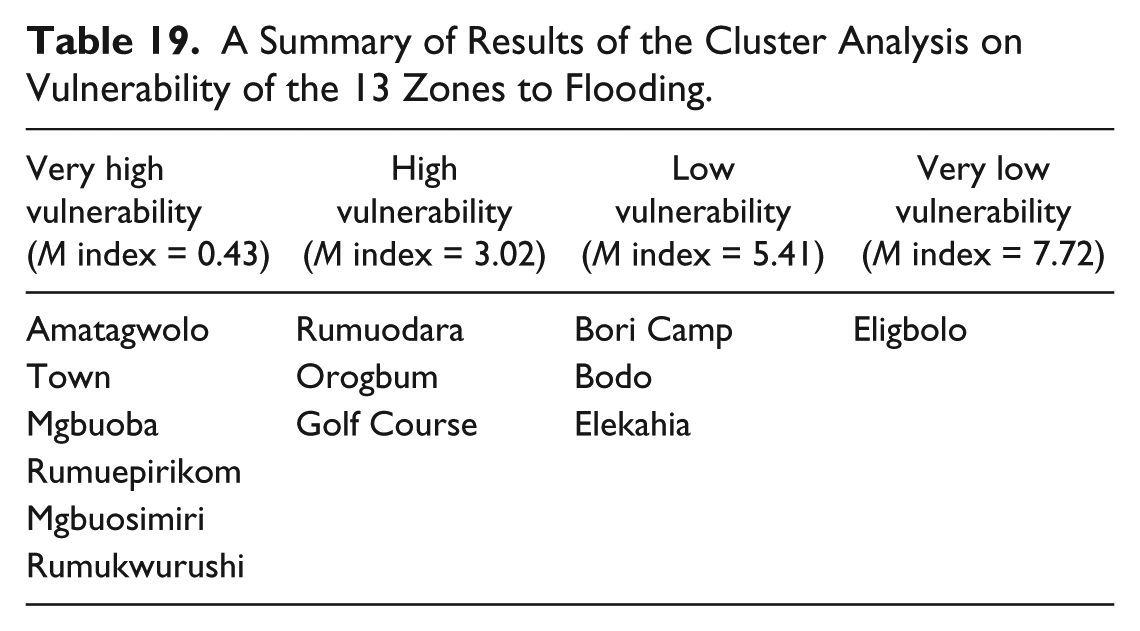
A Summary of Results of the Cluster Analysis on Vulnerability of the 13 Zones to Flooding.
Classification of the Vulnerability Indices of the Thirteen Zones in Port Harcourt Metropolis
The zones were grouped according to their similarity in degrees of vulnerability using average linkage cluster analysis method of classification. The grouping shows four clusters representing four different zonal vulnerability levels in Port Harcourt (Figure 4 and Table 19).

Dendrogram illustrating hierarchical clustering of the vulnerability indices of the 13 zones in Port Harcourt metropolis.
The dendrogram (tree graph) reveals that four clusters (vulnerability groups) were obtained with six zones in the first cluster; three zones in the second cluster; three zones in the third cluster, and only a zone in the fourth cluster.
Table 19 shows that Amatagwolo, Town, Mgbuoba, Rumuepirikom, Mgbuosimiri, and Rumukwurushi (i.e., Zones L, M, I, J, K, and A) have very high vulnerability levels with a mean index of 0.43, whereas Rumuodara, Orogbum, and Golf Course (Zones B, G, and H) have high vulnerability level with a mean index of 3.02. The above Zones are therefore known as the flood vulnerability “hotspots.” The table also reveals that Bori Camp, Bodo, and Elekahia (Zones E, F, and C) have low vulnerability level with a mean index of 5.41, whereas Eligbolo (Zone D) has very low vulnerability level with a mean index of 7.72.
Spatial Pattern of Flood Vulnerability Levels in Port Harcourt Metropolis
The mapped result of the cluster analysis shows that the spatial pattern of the vulnerability levels in Port Harcourt metropolis tends to increase toward the north west, south west, south, and north east, and decreases toward the central (Figure 5). This vulnerability map was generated using ArcGIS 10.0. The observed spatial pattern in the vulnerability levels of the zones as inferred from field investigations and data analyses is highly attributed to the differences in distance of these zones to major water bodies in Port Harcourt metropolis. Those zones (e.g., K, M, etc.) that are closer to water bodies recorded higher vulnerability levels than those farther away from major water bodies (e.g., Zone D; see Table 15). It is quite surprising that Rumukwurushi and Mgbuoba (Zones A and I) recorded a higher vulnerability than Elekahia (Zone C), which is closer to a water body than them. This indicates that other factors also influence flood vulnerability levels in study area.

Spatial variations in flood vulnerability levels in Port Harcourt metropolis.
Moreover, the zones in the first and second clusters (i.e., toward the north west, south west, south east, and north east of Port Harcourt metropolis) are highly vulnerable to flooding, because they have only few people who belong to an association/group; who received assistance/relief; and who had pre-flood awareness (see Tables 7, 8, and 13, respectively). In addition, their high vulnerability can also be attributed to having highest number of people who earn between N5,000 and N9,000 monthly and those who had experienced floods in the last 6 months (Tables 5 and 14, respectively). Those who earn between N5,000 and N9,000 monthly were considered poor as indicated in the methodology. The reverse is the case with the third and fourth clusters (the central of the study area), which is why they have relatively low vulnerability levels.
Recommendations
Sustainable Drainage Systems (SUDs)
A sustainable drainage system aims to mimic as closely as possible the natural drainage of an urban area to minimize the impact of urban development on the flooding and pollution of waterways. These may take the form of areas of vegetation such as grassy banks or green roofs, or natural water storage features such as ponds. Although the components can differ greatly, researchers have suggested that all SUDs use one or more of the following:
Encouraging uptake of water by the ground (“infiltration”),
Reducing peak flow rates of runoff (“attenuation”),
Transferring runoff in a controlled manner to other sites (“conveyance”),
Capturing water directly on-site for controlled discharge later (“storage”).
This approach would take all the zones into consideration.
Evacuation During Peak Periods and Building Low-Cost Houses
Well-structured emergency organization is vital to be able to cope with flood emergencies. Evacuation and rescue services prevent casualties. Flood fighting by temporary structures reduces the probability of damage. This type of risk prevention is of great importance for areas with great flood depth. Low-cost houses in less flood-prone areas in Port Harcourt metropolis should be built by the government where affected residents or evacuated victims especially from the flood vulnerability “hotspots” could stay temporarily during flood peak periods till dry season.
Therefore, National Emergency Management Agency (NEMA) should equally be equipped to evacuate victims during flood emergencies as well as distribute relief materials to relieve victims of sustained shocks. Observations and interviews show that NEMA had demonstrated a poor capability in managing flood disasters in Port Harcourt metropolis. Although, NEMA is a Federal parastatal, the Government of Rivers State can give subvention to this agency to help in times of flood emergencies.
Demolition of Illegal Structures
Structures that are built on the pathways of flood waters in all the zones should be demolished, and the Master Plan of the Greater Port Harcourt City Development Plan (GPHCDP) should be implemented. This would reduce the increased rate of uncontrolled urbanization/urban creep and decongest Port Harcourt City where affected people would be encouraged to relocate to unsaturated areas.
Awareness Creation/Sensitizing the People on Pre-Flood and Post-Flood Actions
Awareness and perceptions of a problem shape action or inaction on the problem (Speranza, 2010). Fieldworks and interviews revealed that most residents of Port Harcourt metropolis do not have in-depth understanding of flood problem and its implications. It is essential that residents of the study area recognize flooding as part of their environment. Thus, it is very important to explain the various causes, consequences, and things to be done to reduce the adverse effects of flooding through radio/TV programs. The integration of the knowledge of flood problems, prevention, and protection, as well as mitigation into Rivers State’s primary and secondary education programs, would also go a long way improving people’s resilience to flooding. Effective and efficient sensitization of the residents on early warning signs of floods and what to do before, during, and after flood episodes (i.e., preparing them for the worst case) would help reduce the damages caused by flooding in all the zones.
Monetary Compensation of Flood Victims
A compensation system should be established by the Rivers State Government to support the victims of flood disasters to restore their economic basis and their living conditions in due time. This would also help in alleviating non-insurable public damage.
Conclusion
This study analyzed the vulnerability to flooding in Port Harcourt, Nigeria, by creating vulnerability indices and comparing these indices across the 13 zones that make up Port Harcourt metropolis. The vulnerability analysis followed the IPCC (2007) definition of vulnerability, which gave room for adaptive capacity, sensitivity, and exposure indicators to be adopted. The integrated vulnerability assessment approach was adopted to analyze vulnerability in Port Harcourt metropolis, which combined the socio-economic and biophysical variables.
The calculated vulnerability indices range from 0 to 7 with 0 representing the highest vulnerability and 7 representing the lowest vulnerability. The vulnerability indices were grouped using cluster analysis, which revealed four clusters representing four different vulnerability levels, that is, very high, high, low, and very low in the study area, of which zones with very high and high vulnerability levels were termed the flood vulnerability “hotspots.” The identified flood vulnerability “hotspots” are Amatagwolo, Town, Mgbuoba, Rumuepirikom, Mgbuosimiri, Rumukwurushi, Rumuodara, Orogbum, and Golf Course (i.e., Zones L, M, I, J, K, A, B, G, and H). Bori Camp, Bodo, and Elekahia (Zones E, F, and C) had low vulnerability levels, whereas Eligbolo (Zone D) had very low vulnerability level. These were mapped, and the spatial pattern revealed that the vulnerability levels in Port Harcourt metropolis tend to increase toward the north west, south west, south, and north east and decrease toward the central, and the major determinant was the proximity of the 13 zones to a major river/stream/creek.
Finally, the study has demonstrated that some areas in Port Harcourt metropolis are indeed more vulnerable to flooding than others. Therefore, the vulnerability map produced from this study, which shows the spatial pattern of different flood vulnerability levels can be used for the reduction of damage potential by integrating its outputs into spatial planning and emergency planning in Port Harcourt metropolis.
Footnotes
Declaration of Conflicting Interests
The author(s) declared no potential conflicts of interest with respect to the research, authorship, and/or publication of this article.
Funding
The author(s) received no financial support for the research and/or authorship of this article.