
Abstract
Immunization is considered one of the most cost-effective public health interventions for reducing childhood morbidity, mortality, and disability globally. However, while global achievement of over 70% coverage rates was sustained in 1990s, wide variations exist between and within countries. In some developing countries, immunization rates increased substantially, but in sub-Saharan Africa, immunization rates plummeted, leaving millions of children vulnerable to life-threatening diseases. In Nigeria, coverage rates for routine immunization for all antigens still fall below 50%. The study examined the overall influence of household vulnerability dimensions, maternal health practices on childhood immunization status in Nigeria. The study used secondary data from 2013 Nigeria Demographic and Health Surveys (NDHS). The analytical weighted sample size was 5,824women of reproductive ages (15–49 years) with a live birth in the past 3 years, whose children were within age 12 to 23 months at the time of the survey. The data was analyzed using frequency distribution, chi-square test, and binary logistic regression. The results showed a decreasing regional variation in the proportion of fully immunized children from high of 23.6% in South-West, to a low of 9.1% in North-East. The overall household vulnerability status showed that children in more and most vulnerable households were 62% (OR = 0.38; p < .001; CI [0.32-0.46]) and 89%less likely (OR = 0.11; p < .001; CI [0.08-0.14]) to receive full vaccination compared with their counterpart in non-vulnerable households. The study revealed significant relationship between mothers’: (i) number of antenatal visits (OR = 1.66; p < .05; CI [0.25-1.77]); (ii) quality of antenatal care (OR = 2.61; p < .05; CI [1.45-4.67]); (iii) place of delivery (OR = 0.62; p < .05; CI [0.45-0.86]); (iv) assistance during delivery (OR = 0.41; p < .001; CI [0.28-0.57]); (v) time of postnatal check (OR = 1.81; p < .001; CI [1.49-2.19]) and full childhood immunization status.
Keywords
Background to the Study
Immunization is considered one of the most cost-effective public health interventions for reducing child morbidity, mortality, and disability across the world (World Health Organization [WHO], 2016b). Since the launch of Expanded Program on Immunization (EPI) in 1974, studies have confirmed preventive efficacy of immunization on illness, disability, and death including cervical cancer, diphtheria, hepatitis B, measles, mumps, pertussis (whooping cough), pneumonia, polio, rotavirus, diarrhea, rubella, and tetanus (Weil, 2016; WHO, 2016b). Globally, immunization currently averts an estimated 2 to 3 million deaths every year (UNICEF, 2015). An additional 1.5 million deaths could be avoided if global vaccination coverage improves (UNICEF, 2015; USAID, 2009). Between 1985 and 2011, studies showed that increase in measles and tetanus coverage alone was responsible for 3.7% fall in global under-five mortality (McGovern & Canning, 2015).
Full immunization requires a child receive full doze of Bacillus Calmette–Guérin (BCG) at birth or soon after, three doses each of pentavalent vaccine (DPT-Hep B-Hi-b) to prevent diphtheria, pertussis, and tetanus (DPT) and oral polio vaccine (OPV) vaccines at week 6, 10, and 14 with one dose of measles vaccine at 9 months (National Population Commission [NPC] & ICF International, 2014). Recently there was an introduction of new 10-valent pneumococcal conjugate vaccine (PCV) and rotavirus vaccine into the routine immunization schedule, and they are administered with the existing pentavalent vaccine (WHO, 2016b). It is recommended that children receive the complete schedule of vaccinations before their first birthday and that the vaccinations be recorded on a vaccination card that is given to the parents or guardians (Lawn et al., 2014; WHO, 2014, 2016b).
Despite the national and international commitment to global immunization coverage of 90% at national and district level, UNICEF report showed that an estimated 19.4 million infants worldwide are still missing out on basic vaccines, with an estimated 3 million children under 5 years dying annually from infectious diseases (UNICEF & WHO, 2013; WHO, 2016a). According to 2013 coverage estimates from WHO and UNICEF, more than 111 million infants globally received vaccines to protect them from deadly diseases. These contribute to 84% of the global children, with a significant 21.8 million of these infants as unvaccinated, among which 4.3 million (22%) are located in four countries (Democratic Republic of Congo, Ethiopia, Nigeria and South Africa) of the WHO African region. Also, the DPT analysis in 2013 revealed that of the target population of 32.2 million infants children, an estimated 8.2 million failed to receive their third dose of DPT vaccine. Almost 78% of the children who did not receive DPT3 are located in 10 countries (Chad, Democratic Republic of the Congo, Ethiopia, Kenya, Mozambique, Niger, Nigeria, South Africa, South Sudan, and Uganda) (WHO & UNICEF, 2013). This indicates that many sub-Saharan African countries still find it difficult to increase childhood immunization above 80% as the overall change in global average coverage with DPT3 was 1% (from 85 to 86%) between 2010 and 2015 (GAVI, 2016; WHO, 2016a).
Over the years, review of extant literature showed that performance of EPI has stagnated with interludes of declines and improvements in Nigeria. Many targets have remained un-met (coverage, elimination goals, eradication goals) and the overall progress of the 80% coverage achieved in immunization services during the Universal Childhood Immunization (UCI) days (1986–1990s) were short lived for all antigens (FBA, 2005), given an average of 25% for all basic immunization in 2013 (NPC & ICF International, 2014), as against MDG target of 90% nationally, with a minimum of 80% coverage at state level.
Several studies have shown that uptake of immunization services depends not only on provision of these services but other factors such as maternal knowledge, geographical accessibility, parent objection, immunization safety, mother’s educational level, community socioeconomic characteristics, and many other socio-demographic characteristics (Abdulraheem et al., 2011; Adeleye & Mokogwu, 2016; Anand & Bärnighausen, 2007; Antai, 2009; Ayebo & Charles, 2009; Kitamura et al., 2013; Odusanya et al., 2008). While some studies revealed inequitable access to immunization services, deficient vaccine supplies and equipment, problems of finance, procurement, cold-chain maintenance, staffing and management, others point to wider collapse in Nigeria’s primary health care system (Ayebo & Charles, 2009; FBA, 2005; Lambo, 2005). These research evidences suggest that successful implementation of immunization programs depends on multiple factors.
Although, biological, epidemiological, economic, and logistical related factors of vaccinations often attract rapt attention, while household variables and power relations factors had received limited attention. Currently, there is a poor understanding of how household vulnerability dimension (demographic, geographic, social, and economic) and maternal health practices influence childhood immunization in Nigeria. Therefore, this study is set to fill this gap by investigating the influence of household demographic, geographic, social, and economic vulnerability status as well as maternal health related practices on childhood immunization in Nigeria. Understanding the influence of household vulnerability dimension and maternal health related practices on childhood immunization status is important for the development of intervention programs, strategies, and modalities to optimize vaccination coverage and improve childhood immunization in Nigeria.
Objectives of the Study
General objective: To investigate the relationship between household vulnerability dimensions, maternal health practices and childhood immunization status in Nigeria.
Specific objectives:
The specific objectives of the study are to
(a) examine the influence of sub-national household vulnerability variations on childhood immunization status in Nigeria;
(b) examine the influence of maternal health practices (first time of antenatal care, number of antenatal care received, place of antenatal care, quality of antenatal received, and place of delivery) on childhood immunization status in Nigeria; and
(c) investigate the overall influence of household vulnerability dimensions, maternal health practices on childhood immunization in Nigeria.
Conceptual Framework of Household Vulnerability Dimensions, Maternal Health Practices, and Childhood Immunization in Nigeria
As dipicted and explained in Figure 1 below, this study adopted vulnerability theory (Fineman, 2008) to examine the effect of household vulnerability dimensions and maternal health practices on childhood vaccination status in Nigeria. The central tenet of the vulnerability theory is that “all human beings are vulnerable and prone to dependency ‘both chronic and episodic’, and the state therefore has a corresponding obligation and responsibility to reduce, ameliorate, mitigate and compensate for that vulnerability” (Fineman, 2008).
The theory highlights different ways of analyzing vulnerability known as, socio-economic, biophysical, and integrated approach. The socio-economic assessment approach focused on the socio-economic and political status of individuals or groups. The theory posits that individuals in a country, state, or community vary in terms of exposure, access to information/technology, education, gender, wealth, health status, access to credit, social capital and political power, and so on, which formed the foundation for variations in vulnerability levels (Deressa et al., 2008; Füssel, 2007). Therefore, vulnerability is defined as an existing state within a system before it encounters a hazard event (Kelly & Adger, 2000), and vulnerability is shaped and established by the society due to institutional and economic dynamics. The socio-economic approach focuses on identifying the adaptive capacity of individuals in a state or communities based on their internal characteristics which could be demographic, geographic, social, economic, or physical. This theory draws on the work of economist Amartya Sen, whose conception of “entitlements” established the groundwork for “asset-based analysis focused on livelihoods” (Alwang et al., 2001). Assets include items such as “labor, human capital, housing, household relations, and social capital (Moser, 1998), and they contribute to resilience.”
Therefore, before discussing further the conceptual framework of the vulnerability theory, we need to be very clear on how vulnerability is defined in this study due to different dimension and conceptualization of vulnerability. This study conceptualized household vulnerability as the presence of factors in the households classified as demographic, geographic, social, and economic that place a child at risk of not being immunized or partially immunized. These factors also affect household ability to cope with immunization schedule (resilience). Kureya in his 2013 work conceptualized vulnerability as the “existence of factors that predisposes households to the risk of becoming food insecure or malnourished,” assessed on the levels of “external vulnerability.” Kureya defined “external vulnerability” as “exposure to external shocks or hazards; and ‘internal vulnerability’ as the capacity to cope with or withstand those shocks (resilience)” (Kureya, 2013). Therefore, this study conceptualized “external vulnerability” as childhood exposure to preventable diseases which is assumed constant and “internal vulnerability” refers to households capacity (“presence of coping factors”) to prevent, resist, and cope by sustaining immunization schedule for a child.
The conceptual framework for this study in Figure 1 indicates the pathway through which household vulnerability dimensions and maternal health practices operate to influence childhood immunization. The demographic vulnerability indicators such as mothers’ age, marital status, mothers/partners’ level of education, parity, and birth interval have been identified has coping/resilient factors having a direct or indirect impact on childhood immunization status. These variables are included for computation of household demographic vulnerability index in order to examine its combined influence on childhood immunization status.

1.0: Conceptual framework showing the interrelationships between household vulnerability dimension, maternal health practices, and childhood immunization in Nigeria.
Geographic Vulnerability indicators are included in the computation of GDI to access its impact on childhood vaccination status. Place of residence, distance to health facilities, and mother’s experience of difficulty in accessing health facilities may stand as major resilient factors or stressors to childhood immunization uptake in Nigeria. Studies have shown that mothers’ experience of difficulty in accessing health facility with reference to place of residence and distance to health facilities are significantly associated with childhood immunization (Owais et al., 2011; Singh, 2013). As revealed in some studies (Abdulraheem et al., 2011; Chidiebere et al., 2014; Okwaraji et al., 2011), children whose mothers experience difficulties in reaching health facilities are less likely to complete full schedule of vaccination.
Social vulnerability indicators are included to compute Social Vulnerability Index (SVI) and assess its influence on childhood immunization. For instance, long debated is the significant effect of the household head sex. On one hand, due to the decision-making power autonomy, female-headed households are more likely than their male counterparts to have a positive influence on health-seeking behavior (Wickrama & Keith, 1990). As a result of their position, female household heads have more control over the household’s resources which could be earmarked for seeking health services (Kishor & Neitzel, 1997; Momsen, 1991). On the other hand, female-headed households are often poorer than male-headed households (Kishor & Neitzel, 1997). Thus, their lower economic status might pose a burden in terms of seeking health care services. Likewise, Male headed household in term of single parent can have adverse effect on the children with regards to time constraints in seeking health care for the children.
Also, household structure and women autonomy has been included in this study among other variables to compute Household Social Vulnerability Index because “household is usually the fundamental social unit in which men, women, and children live.” In the theoretical models of the family proposed by the new home economics (Becker, 1981), “the household is often conceptualized as a cohesive unit for production and consumption.” Hence, household structure is frequently and longed been identified as a primary determinant of children’s economic and social well-being (Lloyd & Blanc, 1996; Louat et al., 1993). Early empirical studies have shown that family structure is an important determinant of child health outcomes (Amato & Bruce 1991; Astone & McLanahan, 1991; Thompson et al., 1994).
Thus, the link between family structure and child health may reflect variation in the time and energy limits allotted by the household for health care. These in turn showed variation in the illness management practices or the use of health care services by the household. According to Corell (1983), “the cost of taking a child for treatment within health care facility is high in single-adult or nucleated households.” In the United States, it has also been argued that children may receive less time and attention in single parent families (Astone & McLanahan, 1991; Corell, 1983). It may therefore be argued that the number of adults in the household is central to the management of child health; the consequences of growing up in an extended household would be less severe than the consequences of growing up in a nuclear household.
Women autonomy on health decision making is included since studies have shown that women with greater autonomy to move are more likely to receive antenatal and delivery care. This implies that women’s autonomy, like education and economic characteristics, are equally important. A study by Kishor (2000) found women’s autonomy to be a significant explanatory factor in child survival and child health in Egypt having removed bio-demographic and socio-economic influences.
Lastly, economic vulnerability indicators are included to compute Economic Vulnerability Index (EVI) as studies have shown relationship between household’s financial stability and use health care facilities. Also, studies have shown that socioeconomic nature of communities influences the health seeking behavior of individuals; children of mothers from socioeconomically disadvantaged communities are more at disadvantage to have full immunization (Adedokun et al., 2017; Antai, 2009).
Indicators of maternal health practices (time of 1st ANC visit, No of ANC visit, Place for ANC visit, Place of delivery and Quality of ANC received) has been linked with childhood immunization. Previous studies had revealed that “mothers’ utilization of health care facilities before or during pregnancy proportionately increases the chances that mothers would access subsequent health care services for their children, such as institutional delivery and immunization” (UNICEF & WHO, 2013). Therefore, as hospital delivery has been correlated with maternal and child health outcomes, it is assumed by this study that maternal health related practices with reference to time of first ANC visit, No of ANC visit, Place for ANC visit, Quality of ANC received, and Place of delivery could also be an important determinant of childhood immunization status in Nigeria.
Thus, this study considers four major dimensions of vulnerability that could make a household vulnerable or resilient, place a child at risk of Vaccine Preventable Diseases (VPD), and make household unable to cope with immunization schedule. The causes and extent of vulnerability can be understood only by the analysis of dimension-wise vulnerability indices. The dimension identified by this study cut across demographic, geographic, social, and economic, to build the Household Vulnerability Index (HVI).
Methodology
The study design was cross-sectional using secondary data. The secondary data was obtained from the Nigeria Demographic and Health Survey (NDHS) dataset. The 2013 NDHS collected a nationally representative data on 38,522 women age 15 to 49 and 17,359 men age 15 to 59 in the entire country. Data were collected using questionnaires that were administered by conducting face-to-face interviews. Immunization information was collected through two medium “vaccination cards and mothers’ verbal reports” to cover households’ socioeconomic characteristics, reproductive history, nutrition, immunization, and HIV/AIDS among others. Therefore, all relevant independent variables were selected, recoded, and redefined into household vulnerability dimensions (demographic, geographic, social, and economic) and maternal health related practices.
Also, on outcome variable, the interviewers asked mothers to present the vaccination cards in order to obtain vaccination dates. In the absence of vaccination cards, such mothers were asked to recall the vaccination administered to their children. Details of the data collection processes can be accessed online (NPC & ICF International, 2014). The target populations for this study were mothers of children aged 12 to 23 months successfully interviewed during the 2013 NDHS survey. Thus, from the sampling frame of 31,828 women interviewed, after excluding women age 15 to 49 years who had not had at least a child within the last 3 years and whose children are not within age 12 to 23 months at the time of interview, the analytical sample size for the study was 5,824 after applying the sampling weighting factors.
Data Analysis
The data was analyzed using Stata 12 version. The analyses were in three stages: univariate, bivariate, and multivariate analysis. For national representativeness, all relevant variables in this study were adjusted with the sample weight factor at the three level of analysis. This was done through the preparation of Do-file for the analysis.
Computation Procedure for Household Vulnerability Index (HVI)
Based on the dimension of household vulnerability under consideration and factors under each dimension, the household vulnerability index was derived using a multidimensional approach to quantitatively categorize households into vulnerability levels (Costa, 2002).
The formula was adapted from Costa (2002) and modified as follows:
Considering the population (N) made up of n households (hh) (N = {hh1, hh2, hh3 . . . hhn}), v is a subset of v households with some degree of vulnerability (internal vulnerability/coping factors).
Break down the vulnerability (X) into specific dimensions (n), and give a corresponding weight (Wi, i = 1, . . . , n) to each dimension. The weights in this study correspond to score of internal factors divided by number of internal factors component of vulnerability.
The vulnerability of any given household (hh i i = 1 . . . n) to the dimension of external factor (VPDs) (jth j = 1 . . . n) can be expressed as Xij, given a value between 0 and 1. Each Xij denotes the degree of vulnerability of household i to the jth external factor (VPDs), which is a function of the number of internal/coping factors in each dimension (Si). Thus equating Xij = Si gives a corresponding number of internal/coping factors in each dimension.
The sum of the weighted score and number of internal factors of vulnerabilities across all dimensions give the household’s total vulnerability (HVI) to a specific external factor (VPDs).
The fundamental assumption is that “all households exist in a fairly homogenous context and are vulnerable at different levels.”
Thus, the equation for HVI was derived as:

n = number of coping factors,
C = 1 (constant exposure to VPD)
Source: adapted from Costa (2002)
Therefore, each dimension of the Household Vulnerability Index (HVI) was categorized into three based on the household vulnerability dimensions as non-vulnerable, more vulnerable, and most vulnerable.
Study Findings
Distribution of Respondents by Household Vulnerability Dimensions
Table 1 shows the percentage distribution of respondents by household demographic vulnerability index. The overall analysis of household vulnerability index computed from demographic, geographic, social, and economic vulnerability indices showed that about one-third (29.5%) of the households were not vulnerable, 42.5% were more vulnerable, and 27.9% were in most vulnerable category, that is, most of the households were in a more vulnerable status at the time of the survey.
Distribution of Respondents by Households’ Vulnerability Dimensions.

Source. Computed by author from 2013 NDHS dataset. available at https://www.dhsprogram.com/data/dataset_admin/login_main.cfm
Distribution of Respondents by Maternal Health Practices
Table 2 presents the percentage distribution of respondents by maternal health practices. The timing of first antenatal visit showed that more than one-third (36.9%) of the respondents did not attend any antenatal during the pregnancy of the index child.
Distribution of Respondents by Maternal Health Practices.
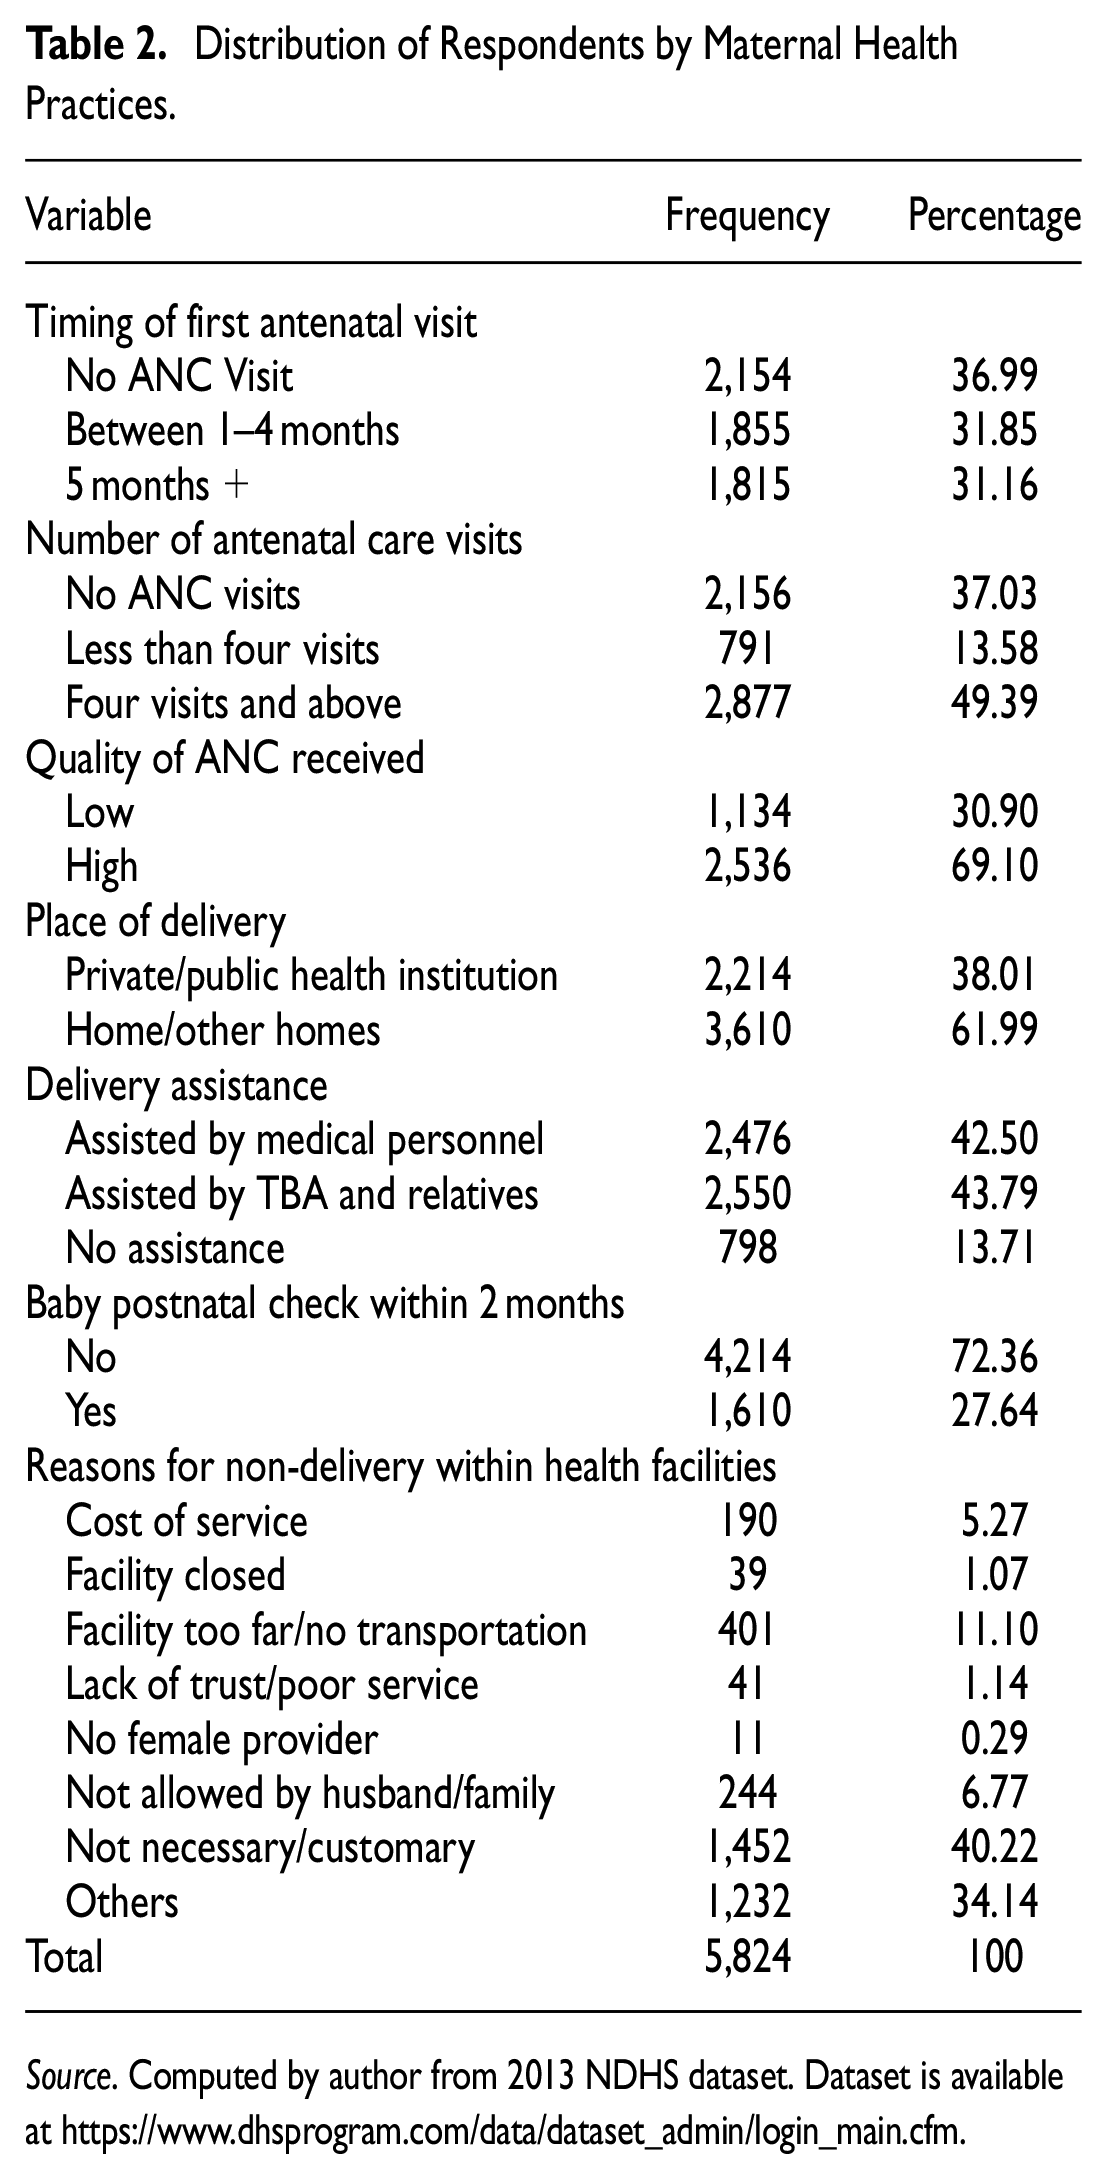
Source. Computed by author from 2013 NDHS dataset. Dataset is available at https://www.dhsprogram.com/data/dataset_admin/login_main.cfm.
Analysis based on number of antenatal care visits showed that more than one-third (37.0%) of the respondents had no antenatal care, nearly more than one-tenth (13.6%) had less than four visits during their recent pregnancy and close to half (49.4%) of the respondents had four visits and above in line with the recommended standard. Quality of the antenatal care received by those that attended ANC (with regards to iron supplement; taking of tetanus parasites drug; checked for blood pressure; had blood sample collected and examined; and had their urine sample collected and examined), showed that close to one-third (30.9%) of the respondents received low quality antenatal care, more than half (69.1%) of them received high quality antenatal care.
Also, a substantial number of respondents were delivered of their indexed child at homes/other homes (61.9%), while close to two-fifth (38.0%) were delivered within health care institutions (both private and public health care facilities). Meanwhile, highest percentage of respondents were assisted by TBA and relatives (44.0%) during the delivery, followed by 42.5% of others who were assisted by medical personnel, while 13.7% had self-delivery (assisted by no one).
Analysis on postnatal care showed that 72.4% of the babies did not receive postnatal care while 27.6% received postnatal care within 2 months of delivery. Reasons cited for failure to utilize the health facilities for their delivery were distributed as: not necessary (40.2%); too far or no means of transport (11.1%); husband or family didn’t allow (6.8%); too much cost (5.3%); lack of trust in facility or poor service (1.1%); facility not open (1.1%); no female health provider (0.3%); and others (34.1%).
Childhood Immunization Status of Children Age 12 to 23 Months
Table 3 shows the vaccination status of children age 12 to 23 months by each vaccine, the sources of information and completeness of all basic vaccinations. Generally, 22.8% of children age 12 to 23 months received full vaccination, 56.6% received partial vaccination, and one-fifth (20.6%) received no vaccination. Childhood vaccinations were received by fewer children for DPT 3 (38.6%), Polio 0 and 3 (46.9 and 54.1% respectively), and measles (42.1%), compared with vaccinations for BCG (51.2%), DPT 1 and 2 (50.4 and 45.5% respectively), and Polio 1 and 2 (76.4 and 70.0% respectively).
Percentage Distribution of Children Age 12 to 23 Months Who Had Received Vaccination, by Specific Vaccines, Sources of Information, and Completeness of All Basic Vaccinations.

Source. Computed by author from 2013 NDHS dataset. Dataset is available at https://www.dhsprogram.com/data/dataset_admin/login_main.cfm.
Note. 1, Polio 0 is the polio vaccination given at birth. 2, BCG, measles, and three doses each of DPT and polio vaccines (are the basic vaccines a child must complete by 12 months).
The data showed considerably minimal increase in the vaccination status among the children from the onset of age 12 to age 23 months. The proportion of children who received full vaccination at exactly age 12 slightly increased from approximately 21.0 to 23.0% relative to those who received full vaccination within the age 12 to 23 months. The same pattern was observed among children who were not vaccinated at all in which case the proportion of children vaccinated at exactly age 12 months slightly increased from 19.6 to 20.6%, relative to children who received vaccination within the age 12 to 23 months. Meanwhile, the proportion of children who received partial vaccination at exactly age 12 months decreased from 59.4 to 56.6% relative to children who received vaccination within the age 12 to 23 months.
By the sources of information, greater proportions of the children received the basic vaccines as documented through card compared to verbal report by mothers in cases of BCG (27 and 24.2% respectively), DPT 1 (26.3 and 24.1% respectively), DPT 2 (24.3 and 21.2% respectively), DPT 3 (21.6 and 16.9% respectively), and Polio 0 (25.5 and 21.5% respectively).
Bivariate Analysis
The bivariate analysis was carried out to describe the existence of relationships and its significance involving the household vulnerability dimensions, maternal health practices, and childhood vaccination.
Childhood Immunization Status by Sub National Regions
Table 4 presents the percentage distribution of childhood immunization by the sub-national regions. The study showed existence of variations in childhood immunization across the sub-national zones. A considerable proportion of children aged 12 to 23 months in the north zones (North Central, 11.7%; North East, 38.2%; and North West, 35.5%) had no vaccination when compared with their counterparts in south zones (South East, 3.4%; South South, 4.6%; and South West, 6.7%). Among the sub-regions, the highest proportion of children age 12 to 23 months who had full vaccination were in the South West (23.6%), followed by 19.6% in South East, 18.8% in South South, 15.2% in North Central, 13.7% in North West, and the least proportion of children who received full immunization were found in North East (9.1%).
Percentage Distribution of Childhood Vaccination Status by Sub-National Regions.

Source. Computed by author from 2013 NDHS dataset. Dataset is available at https://www.dhsprogram.com/data/dataset_admin/login_main.cfm
Relationship Between Sub-national Household Vulnerability Variations and Childhood Immunization Status
Table 5 presents the percentage distribution of sub-national household variability dimensions and childhood immunization status. The study showed that household overall vulnerability index consistently and significantly dropped the chances of receiving full immunization across all the sub-national regions. The proportions of children age 12 to 23 months who received full immunization consistently dropped from 38.5% among non-vulnerable households to 11.0% among most vulnerable households in North Central; 35.0% among non-vulnerable households to 4.1% among most vulnerable households in North East; 47.4% among non-vulnerable households to 2.9% among most vulnerable households in North West; 53% among non-vulnerable households to none (49.4%) among most vulnerable households in South East; 53.5% among non-vulnerable households to 25.7% among most vulnerable households in South South; and 42.5% among non-vulnerable households to none (11.0%) among most vulnerable households in South West.
Percentage Distribution of Children Age 12 to 23 Months Who Received Full Immunization Across Household Vulnerability Dimensions by Sub-National Regions.

Source. Computed by author from 2013 NDHS dataset. Dataset is available at https://www.dhsprogram.com/data/dataset_admin/login_main.cfm.
p < .05. **p < .01. ***p < .001.
Bold value indicates significant level.
The household vulnerability dimensions accounted for variations in the uptake of child immunization across the sub-national regions. The analysis revealed that different factors accounts for childhood immunization status in different regions. For instance, household economic vulnerability index was not significantly associated with childhood immunization in South East, South South, and South West respectively, whereas it is significantly associated and influence with childhood immunization status in other region.
Relationship Between the Household Vulnerability Dimension and Child Immunization
Table 6 presents the percentage distribution of the household vulnerability dimensions and child immunization status of children age 12 to 23 months. Overall, the data showed a significant relationship between household vulnerability status and uptake of child immunization (p < .001). The proportion of children age 12 to 23 months that received full immunization steadily dropped from high of 34.5% among children in non-vulnerable households to a low of 6.3% among children in most vulnerable households. The proportion of children who either received partial vaccination or none of the basic vaccination increased steadily with overall higher household vulnerability status: 54.2% for children from non-vulnerable household: 82.4% for those from more vulnerable households; and 93.6% for those from most vulnerable households.
Percentage Distribution of the Household Vulnerability Dimension and Child Immunization.

Source. Computed by author from 2013 NDHS dataset. Dataset is available at https://www.dhsprogram.com/data/dataset_admin/login_main.cfm
p < .05. **p < .01. ***p < .001.
In terms of household demographic vulnerability, the chances of receiving full immunization was significantly (p < .001) greater among children from demographically non-vulnerable households. The household demographic vulnerability status was significantly associated with decrease in the proportion of children age 12 to 23 months who received full vaccination as household demographic vulnerability status deepened: 37% for not vulnerable, 15.1% for more vulnerable, and 4.7% for most vulnerable.
Geographically, children of respondents who were at disadvantaged due to either place of residence or difficulties in accessing health care are at increased risk of not being immunized. Thus, household geographic vulnerability index was significantly (p < .001) associated with consistent decrease in the proportion of children age 12 to 23 months who received vaccination: 41.2% for the non-vulnerable households, 18.6% for more vulnerable households, and 8.3% for most vulnerable households. Also, proportion of children who received either partial vaccination or none of the basic vaccine is 10.0% point greater among children in most vulnerable (91.7%) household category when compare with their counterpart in geographically more vulnerable (81.4%) households.
By the social vulnerability index, more than one-third (37.5%) of children of respondents in non-vulnerable households received full immunization, compared with those in more vulnerable (18.7%) and most vulnerable households (16.7%). Likewise, larger percentage of children in socially more vulnerable and most vulnerable household either non-fully immunized or do not receive any of the basic vaccines: 81.4% for more socially vulnerable household; 91.7% for most socially vulnerable.
Economic vulnerability index was significantly (p < .001) associated with consistent decrease in the proportion of children who were fully immunized, that is, about 40% of children in economically non-vulnerable households, 20.1% in economically more vulnerable households and 6.7% of their counterparts in economically most vulnerable households received full immunization.
Analysis based on the household overall vulnerability index revealed a significant relationship (p < .001) between household vulnerability status and childhood immunization such that the chances of receiving complete immunization among children age 12 to 23 months steadily dropped from 34.5% in non-vulnerable households to 6.3% in most vulnerable households.
Relationship Between Maternal Health Practices and Child Immunization
The percentage distribution of maternal health practices and child immunization status are presented as depicted in Table 7. The data showed significant relationship (p < 0.001) between the maternal health practices and child immunization status among children age 12 to 23 months. By timing of the first antenatal visit, 37.8% of the children whose parents initiated first antenatal visit within first to fourth months (first trimester) of pregnancy were fully immunized, compared with 27.1% of their counterparts whose mother initiated the first antenatal visit within 5 months and above of pregnancy. The chances of full immunization consistently increase with an increase in the number of antenatal care visits by mothers.
Percentage Distribution of the Maternal Health Practices and Child Immunization.

Source. Computed by author from 2013 NDHS dataset. Dataset is available at https://www.dhsprogram.com/data/dataset_admin/login_main.cfm
p < .05. **p < .01. ***p < .001.
Also, number of antenatal care visits was significantly (p < .001) associated with childhood vaccination status. The proportions of children age 12 to 23 months who received full immunization increased from 4.7% among respondents who had no antenatal care to 36.5% among respondents who had four antenatal visits and above. Likewise, the proportion of children who either received partial vaccination or none of the basic vaccine decrease by 10.0% point between respondents who had no antenatal care and about 20.0% point between respondents who had less than four antenatal visit (81.8%), and those who had more than four antenatal visit (63.8%)
In terms of the quality of care received during the antenatal care, the chances of receiving full immunization was significantly (p < .001) greater among children whose respondents received high quality antenatal care (38.0%). That is, children of mothers who received tetanus injection, iron supplement, tetanus parasite drug, blood pressure check, blood sample collected and examined, and those whose urine sample were subjected to tests, were more likely to receive full vaccination, compared with their counterparts who received low quality antenatal care (10.9%). Overall, the chances of receiving full immunization increased steadily from 10.2% among respondents who received low quality care to 38.0% among respondents who received high quality care.
Place of delivery was significantly (p < .001) associated with childhood vaccination status. This study shows that about half (43.3%) of respondents who had delivery at public/private health institution had their children fully immunized, compared with 10.2% of respondents who delivered at home/other homes. More than half (56.7%) of children who were delivered within public/private health institutions received partial or none of the basic vaccines.
In addition, delivery assistance was found to be significantly (p < .001) associated with childhood immunization. About half (41.8%) of children whose mothers were assisted by medical personal during delivery received full immunization, compared with 9.5% of their counterparts whose mothers were assisted by TBA and relatives and 6.5% of children whose mothers had no assistance during delivery.
With respect to postnatal check, the findings showed a significant (p < .001) relationship between postnatal check within 2 months of delivery and childhood vaccination.
The children of respondents who received postnatal checkup, compared with those without postnatal checkup, had greater chances of receiving full immunization (42.8 and 15.2% respectively). The proportion of children who had full immunization varied based on reasons cited by respondents for non-delivery within health care facilities. Respondents whose husbands did not allow to go to health facilities had the least proportion of children being fully immunized (4.8%), followed by those whose reason was “facilities too far/no transport” (6.4%), “not necessary/customary” (7.5%), others (12.3%), facility not open (14.8%), no female provider (15.2%), and too much cost (17.4%).
Multivariate Analysis of the Relationship Between Household Vulnerability Dimension, Maternal Health Practices, and Likelihood of Full Childhood Immunization
The multivariate analysis was carried out using the binary logistic regression. The outcome variable was childhood immunization status of children age 12 to 23 months. This variable was dichotomized into two as non-full and full. The odds ratios (OR) and the associated probability values (p-values) of full child immunization were reported by the household vulnerability dimensions and maternal health practices.
Binary Logistic Regression of Sub National Variation in Household Vulnerability Status on Childhood Immunization
Findings from regression models I showed that variation in vulnerabilities across sub national region exerts significant influence on likelihood of childhood immunization among children age 12 to 23 months in the study. The analysis revealed that the odds of full vaccination among non-vulnerable households is significantly (p < .05) higher in the four regions such as North West (OR = 1.44; p < .001; CI [0.75-2.75]), South East (OR = 1.86; p < .01; CI [1.19-2.90]), and South South (OR = 1.84; p < .05; CI [1.15-2.91]) with exception of South West (OR = 1.18; p > .05; CI [0.78-1.77]) and North East (OR = 0.86; p < .05; CI [0.48-1.54]) where the likelihood of childhood immunization is lower when compared with likelihood of full childhood immunization in the North Central. Across the sub national regions children from non-vulnerable households are almost twice more likely to be vaccinated than their counterparts in North Central (Table 8).
Binary Logistic Regression Models I for the Likelihood of Full Immunization Among Children Aged 12 to 23 Months by Sub National Vulnerability Status.

Source. Computed by author from 2013 NDHS dataset. Dataset is available at https://www.dhsprogram.com/data/dataset_admin/login_main.cfm
p < .05. **p < .01. ***p < .001.
Binary Logistic Regression of Household Vulnerability Dimensions and Maternal Health Practices on Childhood Immunization
The odds ratio from binary logistic regression models II–IX for the likelihood of childhood immunization among children age 12 to 23 months are presented as shown in Table 9. Model II-VI was built with different household vulnerability dimensions such as Household Demographic Vulnerability Index (HDVI), Household Geographic Vulnerability Index (HGVI), Household Social Vulnerability Index (HSVI), Household Economic Vulnerability Index (HEVI), and overall Household Vulnerability Index (HVI). Model VII was built with six sub national regions; Model VIII was built with the maternal health practices; and model IX was built with household vulnerability dimensions and maternal health practices as adjusted model
The results from model II–VIII showed that household Demographic, Geographic, Social, and Economic vulnerability exert significant influence on likelihood of full childhood vaccination among the children age 12 to 23 months. The odds ratio of full immunization among the children dropped as the household demographic, geographic, social, and economic vulnerability increases. Thus, children in demographically more and most vulnerable households are less likely to be fully immunized (OR = 0.27; p < .000; CI [0.23-0.33] and OR = 0.12; p < .000; CI [0.09-0.15]) when compare to their counterparts in demographically non-vulnerable households. The odds of full immunization dropped among geographically more vulnerable households by 67% (OR = 0.33; p < .01; CI [0.51-0.88]) and geographically most vulnerable households by 87% (OR = 0.13; p < .001; CI [0.28-0.63]), when compared with the likelihood of immunizing children from geographically non-vulnerable households.
Also, children age 12 to 23 months found in socially more and most vulnerable households were 62 and 66% less likely (OR = 0.38; p < .01; CI [0.32-0.46] and OR = 34; p < .001; CI [0.26-0.42]) to receive full immunization respectively than their counterparts found in socially non-vulnerable households. The same pattern was observed for household economic vulnerability index in model V. Children age 12 to 23 months found in economically more vulnerable and most vulnerable households were 21 and 7% less likely (OR = 0.79; p > .05; CI [0.60-1.04] and OR = 93; p > .05; CI [0.28-3.10]) to receive full immunization than their counterparts found in economically non-vulnerable households.
Overall, the odds ratio of full childhood immunization among children age 12 to 23 months dropped steadily with the overall household vulnerability index as the analysis revealed that children in the more vulnerability households were 62% less likely (OR = 0.38; p < .001; CI [0.32-0.46]) and children in the most vulnerable households were 89% less likely (OR = 0.11; p < .001; CI [0.08-0.14]) to receive full immunization compared with their counterpart in non-vulnerable households.
The results from model VIII revealed significant predictors of childhood immunization to be timing of first antenatal visit, quality of antenatal care received, place of delivery, delivery assistance, and baby postnatal checkup within 2 months of delivery. Children whose mothers initiated first antenatal care within the first trimester (1–4 months) are more likely to be fully vaccinated (OR = 2.63; p < .05; CI [0.97-7.12]) as well as children whose mother initiated first antenatal care after first trimester or within 5 months and above (OR = 2.09; p < .05; CI [0.67-0.97]), compared with children whose mother did not received any antenatal care. Children of mothers with more than four antenatal care visits were almost twice more likely to be fully immunized (OR = 1.66; p < .05; CI [0.25-1.77]) than their counterparts whose mothers had less than four antenatal visit (OR = 1.46; p < .05; CI [0.17-1.27]) or do not receive any antenatal care during pregnancy.
Considering the quality of antenatal care received, the odds of full immunization among children age 12 to 23 months was 2.61 times greater among children whose mothers had high quality care (OR = 2.61; p < .05; CI [1.45-4.67]), relative to their counterparts whose mothers had low quality antenatal care. Also, respondents who delivered at home/ other homes were 38% less likely to have their children vaccinated (OR = 0.62; p < .05; CI [0.45-0.86]) when compared with their counterparts who were delivered at private/ public health institutions.
Likewise, respondents who were assisted by TBA and relatives were 59% less likely (OR = 0.41; p < .001; CI [0.28-0.57]) as those who had no assistance were 71% less likely (OR = 0.29; p < .001; CI [0.18-0.46]) to have their children vaccinated, when compared with their counterparts assisted by medical personnel. Finally, respondents who received postnatal checkup within 2 months of delivery were 81% more likely to have their babies vaccinated (OR = 1.81; p < .001; CI [1.49-2.19]) relative to those who did not receive postnatal checkup within 2 months of delivery.
Adjusted Model IX
Results from joint effects of the household vulnerability dimensions and maternal health practices in model IX revealed the most significant predictors of full immunization to be household demographic, geographic, economic vulnerability status, quality of antenatal care, place of delivery, delivery assistance and baby postnatal checkup within 2 months of delivery. The significant relationships that existed in the previous unadjusted model but not in the present adjusted model may be as a result of isolated effects of these variables and non-interaction among the variables.
Here, the adjusted binary logistic regression revealed that respondents in demographically more vulnerable households were less likely to have their children vaccinated compared with those in demographically non-vulnerable households (OR = 0.65; p < .05; CI [0.51-0.83]). Geographically, mothers from more and most geographically vulnerable households are significantly less likely to fully vaccinate their children (OR = 0.72; p < .01; CI [0.58-0.90]) and (OR = .58; p < .01; CI [0.40-0.83]) respectively.
The binary logistic regression also revealed a significant (p < .05) influence of household economic vulnerability status on full childhood immunization. Children from more and most economically vulnerable households are significantly 25.0% (OR = 0.85; p < .05; CI [0.68-1.07]) and 54.0% (OR = 0.46; p < .05; CI [0.33-0.65]) less likely to be immunized than their counterparts in economically non-vulnerable households.
The logistic regression of the overall household vulnerability status on childhood immunization revealed a significant influence such that children from more and most vulnerable households are significantly less likely to be immunized (OR = 0.87; p < .05; CI [0.62-1.23]) and (OR = 0.82; p < .05; CI [0.44-1.55]), when compare with their counterparts in non-vulnerable households.
With regards to sub regional variation in childhood immunization, findings form logistic regression in model VII showed a significant variation in childhood immunization across the six sub national regions. The result showed that children in South East (OR = 2.78; p < .001; CI [1.89-4.07]), South South (OR = 2.25; p < .001; CI [1.53-3.29]), and South West (OR = 1.91; p < .001; CI [1.34-2.74]) are significantly twice more likely to be immunized compared to their counterparts in North Central, North East, and North West. Also, in the northern zone, children in North East (OR = 0.41; p < .001; CI [0.27-0.63]) and North West (OR = 0.29; p < .001; CI [0.18-0.46]) are significantly less likely to receive full immunization when compare with their counterpart in the North central.
In terms of quality of antenatal care, respondents who received high quality of care were twice more likely to have their children vaccinated relative to those who received low quality antenatal care (OR = 2.19; p < .05; CI [1.22-3.92]). Likewise, children whose mothers were delivered at home or other homes are 26% less likely to have full vaccination compared with their counterparts who were delivered within health care institutions (OR = 0.74; p < .05; CI [0.54-0.73]).
Delivery assistance also exerts significant influence on full childhood immunization such that mothers who were assisted by TBAs and relative are significantly 47% less likely to fully immunize their children (OR = 0.53; p < .001; CI [0.37-0.73]) and those without any assistance during delivery are 59% less likely to fully immunized their children (OR = 0.41; p < .001; CI [0.26-0.65]) compare with those who were assisted by medical personnel during delivery.
Lastly, respondents who attended postnatal checkup were 52 times more likely to have their children vaccinated compared with those who had no postnatal checkup within 2 months after delivery (OR = 1.52; p < .001; CI [1.25-1.85]) (Tables 9 and 10).
Binary Logistic Regression Models II to VII for the Likelihood of Full Immunization Among Children Aged 12 to 23 Months.

Source. Computed by author from 2013 NDHS dataset. Dataset is available at https://www.dhsprogram.com/data/dataset_admin/login_main.cfm
p < .05. **p < .01. ***p < .001.
Binary Logistic Regression Models VII to VIII for the Likelihood Of Full Immunization Among Children Aged 12 to 23 Months.

Source. Computed by author from 2013 NDHS dataset. Dataset is available at https://www.dhsprogram.com/data/dataset_admin/login_main.cfm
p< .05. ** p< .01. *** p< .001.
Discussion of Findings
The focus of this study was to examine the influence of household vulnerability dimensions (demographic, geographic, social, and economic) and maternal health related practices on childhood vaccination status in Nigeria. Several studies in Nigeria had tried to unravel and establish associated factors of low childhood vaccination with a view to develop policy interventions and strategies to increase coverage and vaccination demand. However, most of these studies have concentrated on socio-demographic and economic factors at individual and community level (Antai, 2012; Adedokun et al., 2017) with little attention on household vulnerability dimensions (demographic, geographic, social, and economic) and maternal health related practices as predictors of childhood immunization status in Nigeria.
Findings from this study corroborate previous findings that “coverage rates for routine immunization for all antigens in many parts of the country still fall below 50%” (NPC & ICF International, 2014; Tagbo et al., 2012); and also in consistent with WHO findings that “despite the level of success achieved on immunization coverage globally, above 20 million infants were still not immunized, with 80% of them living in sub-Sahara African countries” (WHO & UNICEF, 2014).
Relationship Between Sub-National Household Vulnerability Variations and Childhood Immunization Status in Nigeria
The study findings established existence of sub national household vulnerability variations, especially in the North Zones compared with the South Zones across all the four household vulnerability dimensions (demographic, geographic, social, and economic). Within the North Zones, the study established an extreme household vulnerability status, particularly in the North West where more than half of the households were demographically, geographically, socially, and economically more and most vulnerable. In Nigeria, previous studies have documented that full immunization coverage is highest in the South Zones and lowest in the North Zones (NPC & ICF International, 2014). However, evidence remains scanty on the influence of sub-national household vulnerability variations on childhood immunization status in Nigeria. This study provides empirical evidence on the regional variations in household vulnerability status with its negative effect on the uptake of childhood vaccination.
Relationship Between Household Vulnerability Dimensions and Childhood Immunization Status
Findings from this study established statistically significant relationship between the geographic vulnerability factors and childhood immunization status in Nigeria. The study showed a significant decrease in the proportion of children age 12 to 23 months that received full vaccination as household demographic vulnerability status deepened. These relationships were established in earlier studies which explained that distance to healthcare facilities along with location and regional differences are factors that affect childhood immunization (Kidane Yigzaw, 2006; Kiros & White, 2007; Ndirangu et al., 2009; Sarab et al., 2008).
Findings from this study corroborate previous findings by Corell (1983) who observed in rural Haiti that “the opportunity cost of taking a child to for treatment within the health facility is highest in a single-adult households.” Also Bloom et al. in their study conducted in Uttar Pradesh, North India shows that “women’s autonomy is a determinant factor of maternal health care utilization” (Bloom et al., 2001). This study provides empirical findings that children from more and most socially vulnerable households are less likely to receive full vaccination.
This study agrees with earlier studies which showed that economic factors account for variation in children’s well-being (Geronimus et al., 1994; Thompson et al., 1994). The logistic regression showed that the odds of full childhood immunization decreased consistently among children who are from more and most economically vulnerable households. The significant relationship found in-terms of household economic vulnerability status and childhood immunization is in consistent with previous study in Nigeria by Antai (2012), which showed that poorer women have lower decision-making power (Antai, 2012).
The overall findings on the influence of household vulnerability status on childhood vaccination revealed that children in the more and most vulnerable households were significantly less likely to receive full immunization compare with their counterpart in non-vulnerable households. Mothers from vulnerable households could either be demographically, geographically, socially, and economically vulnerable with attendant effect on their children health outcomes such as immunization.
Relationship Between Maternal Health Related Practices and Childhood Immunization
Maternal health practices were established as important factors that explain child immunization status in this study. Findings revealed that chances of full childhood immunization were significantly greater among children whose mothers had first antenatal visit within the first trimester (1–4 month) of pregnancy. There is a significant relationship between: (i) having at least four or more antenatal visits, (ii) quality of antenatal care, (iii) delivery within public/private health institution, (iv) assisted by medical personnel during delivery, and (v) postnatal checkup within 2 months of delivery and full childhood vaccination status. These findings corroborate findings by Meredith et al. (2011) which found significant relationship between number of antenatal visits and EPI attendance in all the three countries examined: Chad, Mali, and Niger.
These findings are consistent with relationship found by Jagrati et al. (2008) and Odiit and Amuge (2003) in rural Mozambique that children delivered at home has higher risk of not completing their vaccination schedule. Also, this study corroborates research findings by Bisiriyu and Ojewumi (2014) which showed that mothers’ health seeking behaviour significantly influence childhood vaccination status. Also, the effect of quality of antenatal care received on the childhood immunization status was observed in the studies conducted in India and Bangladesh, where mothers who received tetanus toxoid vaccination during pregnancy had greater chances of completing their children immunization (Partha, 2002).
Binary Logistic Regression Models VII–VIII for the Likelihood of Full Immunization Among Children Aged 12 to 23 Months
The logistic regression analysis at this level showed that majority of the children from demographically, geographically and economically more and most vulnerable households whose mothers received low quality antenatal care, delivered outside health care facilities and have no delivery assistance by trained medical personnel with no postnatal checkup with 2 months of delivery, are at increased risk of partial or no vaccination unlike their counterparts from non-vulnerable households respectively. These findings corroborate previous findings by Antai (2009), Wiysonge et al. (2012), Adedokun et al. (2017) which revealed that “socioeconomic nature of individual and communities influences the health seeking behaviour of individuals” and children of mothers from socioeconomically disadvantaged communities are more at disadvantage to receive full immunization (Adedokun et al., 2017; Antai, 2009; Wiysonge et al., 2012).
Furthermore, findings on economic household vulnerability revealed that respondents in economically non-vulnerable households stood a greater chance of early initiation of antenatal care, having four or more antenatal visits, receiving quality antenatal care, delivery within health institution, assisted during delivery with early postnatal checkup with subsequent full childhood vaccination than their counterpart in more and most economically vulnerable households. These findings are in consistent with previous study by Klevens and Luman (2001). Their study established that parents with lower household incomes are more likely to experience barriers (transportation or access to health care services) that prevent them from receiving quality antenatal care and completing immunization schedule (Klevens & Luman, 2001).
Lastly, the study showed that the chances of having delivery within health care institution or assisted by trained personnel and receiving postnatal check within the 2 months of delivery dropped consistently with overall household vulnerability status. Children from more and most vulnerable households are less likely to be delivered within health care facility, received delivery assistance from trained personnel and postnatal checks within 2 months of delivery. This result support earlier findings by Cutts et al. (1991) and Odiit and Amuge (2003). Their study concluded that “mothers’ hospital delivery affect whether the child will start immunization or not.” This could be because majority of mothers may become more aware of the importance of immunization as they go for antenatal care and gave birth in the hospital settings.
Reasons for No or Partial Immunization
Various reasons documented in the extant literatures for non-compliance to uptake of childhood immunization are supported by findings of this study such as lack of finance, lack of female provider, nearness to health facility, facility not open, husband’s refusal, and others (Abdulraheem et al., 2011; Favin et al., 2012; Global Immunization Division (GID) of the Centre of Disease and Control, 2009).
Conclusion and Policy Recommendation
Having employed secondary data in a large part, findings from this study revealed that household vulnerability dimensions (demographic, geographic, social, and economic) was “not just a one-off isolated factors, but the result of an evolving mix” of different household vulnerability factors, personal and internal factors that influence childhood immunization. The procedure of responding/treating illness or seeking preventive health care involves many steps and should not be explained by a single model or factor only but by a wide dimensions related to household vulnerability status and maternal health practices. These findings can be rationalized to the fact that mothers from non-vulnerable households are better informed about child susceptibility to diseases as well as severity of some diseases and therefore will want to take steps toward preventive care unlike their counterparts from more or most vulnerable households who are poorly informed.
Findings from this study traced in details, and also disaggregated in different dimensions showed that household vulnerability dimensions and maternal health practices needed to be focused and improved because it is a process that changed over time, space and it is not intrinsic to the individual alone but to the household and are influenced by society, existing institutions and their socio-economic circumstances as well.
Therefore, to improve childhood immunization coverage with multiplier effect on childhood survival, government and non-governmental organizations as well as international donor agencies must take critical steps and adapt the listed recommendation to change the trajectory toward achieving 85 to 90% full national immunization coverage:
Mitigate household vulnerability through expanding educational opportunities for both men and women as well as focusing on adult literacy training for mothers and partners;
Embark on Socio Behavioural Change (SBC) with focus on community mobilization and sensitization programmes targeted at pregnant women to inform them on the value of modern medicine;
Lastly, scale up on orphan and vulnerable welfare program across the state with priority to the Northern Zones to ameliorate vulnerability within households with multiplier effect on childhood immunization.
Limitation of the Study
This study makes use of a secondary data obtained from the 2013 National Demographic and Health Survey (NDHS), which is a nationally representative data. Thus, there are some limitations as predetermined by the data in term of the questionnaire design and variable measured. For instance, some of the vulnerability indicators were not captured at household level and therefore were computed from individual level to form household vulnerability indexes.
Therefore, subsequent study should use household level data to measure vulnerability for more robust findings.
Footnotes
Declaration of Conflicting Interests
The author(s) declared no potential conflicts of interest with respect to the research, authorship, and/or publication of this article.
Funding
The author(s) received no financial support for the research, authorship, and/or publication of this article.
Ethics Consideration
Ethical approval to use the 2013 NDHS dataset was obtained from the DHS program data achieve office. Also, ethical clearance was obtained from Health Research and Ethics Committee, Institute of Public Health Obafemi Awolowo University, Ile Ife with HREC No 1130. This study used secondary data in large part. The 2013 NDHS has already taken care of ethical issues at the collection and collation stages, hence no risk of breaking participants confidentiality or associated consideration in that regard.