
Abstract
In the present study, the contribution of various biological and lifestyle factors toward progression to hypertension are examined among menopausal and postmenopausal women. A cross-sectional study among 245 women of 20 to 65 years was conducted. Besides blood pressure, fat percentage using bio-electric impedance analyzer and adiposity indices such as body mass index (BMI), waist–hip ratio (WHR), and waist–height ratio (WHtR) were taken. Mean, standard deviation, ANOVA, and multinomial logistic were used to analyze the data. Statistically significant differences (p< .001) for blood pressure among postmenopausal and premenopausal women were found. Among both premenopausal and postmenopausal women, the prehypertensive and hypertensive group showed significant differences with the normotensive women for body weight (p< .005), regional obesity, and general obesity. Low educational level, working status of women, socioeconomic status, nuclear family setup, postmenopausal status, and obesity were found to be the likely risk factors for prehypertension or hypertension among women.
Introduction
Hypertension has been identified as a major cause of morbidity and mortality in both developed and developing nations. An elevated blood pressure alone contributes to majority of cardiovascular disease (CVD) worldwide (Kearney et al., 2005). Hypertension is a risk factor for various degenerative diseases, imposing a great burden at global level (Kearney et al., 2005). Hypertension is a major public health problem in India (Farag et al., 2014; Gaziano, Reddy, Paccaud, Horton, & Chaturvedi, 2006). The estimated total number of people with hypertension in India in 2000 was 60.4 million males and 57.8 million females, and this figure is projected to increase to 107.3 million and 106.2 million, respectively, in 2025 (Kearney et al., 2005). In India, CVDs cause 1.5 million deaths annually (Gaziano et al., 2006). The prevalence of hypertension has increased by 30 times among the urban population over a period of 55 years and about 10 times among the rural population over a period of 36 years (Gupta, 1997). Different proportions of Indian populations are found to be affected by the hypertension. About 45.8% women in Chandigarh (Ahlawat, Singh, Kumar, Kumari, & Sharma, 2002) and 37.5% women in Jaipur (Gupta et al., 2002) were found to be hypertensive. Various factors such as aging (Wiacek, Jegal, Hagner, Hagner-Derengowsk, & Zubrzycki, 2012) and fatness have been found to be some of the leading factors for physiological variability in blood pressure. Blood pressure was found to increase with fatness and advancing age (Tyagi & Kapoor, 1999, 2010). Obesity has also been found to be directly related to the development of a group of chronic non-communicable diseases (NCDs) including insulin resistance, diabetes, and CVD (Grundy, 2004). Hypertension and obesity have been implicated for their adverse impact on health in earlier studies (Dressler, Dos Santos, Gallagher, & Viteri, 1987; Kiyoshi et al., 2006). Obesity and hypertension are associated with several health risks that subsequently create greater challenge in providing adequate primary care in the 21st century.
More than 25% of the female adult world population is hypertensive (Kearney et al., 2005). The postmenopausal women are at higher risk of cardiovascular problems in India as well as globally (Bhagat et al., 2010; Tandon, Mahajan, Sharma, & Sharma, 2010), and this risk increases with age. Such risks have been reported to be associated with the incidence of hypertension, obesity, dyslipidemia, stress, diabetes mellitus, reduced glucose tolerance, vascular inflammation, changes in fat distribution pattern, and so on (Assmann et al., 1999). Menopause is accompanied by an increase in blood pressure due to loss of estrogen production, contributing to the high prevalence of hypertension in older women. There is an increase in blood pressure in the first decade after menopause. During the seventh decade of life, the prevalence of hypertension among women was even higher than among men (Burt et al., 1995). Prevalence of hypertension-related cardiovascular complications was greater in postmenopausal women than in age-matched men, and these complications have been reported to be the leading cause of death in women (Rosamond et al., 2007).
Hypertension, a global health problem (Kearney et al., 2005), and menopause, an inevitable phenomenon, are linked to each other (Kearney et al., 2005; Lewington, Clarke, Qizilbash, Peto, & Collins, 2002). In view of population aging throughout the world, identification of possible risk factors and prevention of hypertension in postmenopausal women are important. Elevations in blood pressure in women are related to cardiovascular risk (Lewington et al., 2002) with the prevalence of hypertension being particularly high among women aged 60 years (Kearney et al., 2005). The trend of increasing CVD in adults observed in recent decades can accelerate even further. An association of hypertension with the menopause and related risk factors need to be given due attention to avoid increased burden of hypertension and related CVDs among women. Information about high blood pressure and its determinants is becoming increasingly important for improving existing health services. The present study is conceptualized to examine various bio-social predictors of hypertension and their possible contribution toward hypertension among women.
Method
A total of 245 females of age range 20 to 65 years were studied from North Delhi, the capital city of India. A random representative sample was taken for the present study. Anthropometric measurements, including height, weight, waist circumference, and hip circumference, were taken. All anthropometric measurements were taken using standard techniques (Weiner & Lourie, 1981). Blood pressure for all the participants was measured in sitting position using a mercury sphygmomanometer, 2 times, and an average of two readings was taken. Body composition was studied using Tanita (Model TBE 310) bio-electric impedance analyzer. General adiposity indices (fat percentage, body mass Index [BMI]) and the regional adiposity indices (waist circumference [WC], waist–height ratio [WHtR], and waist–hip ratio [WHR]) were measured among women. The WHtR was taken as a ratio of waist circumference (cm) to height (cm).
Hypertension is defined as systolic blood pressure (SBP) of 140 mmHg and above and/or diastolic blood pressure (DBP) of 90 mmHg and above (Joint National Committee VII, 2003). The blood pressure was measured using sphygmomanometer and stethoscope to the nearest 2 mmHg. The blood pressure was measured after giving a 10-minutes rest to each participant. The participants were classified into different blood pressure group categories. Normal blood pressure was taken as less than 120 mmHg–systolic and less than 80 mmHg–diastolic. Participants with the blood pressure values of 120 to 139 mmHg (systolic) and 80 to 89 mmHg (diastolic) were classified under prehypertension category. Stage-I hypertension was taken as 140 to 159 mmHg–systolic and 90 to 99 mmHg–diastolic, whereas Stage-II hypertension was taken as blood pressure of more than 160 mmHg–systolic and more than 100 mmHg–diastolic (Joint National Committee VII, 2003). In the present study, participants were divided into three categories: normotensive, prehypertensive, and hypertensive. The hypertensive category included participants who were Stage-I/Stage-II hypertensive. The family type (joint, nuclear, or extended), food habits (vegetarian or non-vegetarian), and socioeconomic status were assessed in different blood pressure categories. The operational definitions of “joint,” “extended,” or “nuclear” families used for the present study are as follows: “Nuclear family” is defined as the one that includes nuclear pair, that is, head and spouse with or without unmarried children. The nuclear family also may be “extended” through the common residence of two or more married couples and their children or of several generations connected in the male or female line. The “joint family” is the family with head and spouse with married son(s)/daughter(s) and their spouses and parents with or without other not-currently-married relation(s) or head without spouse but with at least two married son(s) and daughter(s) and their spouses (Niranjan, Surender, & Rama Rao, 1998).
The WC of more than 80 cm in women is considered a risk group for CVDs (World Health Organization [WHO], 2002), and this reference value has been followed in the present study. Body fat percentage is considered an indicator of obesity if it is more than 30% among females (American Council on Exercise [ACE], 2009; Durnin & Womersley, 1974). WHR of more than 0.80 for females has been taken as an indicator of abdominal obesity (Willett, Dietz, & Colditz, 1999). WHtR of more than 0.50 was taken as risk category (Ashwell, 2005). The food habits have been broadly classified as vegetarian and non-vegetarian. Socioeconomic status was calculated using revised Kuppuswamy’s socioeconomic scale (Mishra & Singh, 2003). This scale takes account of education, occupation, and income level of an individual with a different score for each of these three parameters summing up to total scores to classify the study groups as upper, upper middle, and lower socioeconomic status:

Information regarding the physical activity, family history of hypertension, and age of onset of menopause was collected for each participant. Mean, standard deviation, ANOVA, and logistic regression were applied to study the data. The SPSS Version 13.0 was used. The present study was in accordance with the ethical standards of the institutional committee. The purpose of the study was explained to each participant, and an informed consent was taken from all the participants prior to start of the study. None of the participants smoked, and they were not taking steroids or hormone replacement therapy.
Results
Table 1 displays that according to systolic blood pressure (SBP), 63.6% postmenopausal women as compared with 42.8% premenopausal women were found to be prehypertensive or hypertensive. Similarly, 67.3% postmenopausal and 39.9% premenopausal women were found to be prehypertensive and hypertensive, respectively, as per diastolic blood pressure (DBP).
The postmenopausal and premenopausal women reported a significant difference in blood pressure (130.8 mmHg and 119.1 mmHg SBP; p< .001). Similarly, significantly different (p< .001) mean values of DBP among postmenopausal (87.1 mmHg) and premenopausal women (80.2 mmHg) were found (Table 2).
Prevalence of Hypertension Among Women.

Note. SBP = systolic blood pressure; DBP = diastolic blood pressure.
p< .001.
Distribution of Premenopausal and Postmenopausal Women as per Blood Pressure.

p< .001.
As per SBP as well as DBP, the hypertensive premenopausal women were tallest, followed by normotensive and prehypertensive women. Among postmenopausal women, as per SBP, prehypertensives were tallest, followed by normotensive and hypertensive. However, as per DBP, hypertensive and normotensive women were tallest, followed by prehypertensive, although the differences were not found to be statistically significant. As per SBP and DBP, both, premenopausal and postmenopausal women showed significantly (p< .001) higher mean value of weight among hypertensive women followed by prehypertensive and normotensive women (Table 3).
Baseline Descriptive Characteristics of Participants by Menopausal Status.

Note. SBP = systolic blood pressure; DBP = diastolic blood pressure.
p< .001.
WHtR, WC, BMI, and fat percentage showed statistically significant (p< .001) higher values among prehypertensive and hypertensive women as compared with their normal counterparts for both premenopausal and postmenopausal groups. All the participants, except normotensive premenopausal women, belong to the risk category as per the WHR standards. All the prehypertensive as well as hypertensive females showed a significantly (p< .001) higher value of WHtR and WC. The F values also displayed significant differences between normotensive, prehypertensive, and hypertensive females for all the regional adiposity measures. All the participants were classified as a risk group as per fat percentage cutoff in the present study. However, the fat percentage was relatively lower among most of the premenopausal women than their postmenopausal counterparts. The mean values of BMI were found to be higher among the premenopausal women than the postmenopausal women in both prehypertensive and hypertensive categories (Table 4).
Regional and General Obesity Among Females as per Blood Pressure Category.
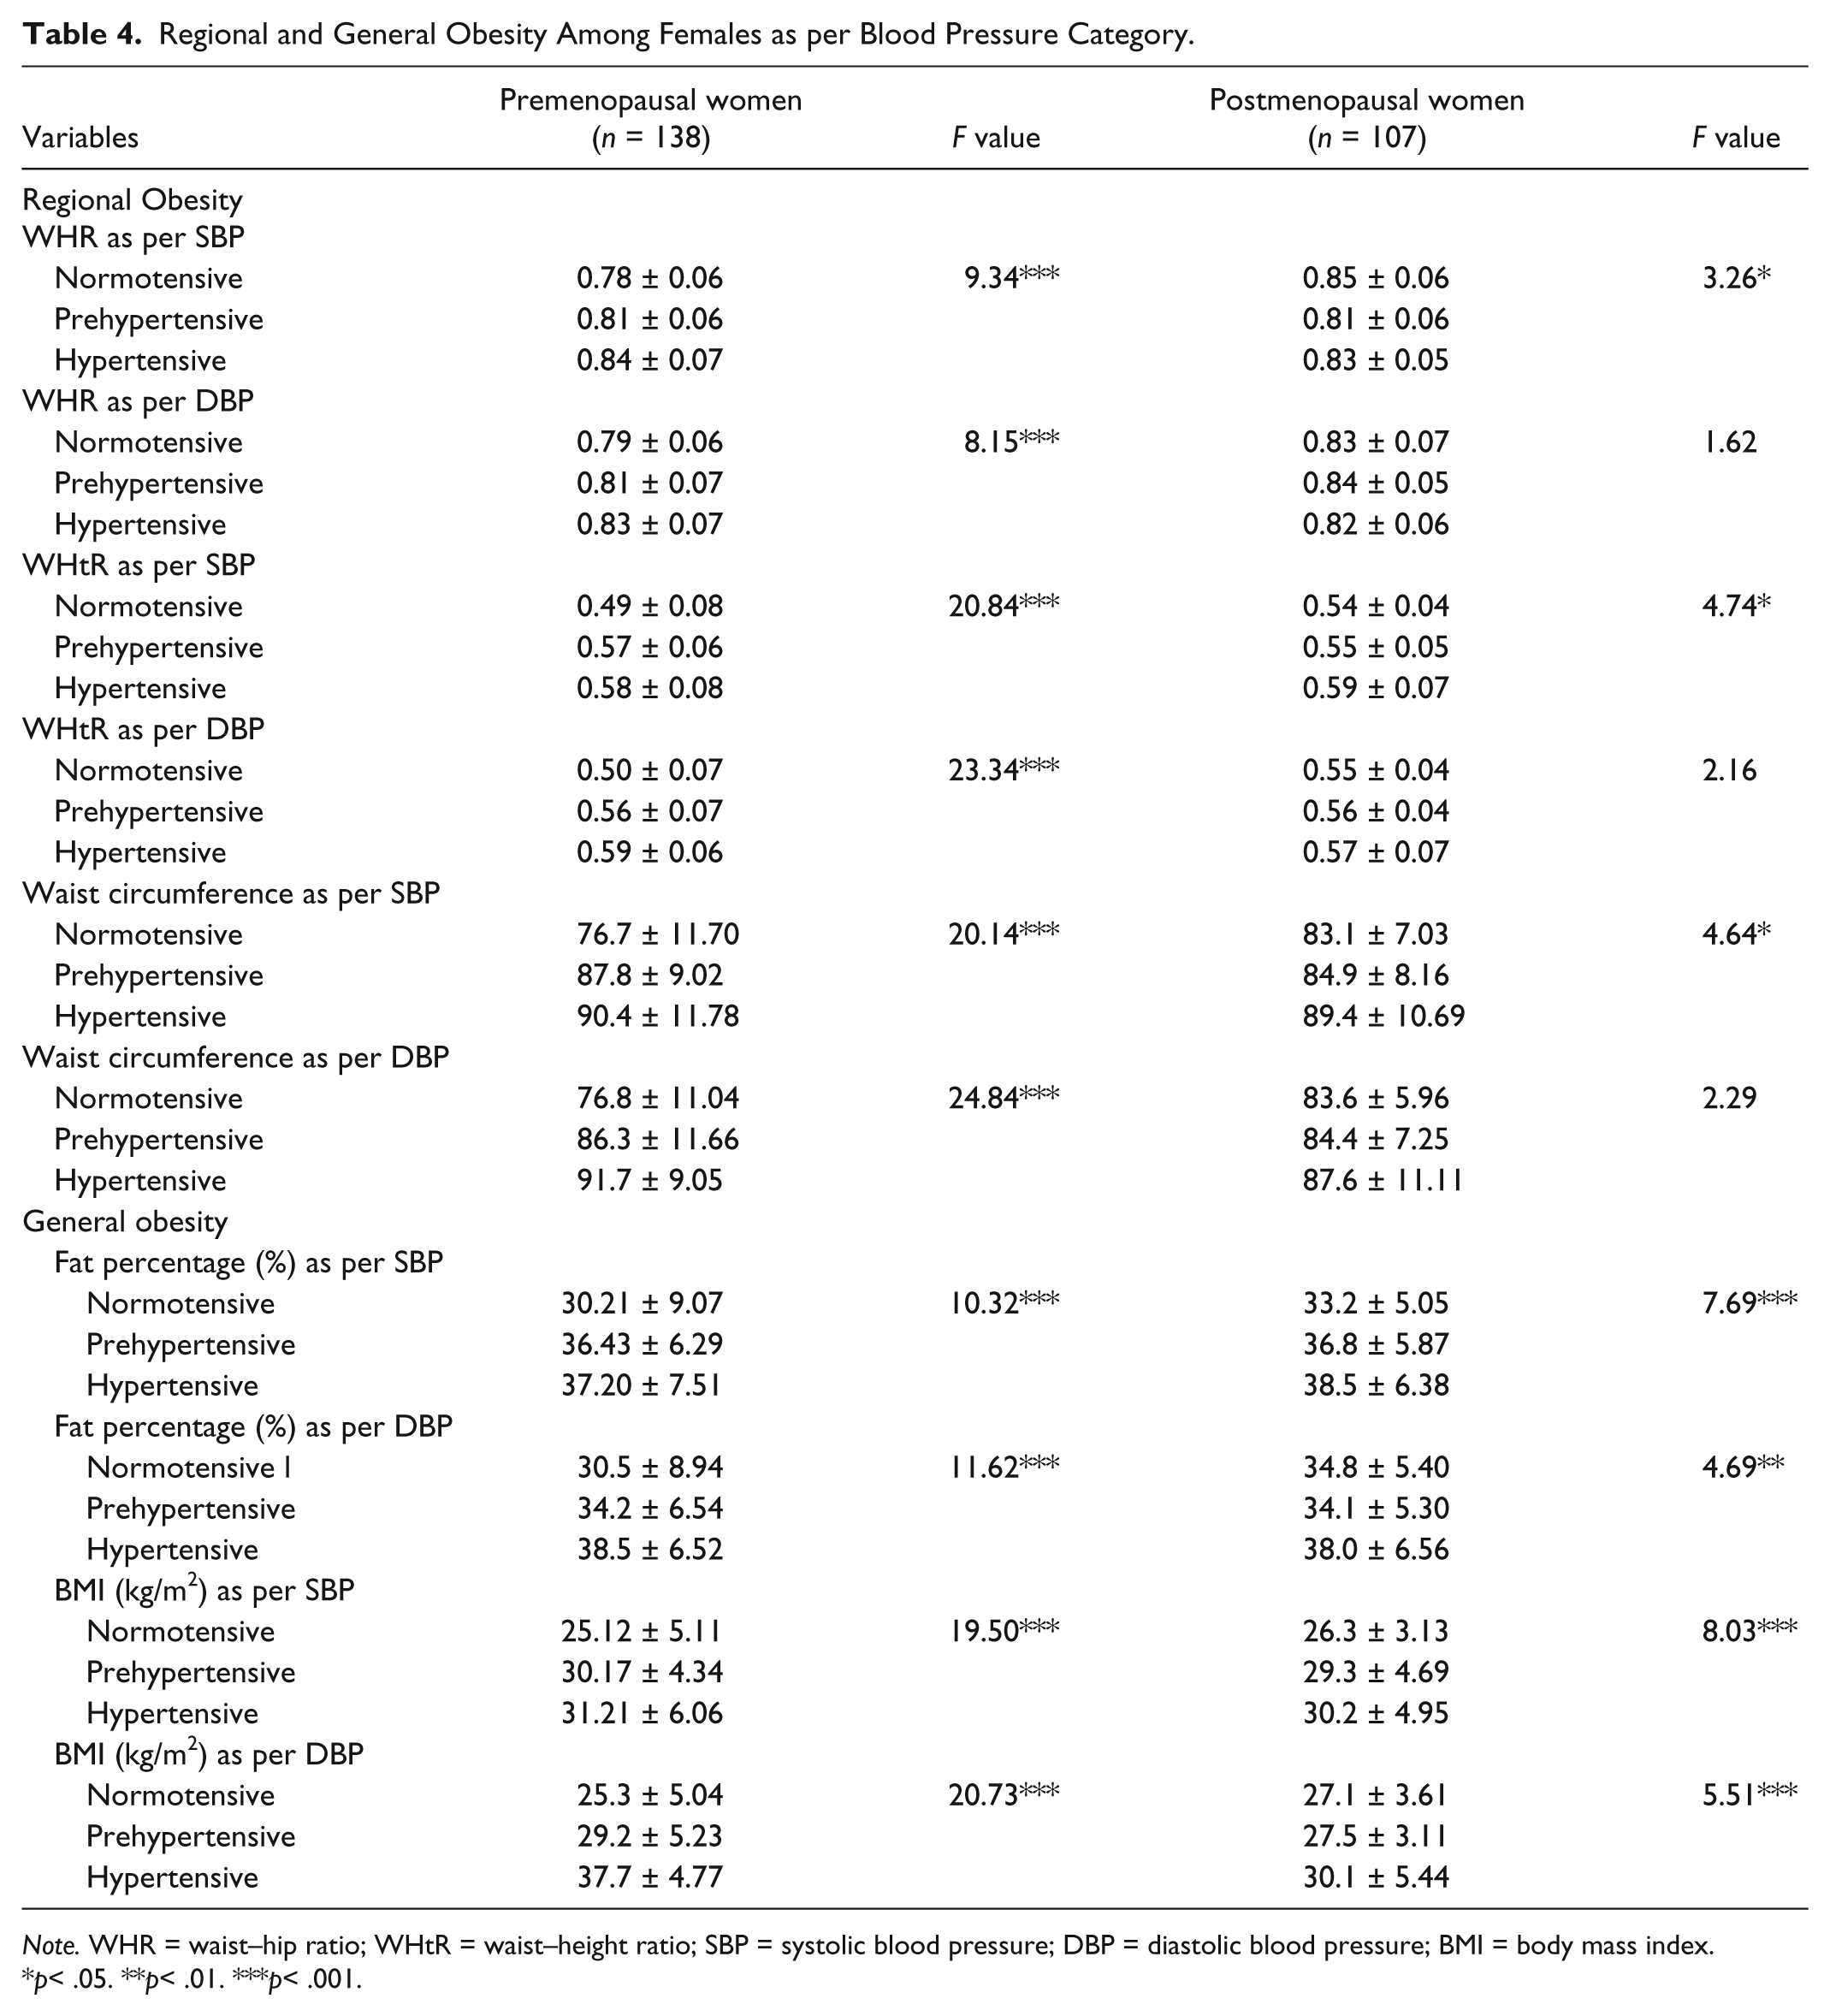
Note. WHR = waist–hip ratio; WHtR = waist–height ratio; SBP = systolic blood pressure; DBP = diastolic blood pressure; BMI = body mass index.
p< .05. **p< .01. ***p< .001.
Most of the variables, especially weight and all adiposity indices, showed significant differences for both SBP and DBP among postmenopausal women. All the differences between normotensive and hypertensive women were found to be significant. Similarly, significant intergroup differences were found among premenopausal women (Tables 5 and 6).
Post Hoc Test (Least Significant Difference) for Postmenopausal Women.
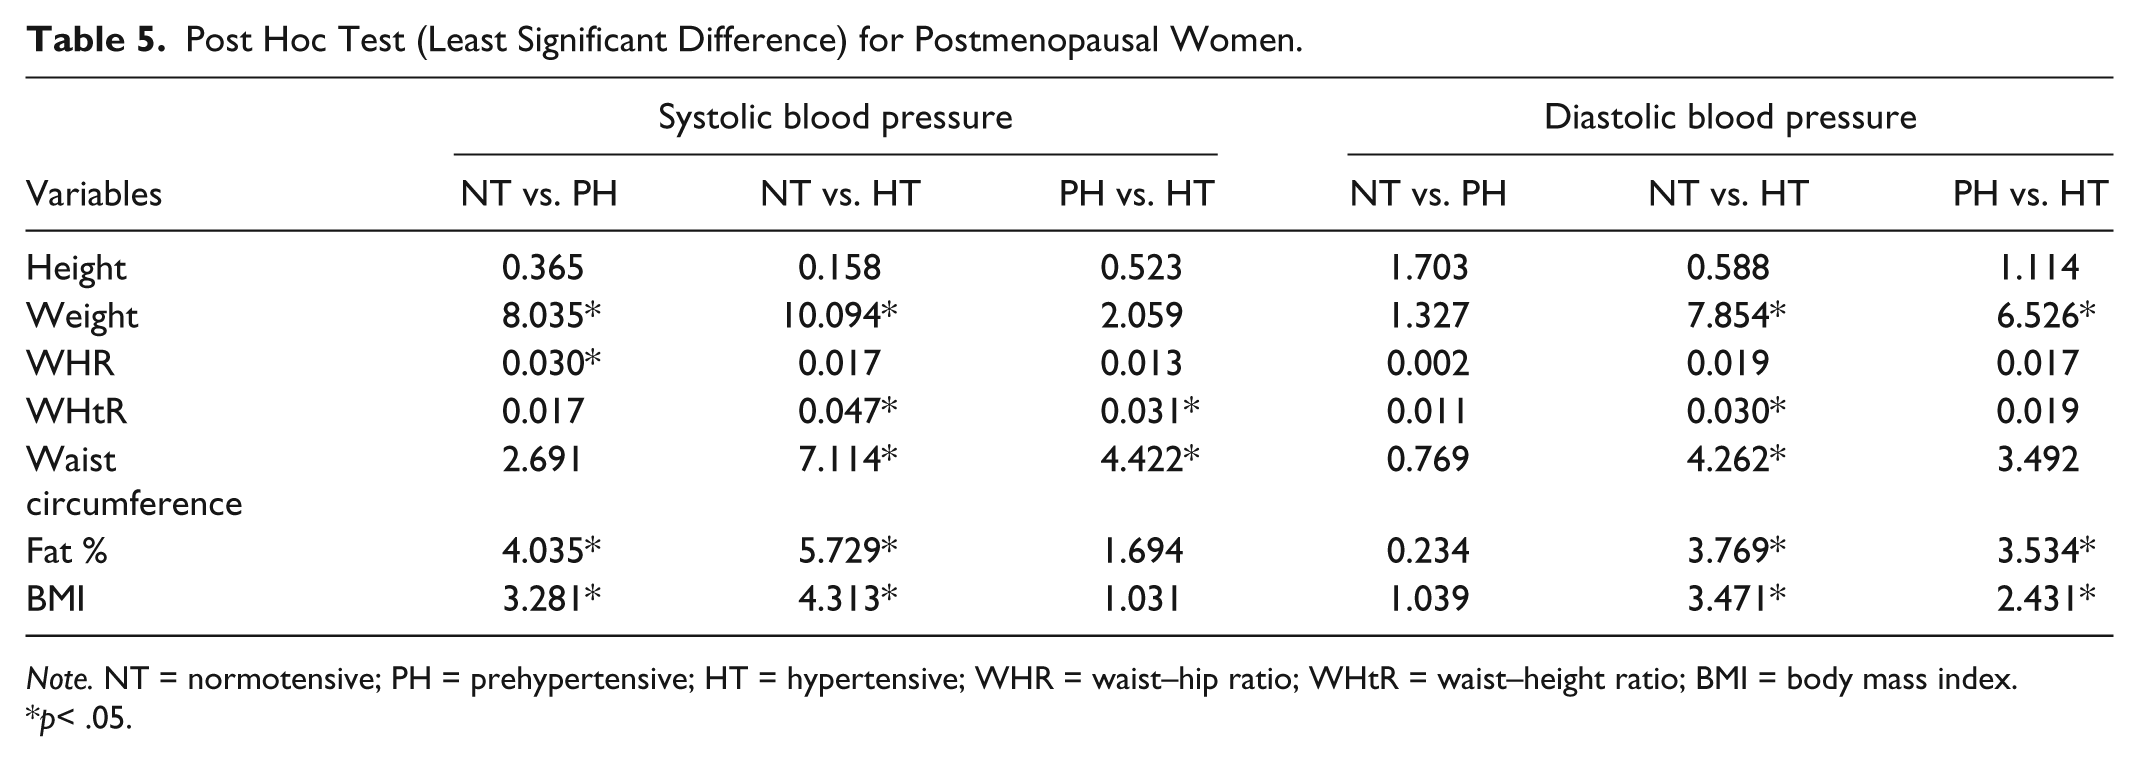
Note. NT = normotensive; PH = prehypertensive; HT = hypertensive; WHR = waist–hip ratio; WHtR = waist–height ratio; BMI = body mass index.
p< .05.
Post Hoc Test (Least Significant Difference) for Premenopausal Women.

Note. NT = normotensive; PH = prehypertensive; HT = hypertensive; WHR = waist–hip ratio; WHtR = waist–height ratio; BMI = body mass index.
p< .05.
Multinomial logistic regression was used to find the risk of each variable individually after removing other factors at 95% confidence interval (CI) level. The postmenopausal women were found to be more than 3 times more likely to be prehypertensive than the premenopausal women. Educational level of females was found to be significantly correlated with the chances of them being prehypertensive. Women educated up to primary level were more than 8 times and those educated up to secondary level were 5 times more likely to develop high SBP. However, as per DBP, the females educated up to primary level were about 5 times and females educated up to secondary level were 6 times more likely to develop high blood pressure as compared with their graduate counterparts. As per SBP and DBP, the non-working women as compared with the working women were 4 times and 2 times, respectively, more likely to develop hypertension. The distinction between private and government jobs is relevant. In the present study, the job profile of the working women belonging to either “government jobs” or “private jobs” involved only mental labor and not much manual labor. However, there is more mental strain/stress in private jobs as compared with the government jobs. In private jobs, workload was high, and they have to perform best as they have anxiety or fear of losing their jobs. It is a well-known fact that stress is directly associated with blood pressure (Aslam et al., 2013). The females taking non-vegetarian diet were 3 times more likely to develop hypertension. Non-vegetarian recipes in India are concomitant with high level of fats, salt, and spices, the known risk factors for hypertension. The postmenopausal women were 2 times more likely to develop hypertension. Females in nuclear family setup were 3 times more likely to develop prehypertension and twice more likely to develop hypertension (Table 7).
Risk Estimates for Hypertension According to Different Socioeconomic and Other Lifestyle Indicators.

Note. BP = blood pressure; CI = confidence interval; SES = socioeconomic status.
The reference category is normal.
p< .05.
As per fat percentage, females of risk category were 5 times more likely to be prehypertensive. Females of risk category as per WHtR were 4 times and 7 times more likely to be prehypertensive as per SBP and DBP, respectively. The overweight women as per BMI category were 8 times and 12 times more likely to be prehypertensive as per SBP and DBP, respectively, as compared with their normal-weight counterparts. As per WHtR, the females in risk category were found to be 5 times and 2 times more likely to be hypertensive as per SBP and DBP, respectively (Table 8).
Risk Estimates for Hypertension According to Different Biological Parameters.
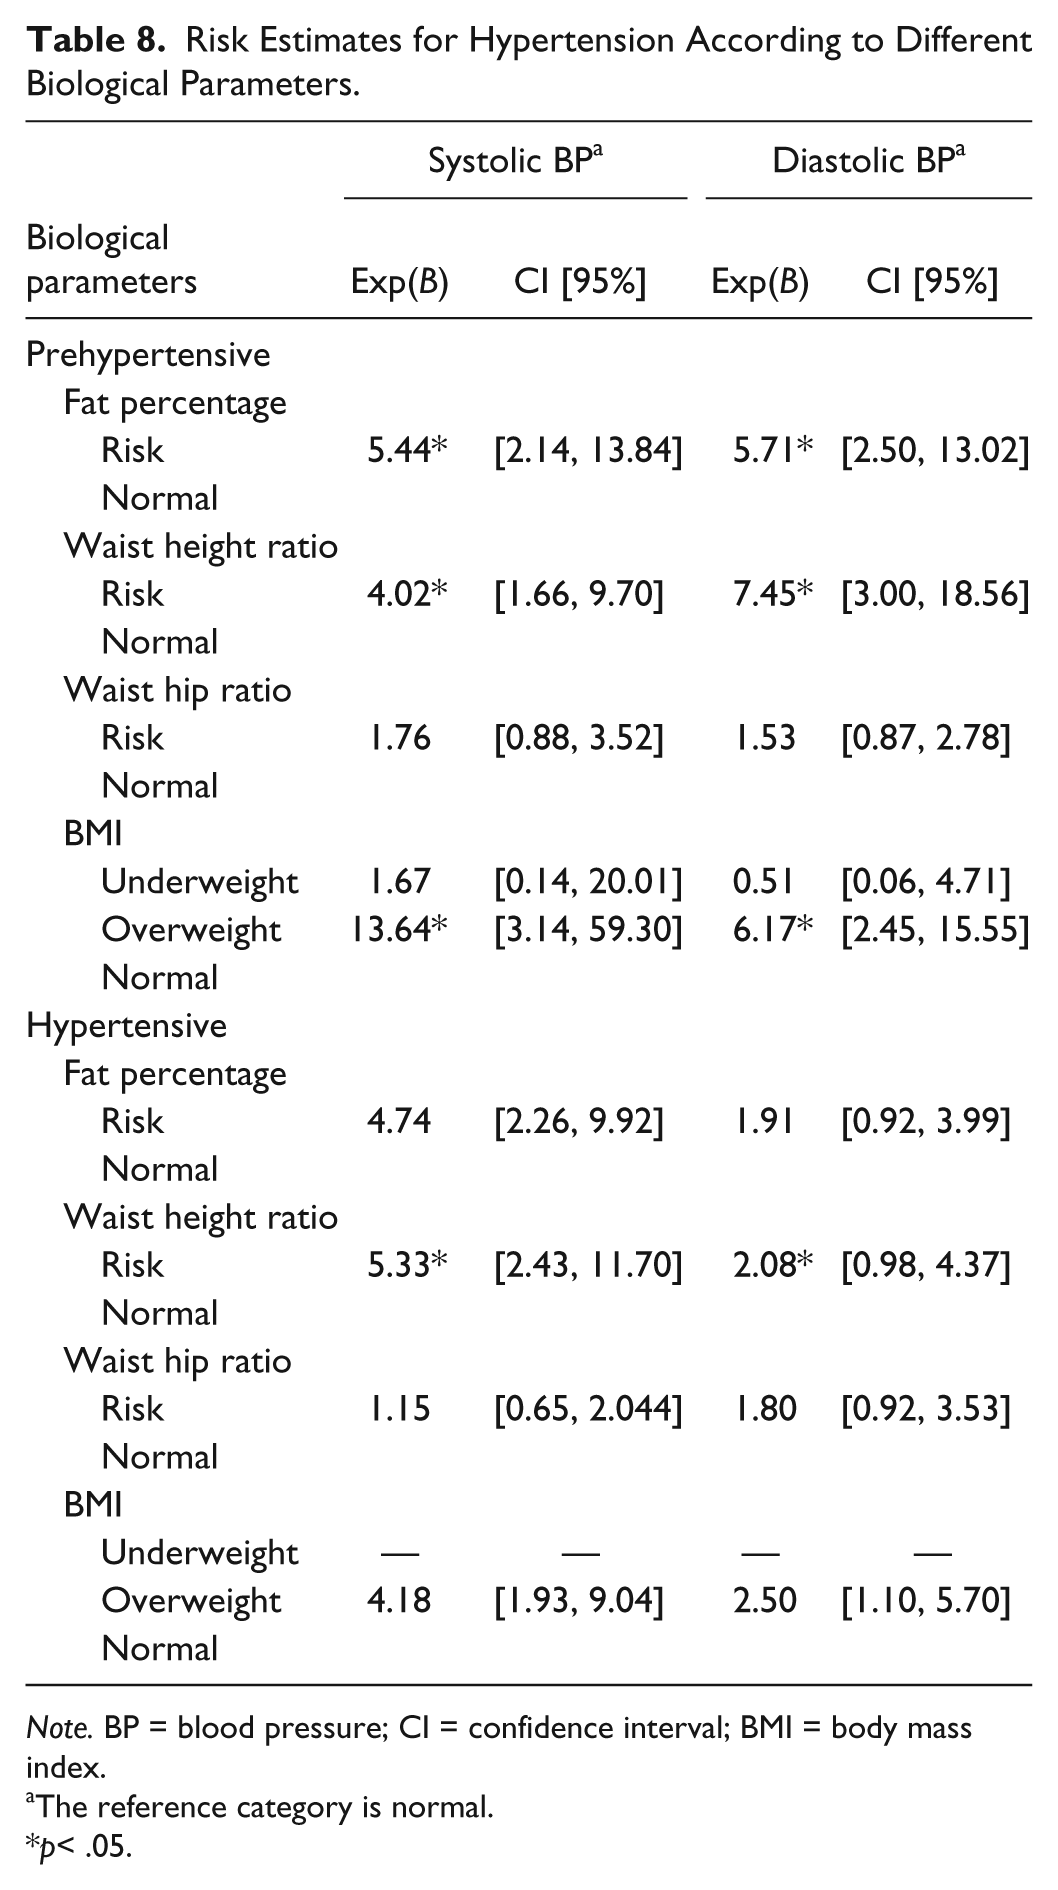
Note. BP = blood pressure; CI = confidence interval; BMI = body mass index.
The reference category is normal.
p< .05.
Discussion
More than 60% of postmenopausal women were found to belong to either prehypertensive or hypertensive categories unlike 40% of premenopausal women in anomalous blood pressure category. Significantly higher blood pressure was found among postmenopausal women in comparison with their premenopausal counterparts. Higher blood pressure level in postmenopausal women depends on age at menopause and postmenopausal period and not the participant’s age suggesting that an absence of female gonadal steroids contributes to an increase in blood pressure in elderly women (Izumi et al., 2007). With the cessation of ovarian functions, there is an increase in plasma cholesterol and triglycerides, reduction in high-density lipids (HDL), and an increase in low-density proteins, which are responsible for an increase in blood pressure (Tomiyama et al., 2009). The normotensive postmenopausal females showed higher body weight than their premenopausal counterparts in the present study. Different ethnic origin, reduced lean mass, resting metabolic rate, and treatment with certain drugs could be responsible for weight gain among postmenopausal women (Samat, Rahim, & Barnett, 2008).
All the premenopausal and postmenopausal women in both prehypertensive and hypertensive categories were found to have abdominal obesity. Only normotensive premenopausal women reported normal WHR. Similarly, all the women except normotensive premenopausal women were found to belong to risk category as per the WC classification. The postmenopausal women were reported to have 49% higher abdominal fat and 22% higher subcutaneous fat as compared with the premenopausal women (Toth, Tchernof, Sites, & Poehlman, 2000). The physiological withdrawal of estrogen among postmenopausal women brings about changes in their fat distribution pattern (Dubnov-Raz, Pines, & Berry, 2007) and blood pressure (Samat et al., 2008). A shift from gynoid to android fat distribution after menopause was reported among normotensive females, unlike prehypertensive and hypertensive females in the present study. A similar transition was reported by earlier researchers in normotensive females (Kapoor et al., 2012; Tyagi & Kapoor, 2004; Tyagi, Kapoor, & Kapoor, 2005). Postmenopausal obesity compounds the situation leading to increased rates of hypertension, diabetes mellitus, coronary artery disease, and mortality (Samat et al., 2008). The premenopausal and postmenopausal women showed significant differences between normotensive, prehypertensive, and hypertensive women for both general and regional obesity. However, the variability among the three blood pressure categories of premenopausal women is more marked as compared with the postmenopausal category. Obesity has been reported as an indicator for hypertension (Iloh, Amadi, Njoku, Ofoedu, & Awa-Madu, 2012; Mungreiphy et al., 2012; Zhou, Dayi, & Chen, 2008). Hypertension incidence was found to show a significant positive association with BMI and percentage body fat among postmenopausal women (Shuger, Sui, Church, Meriwether, & Blair, 2008).
The participants of the present study know about few health risks of obesity. However, they consume more sugar and fat than recommended for their age due to ignorance or job stress. A significant proportion of the participants of the present study had higher income level but lower educational level, which is reflected in the finding of the present study. The high blood pressure has multiple etiologies. For instance, high education level is mostly linked to high-profile jobs involving high mental stress like meeting the target, deadlines, and competitions that may work as risk factors contributing to high blood pressure. Another cause could be more money but less educational level, which is an indicator of relatively less awareness about healthy food, exercise regimes, its regularity, and so forth. Another probable risk factor contributing to high blood pressure could be less money and less education thereby less awareness and less affordability, and so on.
In the present study, higher socioeconomic status of females was found to be a more likely risk factor to develop prehypertension and hypertension. A similar direct association between hypertension and economic status was reported earlier (Aslam et al., 2013; Colhoun, Hemingway, & Poulter, 1998). Participants at higher salary grade level or socioeconomic statuses are more likely to be hypertensive. There was higher prevalence of hypertension at both extremes of the socioeconomic spectrum (Olatunbosun, Kaufman, Cooper, & Bella, 2000). Hypertension was found to have a complex association with economic status (Minh, Byass, Chuc, & Wall, 2006). There was found to be high risks of hypertension among the rich men reflecting their high-fat diet, office stress, and so on (Mendez, Cooper, Wilks, Luke, & Forrester, 2003). The complex relationships between hypertension and socioeconomic status found in this study need deeper and more sophisticated analyses.
Amigoni, Morelli, Parazzini, and Chatenoud (2000) reported that menopause increases the risk of hypertension twice even after adjusting for factors such as age and BMI. Prevalence of hypertension in the highest socioeconomic group was more than twice as compared with the lowest socioeconomic group, while overweight people in the higher socioeconomic class were found to be at a greater risk of hypertension (Ericus, Gilberts, Marinus, Arnold, & Diederick, 1994). There are evidences that people in higher socioeconomic status consume more fats, more animal-based products, more sugar, more processed foods, and less fiber (United Nations Food and Agriculture Organization, 2006), which could be a reason for these people having an increased probability of developing hypertension. It seems that in many developing countries, as socioeconomic development proceeds, coronary disease increases. The rise of lifestyle-related chronic disease in developing countries is the result of a multifarious pattern of socioeconomic and behavioral factors (Nugent, 2008).
Menopausal status and lower educational level, non-working status, and nuclear family setup were found to be more likely risk factors to develop prehypertension and hypertension in the present study. An association between individual education and blood pressure is significantly mediated by the lower body weight of highly educated individuals, which may be partly because of their good knowledge of health risks associated with obesity and greater motivation to control weight. Lower educational level of an individual is associated with obvious stress, which is associated with a higher BMI/WC. This, in turn, is associated with a higher blood pressure. Lower educational level could also influence self-help knowledge and the way that a person seeks and gets medical assistance for various medical needs, including the risk factor control. Low education has higher risk of being a psychosocial determinant of poor health (Thurston, Kubzansky, Kawachi, & Berkman, 2005). With an increasing number of nuclear families in India, women are subjected to pressures from family members to manage day to day activities, which may be responsible for an increasing prevalence of prehypertension and hypertension among women in a nuclear family setup. A relatively less active daily routine of the non-working women as compared with their working counterparts could be responsible for the higher prevalence of prehypertension and hypertension among the former group. A decreasing odds ratio (OR) value with an increase in educational level indicates an inverse relationship of educational status with the occurrence of hypertension. Hypertension is found to be more prevalent among uneducated and less-educated than educated participants as reported earlier (Gupta, Gupta, & Ahluwalia, 1994). A more sedentary lifestyle with less physical activities is found to be a significant risk factor for hypertension. This finding is in line with that of Dressler (1982) who found that status inconsistency, that is, having differing scores on categories of modernization using scales of social factors, led to an increase in blood pressure.
Women with higher general and regional adiposity were found to be more likely to be prehypertensive and hypertensive than the women with normal adiposity indices in the present study. Hypertension is found to be associated with age, adiposity, and lifestyle incongruity (Olatunbosun et al., 2000; Solowat et al., 2009; Tyagi & Kapoor, 2010). Despite having a lower BMI than the premenopausal women, a higher percentage of the postmenopausal women were found to be either prehypertensive or hypertensive, which may be due to a higher fat percentage and regional obesity among the postmenopausal women in the present study. The risks associated with CVDs are found to occur at a lower BMI among Asian Indians as compared with the White population (Banerji, Faridi, Atluri, Chaiken, & Labovitz, 1999), which may be attributed to more visceral adipose tissue among the former than the latter group. A substantial proportion of Asian people were found to have a higher risk of CVDs and Type 2 diabetes mellitus (T2DM) at BMI lower than existing (WHO, 2000). The high prevalence of obesity, lack of regular physical exercise, improper food habits, and food poor in nutrition and low in fiber content are some of the important factors contributing to and aggravating postmenopausal hypertension. Sedantarism (i.e., expending less than 10% of the daily energy intake in the performance of moderate- and high-intensity activities) is highly prevalent in middle-aged women (Bernstein, Morabia, & Sloutkis, 1999). Physical inactivity is a well-recognized contributory factor, and increase in BMI is an additive risk factor for coronary heart disease (CHD). Physical activity and specific diet can improve the insulin resistance among postmenopausal women (Llaneza et al., 2010). Hypertension and obesity follow a rising trend due to an increased accessibility of processed food, more hours of television watching, sedentary lifestyles, and consumption of more “energy-dense, nutrient-poor” foods (WHO, 2002). Considering the ever-increasing prevalence of hypertension among women due to associated sociobiological risk factors highlighted in the present study, some recommendations such as screening programs with regard to obesity and hypertension should be organized at school and college levels. Awareness needs to be generated among girls and women at school and college levels regarding obesity, hypertension, and their causes such as sedentary lifestyle, poor food habits, and so on, and their consequences; women should be sensitized toward over-nutrition, sedentary lifestyle, and related health hazards, especially hypertension and related risk factors; and women, especially postmenopausal women, should be encouraged toward active lifestyles and healthy food habits.
This study may help in identifying the persons at risk, which may further help in planning group-specific interventions. Some healthy habits need to be developed among postmenopausal women with different types of interventions. There is a need to acknowledge and understand the role of possible social determinants of health, which can hamper our efforts to improve the health of the population, especially the rapidly increasing burden of CVD morbidity and mortality among women. Prevention of hypertension in women must start early in life, as indicated by the rising number of school girls with hypertension (Sakuragi et al., 2009; Sundar et al., 2013). Among urban Indian schoolchildren, a high occurrence of obesity is reported (Chhatwal, Verma, & Riar, 2004; Marwaha et al., 2006). In addition, the prevalence of hypertension is found to be significantly higher among overweight children than normal-weight children (Mohan et al., 2004). Therefore, children also need to be sensitized toward the problems of obesity, hypertension, and related consequences in adulthood and later life.
Limitation of Study
The small sample size was found to be a limitation of our study. No frail elderly women were included in the study. The antihypertensive medications were not assessed in this study, which can be taken as a limitation of the study. Stress was not assessed in the present study, although it has been verbally cited as one of the potential factors for hypertension by the participants to the investigator. A more thorough assessment of hypertension with lifestyle parameters with a larger sample size would be important in this direction.
Conclusion
The present study demonstrated that increasing obesity and adiposity levels in conjunction with improved socioeconomic status are driving the epidemic of hypertension. We conclude that the prevalence of hypertension among women increased with higher BMI, WHtR, WHR, menopause status, non-working status, nuclear family setup, poor educational status, and higher socioeconomic status. The prevalence of hypertension is likely to increase with increasing life expectancy and socioeconomic changes, which need to be paid serious attention. In India, where diversity and variation are found in large scale, biological and social factors should be incorporated while tackling any global health issue.
Footnotes
Acknowledgements
Authors are thankful to all the participants for their cooperative participation in the present study. Financial assistance to Renu Tyagi from the Department of Science and Technology (DST) under Women Scientists Scheme in Basic and Applied Sciences [WOS-A] is greatly acknowledged. Our thanks to Ms. Rebecca Delekta for editing the language of the article.
Declaration of Conflicting Interests
The author(s) declared no potential conflicts of interest with respect to the research, authorship, and/or publication of this article.
Funding
The author(s) disclosed receipt of the following financial support for the research and/or authorship of this article: Financial assistance to conduct this study was provided by the Department of Science and Technology (DST), Ministry of Science & Technology, Delhi, India.