
Abstract
This article describes the prevalence of multi-morbidity and its association with self-rated and functional health using Longitudinal Aging Study in India (LASI), Pilot survey, 2010 data, on 1,683 older adults aged 45+. The prevalence of multi-morbidity is assessed as count of self-reported chronic diseases for an older adult. Limitations in activities of daily living (ADL) are used as a measure of functional health. Zero-inflated Poisson regression is estimated to examine the covariates of multi-morbidity. Moreover, logit models are used to assess the association of multi-morbidity with functional health and self-rated health. Results depict a large prevalence of multi-morbidity, limitations in ADL and poor self-rated health with pronounced state variations. Prevalence of multimorbidity was higher at higher level of education, wealth, and caste. However, educational status of older adults is seen to be negatively associated with prevalence of ADL limitations and poor self-rated health. Household wealth and caste showed no clear association with limitations in ADL and poor self-rated health. Multi-morbid older adults were found with substantially high risk of ADL limitations and poor self-rated health.
Introduction
India’s steady pace of demographic transition has driven a phase of rapid population aging. The number of persons aged 60+ rose from 19.6 million (5% of the total population) in 1951 to 98 million (9% of total population) in 2011. The 60+ population is projected to increase to 11% by 2025 and 19% by 2050 (United Nations, 2012). Lately, the demographic shifts in India have been accompanied by epidemiological transition where the disease profile has witnessed a phenomenal change with chronic diseases taking the center stage. The shift in the disease pattern coupled with population aging occurring in the strong presence of infectious and parasitic diseases has resulted in the dual burden of diseases on the country (Boutayeb, 2006; Quigley, 2006). In India, more than half of the burden of non-communicable disease (NCD) and 25% of total disease burden occur in the 45+ age group (Chatterji et al., 2008). It is projected that by the year 2030, more than 45% of the total disease burden will be borne by the individuals aged 45 and above. World Health Organization’s (WHO) estimates for 2008 show that NCDs account for 55% of the deaths among population in the age group of 15 to 60 years whereas for the older population (aged 60+), it is as high as 73%. The rising burden of chronic diseases is thus posing fresh challenges for the control and treatment of NCDs (Joshi, Kumar, & Avasthi, 2003; Patel et al., 2011; Quigley, 2006).
With rising longevity, multiple morbidities (defined as co-existence of two or more chronic diseases) and co-morbidities have become progressively common for the older population. Evidences from both developed and developing countries show that older people are at much higher risk of multiple co-morbidities (Gijsen et al., 2001; Khanam et al., 2011; Salisbury, Johnson, Purdy, Valderas, & Montgomery, 2011; Salive, 2013; van den Akker, Buntinx, Metsemakers, Roos, & Knottnerus, 1998; Walker, 2007). Multiple morbidities have been proven to be directly associated with adverse health outcomes such as reduced physical functions (Fried, Bandeen-Roche, Kasper, & Guralnik, 1999; Kadam & Croft, 2007), reduced quality of life (Fortin et al., 2004), poor self-rated health (Galenkamp, Braam, Huisman, & Deeg, 2011), and mortality (Hoeymans, Feskens, Kromhout, & van den Bos, 1999). Furthermore, the presence of multiple and co-morbid conditions makes clinical decision and patient management more challenging tasks, which increases the risk for adverse outcomes and is, consequently, associated with higher medical care costs (Barnett et al., 2012; Parekh & Barton, 2010). Overall, the rising prevalence of multiple and co-morbidities is bound to increase the health care cost adding to the economic vulnerability of older adults. This may result in adverse effects on physical and mental well-being further exacerbated by socio-economic deprivation and poor medical care facilities (Lehnert et al., 2011; Marengoni et al., 2011; Tu, 2004).
In India, older adults are at a greater health risks owing to their peculiar socio-economic and cultural characteristics, including poor nutritional intake (Deaton & Dreze, 2009), poor quality of health care (Powell-Jackson, Acharya, & Mills, 2013; Varkey & Kollengode, 2011), and lack of education and poor health care access resulting in one of the highest out of pocket health care expenditure (more than 70%) in the world (Ghosh, 2011; Pal, 2012). The problem of multiple chronic diseases among Indian older adults is, however, relatively under-explored primarily owing to the lack of nationally representative data on chronic diseases and associated factors. The Longitudinal Aging Study in India (LASI), as a sister survey of global family of longitudinal health and aging studies in more than 30 countries including the American Health and Retirement Survey, is an initiative toward fulfilling this resource gap in India (Arokiasamy, Bloom, Lee, Feeney, & Ozolins, 2012). In the backdrop of very little or absence of data, this article aims to examine the prevalence of major chronic diseases, presence and determinants of multiple chronic diseases, and their association with self-rated health and functional health of the older Indians aged 45+ using data from the recent LASI pilot survey, 2010.
Method
Study Sample
The sample for the present study has been taken from the LASI pilot survey, 2010, conducted in four states, namely, Karnataka, Kerala, Punjab, and Rajasthan. To capture India’s demographic, economic, health, and cultural diversity, the LASI pilot focused on two northern states (Punjab and Rajasthan) and two southern states (Karnataka and Kerala). Punjab is an economically developed state, whereas Rajasthan is relatively poor. Kerala, known for its relatively developed health care system, has undergone rapid social development and is a potential harbinger of how other Indian states might evolve. Karnataka is also in the advanced stages of demographic transition.
LASI pilot applied multi-stage, area probability sampling design for sample selection. From each of the aforementioned state, two districts were selected at random from Census districts for 2001; eight primary sampling units (PSUs) were selected from each district using probability proportional to size (PPS) sampling. PSUs were chosen to match the urban/rural share of the population. Twenty-five residential households were then selected through systematic random sampling from each PSU, from which an average of 16 households contained at least 1 age-eligible individual.
LASI collected data on demographics, health, social, and economic well-being, and biomarkers from 1,683 individuals (734 males and 949 females) aged 45+ including spouses irrespective of age through face-to-face interview.
The LASI pilot sampling protocol adopted for the selection of states, districts, PSUs, and household and individual selection, as well as other details of data collection are described at length by Arokiasamy et al. (2012) in the article “Longitudinal Aging Study in India: Vision, Design, Implementation, and Preliminary Findings.”
Measures of Chronic Conditions and Multi-Morbidity
In this study, multi-morbidity is defined as the simultaneous presence of two or more chronic conditions at the time of data collection. LASI pilot survey collected information on chronic diseases, namely, hypertension, cancer, lung disease, heart disease (heart attack, coronary heart disease, angina, congestive heart failure, or any other heart problems), stroke, arthritis/rheumatism, and diabetes based on the self-reports of diagnosis by a health professional. The question asked for each of the disease was “Has any health professional ever told you that you have a (particular) disease?” The diseases considered for the analysis are the diseases of long duration; therefore, a positive answer to the above question was considered as the presence of that particular disease at the time of the survey. In addition to this, the pilot survey has also collected the information about the medical professional who has diagnosed the disease as (a) doctor with MBBS degree; (b) Ayurvedic, Unani, or homeopathic doctor, Registered Medical Practitioner (RMP), or sidda; and (c) others. The purpose of collecting this information was to strengthen the reliability of the responses about the presence of a disease and to analyze the bias due to misreporting of the diseases owing to self-reports of the data.
Self-Rated Health
In the LASI pilot survey, the respondents were asked to rate their health on a 5-point scale: very good, good, moderate, bad, and very bad. There were very few responses for the extreme points of the scale (i.e., very good and very bad); therefore, we have combined the responses in favor of bad and very bad health categories as “poor health” and rest into other (good health) to derive a dichotomized health variable with adequate sample; “poor health” was, thus, the outcome of interest in the analysis.
Measure of Functional Limitation
In the LASI pilot survey, six questions were asked to assess functional limitations in performing the activities of daily living (ADL) such as dressing and wearing chappals, walking across the room, bathing, eating or chewing chapatti, getting in and out of bed, and using the toilet. The respondents were asked to report in (a) yes, (b) no, (c) can’t do, or (d) don’t want to do. In this study, we have considered a person to have functional limitation if he or she has either reported yes or can’t do for any of the ADL.
Statistical Analysis
In this article, we have assessed the prevalence of multiple chronic diseases and co-morbidities among older Indians and their covariates. Drawing from the previous research work on social determinants of health, we have identified age, education, living arrangement (co-residence), wealth quintile, residence, and caste as covariates for the regression analysis. These variables, along with the health risk factors such as tobacco use, cooking fuel, and physical activities, have been taken as predictors in zero-inflated Poisson regression model to assess their effects on multiple morbidities. Furthermore, to examine the effects of multiple chronic diseases on the self-rated health and at least one ADL limitation, we have used logit models.
Results
Sample Characteristics
Table 1 presents the sample characteristics of the LASI pilot survey, 2010. The un-weighted percentages reflect that almost equal sample is selected from each of the four states, namely, Karnataka, Kerala, Punjab, and Rajasthan. Nearly 72% of the population is rural with a major share of population in the 45 to 59 age group and less than 10% from 75 years and above age group. Females have a better representation in the sample as 56% of the sample population is female. There is a decline in the percentage of the respondents with increase in the level of education as 46% have no education that reduces to 19% for high school and above. The schedule caste/schedule tribe (SC/ST) population consists of one fifth of the total population whereas each of the other backward class (OBC) and others consist of nearly 37% of the population. According to the socio-economic status (SES) of the sample households, less than 20% of the population falls under each category of poorest, poor, and middle, and more than 25% belongs to rich and richest sections.
Sample Characteristics, LASI Pilot Survey, India, 2010.
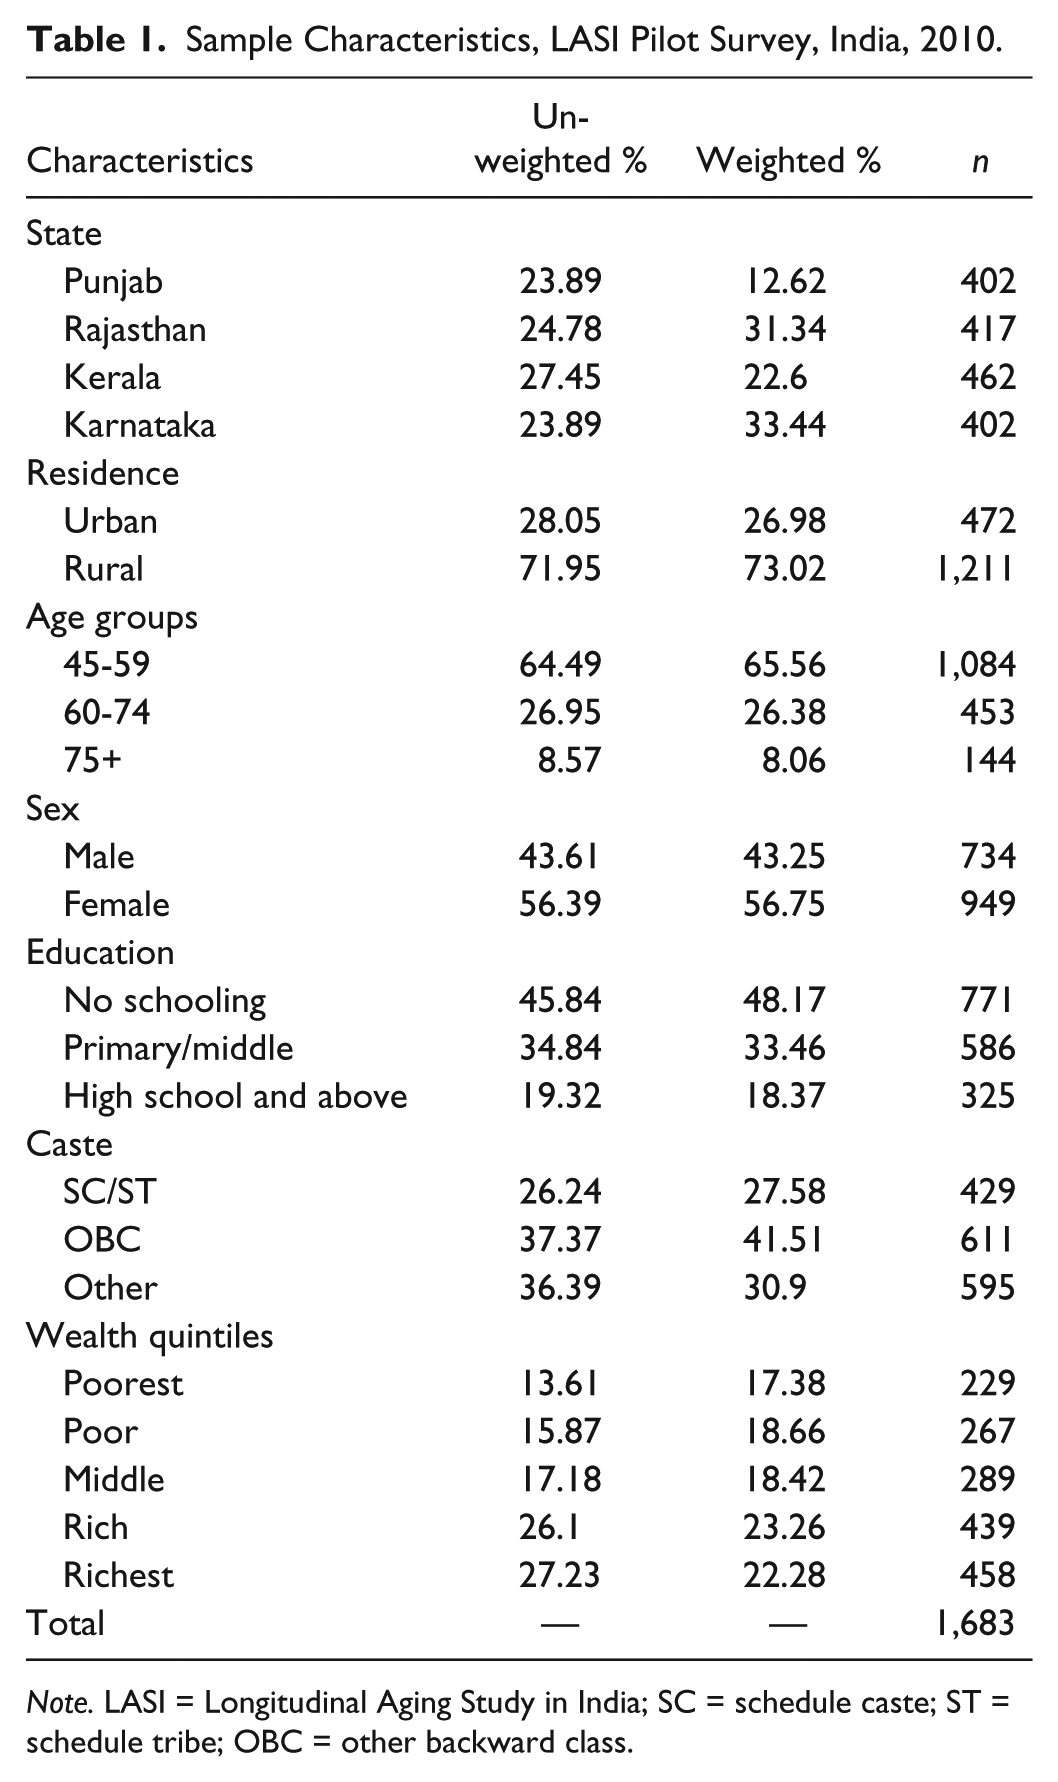
Note. LASI = Longitudinal Aging Study in India; SC = schedule caste; ST = schedule tribe; OBC = other backward class.
Prevalence of Individual Diseases
Table 2 shows the prevalence of selected chronic diseases based on the self-reports of diagnosis by selected background characteristics among older adults aged 45+. Results show that among the four states, Kerala has the highest prevalence of all the selected chronic diseases (hypertension 32%, diabetes 19%, heart diseases 8%, lung diseases 8%, and arthritis 22%) whereas Rajasthan has the lowest prevalence of all the five diseases except lung diseases. Table 2 indicates remarkable rural–urban differentials in the prevalence of self-reported diagnosed hypertension (urban 19% and rural 14%) and diabetes (urban 13% and rural 6%); however, with regard to other three diseases, namely, heart diseases, lung diseases, and arthritis, not much of the rural–urban differentials are observed in the prevalence. Results indicate a positive age gradient for the prevalence of diagnosed diseases.
Prevalence (%) of Selected Self-Reported Diagnosed Chronic Diseases Among Older Adults Age 45+ by Selected Background Characteristics, LASI Pilot Survey, 2010.

Note. LASI = Longitudinal Aging Study in India; SC = schedule caste; ST = schedule tribe; OBC = other backward class.
Table 2 also presents the socio-economic gradients of self-reported diagnosed chronic diseases. The indicators of SES included in the analysis are caste, education, and household wealth. Caste, an indicator of social position in India, is broadly categorized as STs, SC, OBCs, and all “Others.” SC and STs represent the most disadvantaged groups of the population due to the historical discrimination against these groups in various aspects of social and economic life (Van de Poel & Speybroeck, 2009). The prevalence of self-reported diagnosed diseases by categories of these indicators depicts a positive gradient, that is, higher prevalence at higher level of SES. For example, the prevalence of hypertension is 7% among older adults with no schooling, which gradually increases to 24% among the older adults with the education of high school and above. The SES indicators reflect the similar patterns for other diseases as well.
The results presented in Table 2 are based on the self-reports of the chronic diseases diagnosed by a medical professional, and therefore, we can consider these responses to be reliable. The accuracy of the responses, however, also depends on the type of medical professional who has diagnosed the diseases.
Table 3 presents the state variations in the proportion of reported cases diagnosed by a doctor with MBBS degree as such diagnosis could be considered more reliable in comparison with the diagnosis made by other health personnel. More than 95% of the reported diagnoses were done by a MBBS doctor for all the diseases (except arthritis) in Karnataka and Kerala, whereas Rajasthan shows the least proportion (less than 80%) of diagnosis by a MBBS doctor. Overall, the results reflect that more than 90% of the reported cases of all the diseases except arthritis (81%) were diagnosed by a doctor with a MBBS degree.
Percentage of Older Adults Reporting Diagnosis of Specific Diseases by a MBBS Doctor, LASI Pilot Survey, 2010.
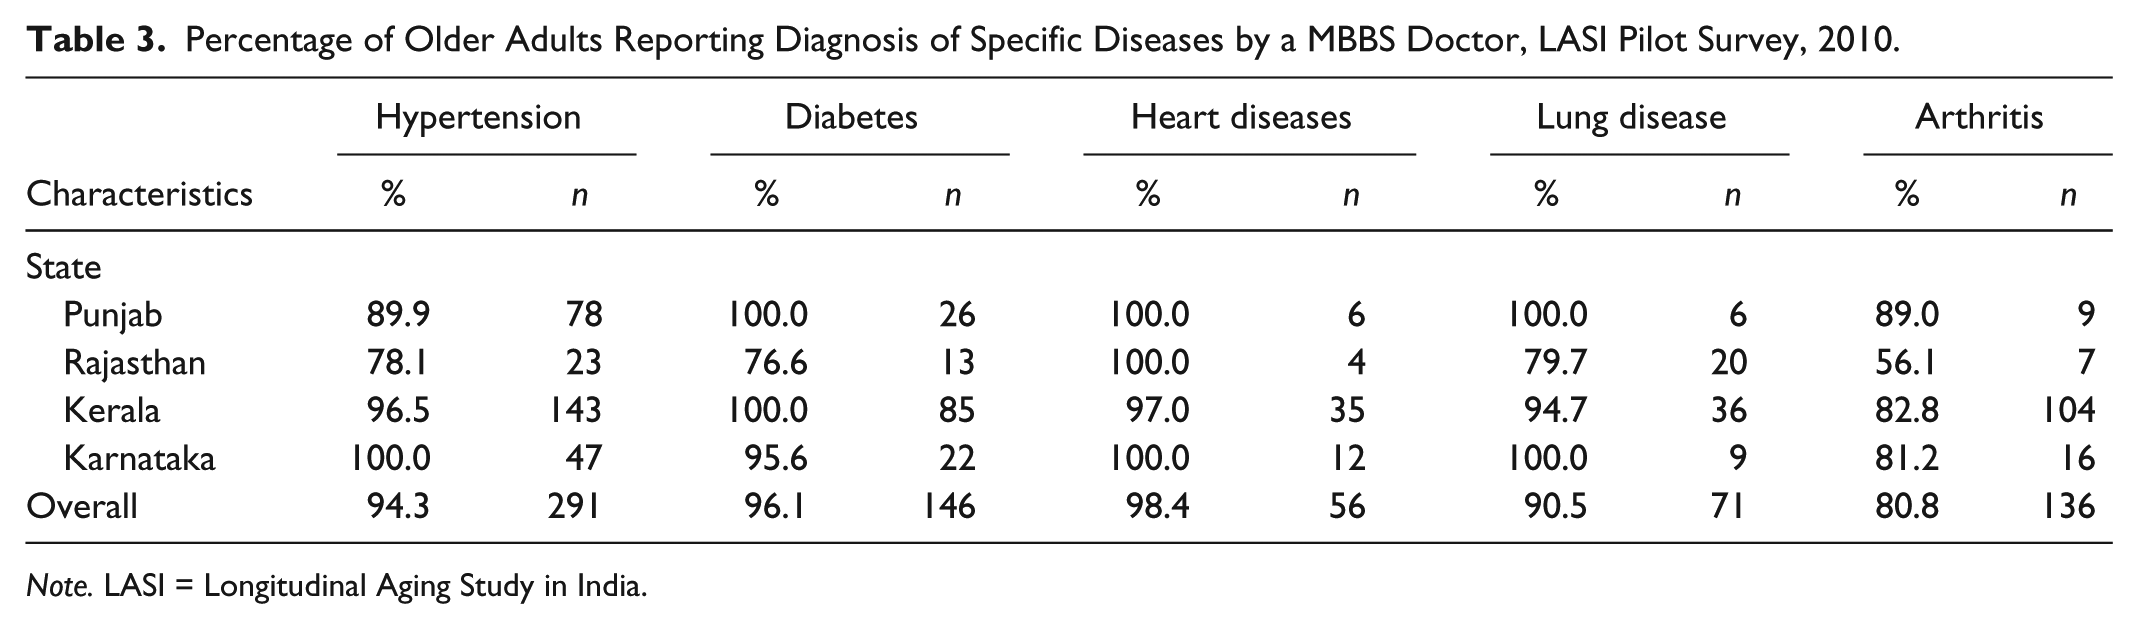
Note. LASI = Longitudinal Aging Study in India.
Prevalence of Multiple Chronic Diseases, ADL Limitations, and Poor Self-Rated Health
Table 4 presents the prevalence of one disease, multiple chronic diseases (two or more), 1+ ADL limitation, and poor self-rated health. Overall, 9% of older population reported to be diagnosed with multiple chronic diseases (two or more chronic diseases) and 17% reported to be diagnosed with one chronic disease. The prevalence of at least 1 ADL limitation was 12%, and 7% older adults reported their health to be poor. The prevalence of two or more chronic diseases among older persons is highest in Kerala (24%), which is 8 times of the prevalence of multi-morbidity in Rajasthan (2.8%). The states of Karnataka and Punjab have reported the prevalence of 5% and 6% for the multiple chronic diseases, respectively. The state of Kerala also showed the highest prevalence of 1+ ADL limitation and poor self-rated health (20% and 22%, respectively).
Prevalence (%) of Multiple Chronic Conditions, 1+ ADL Limitation, and Poor Self-Rated Health by Background Characteristics, LASI Pilot Survey, 2010.
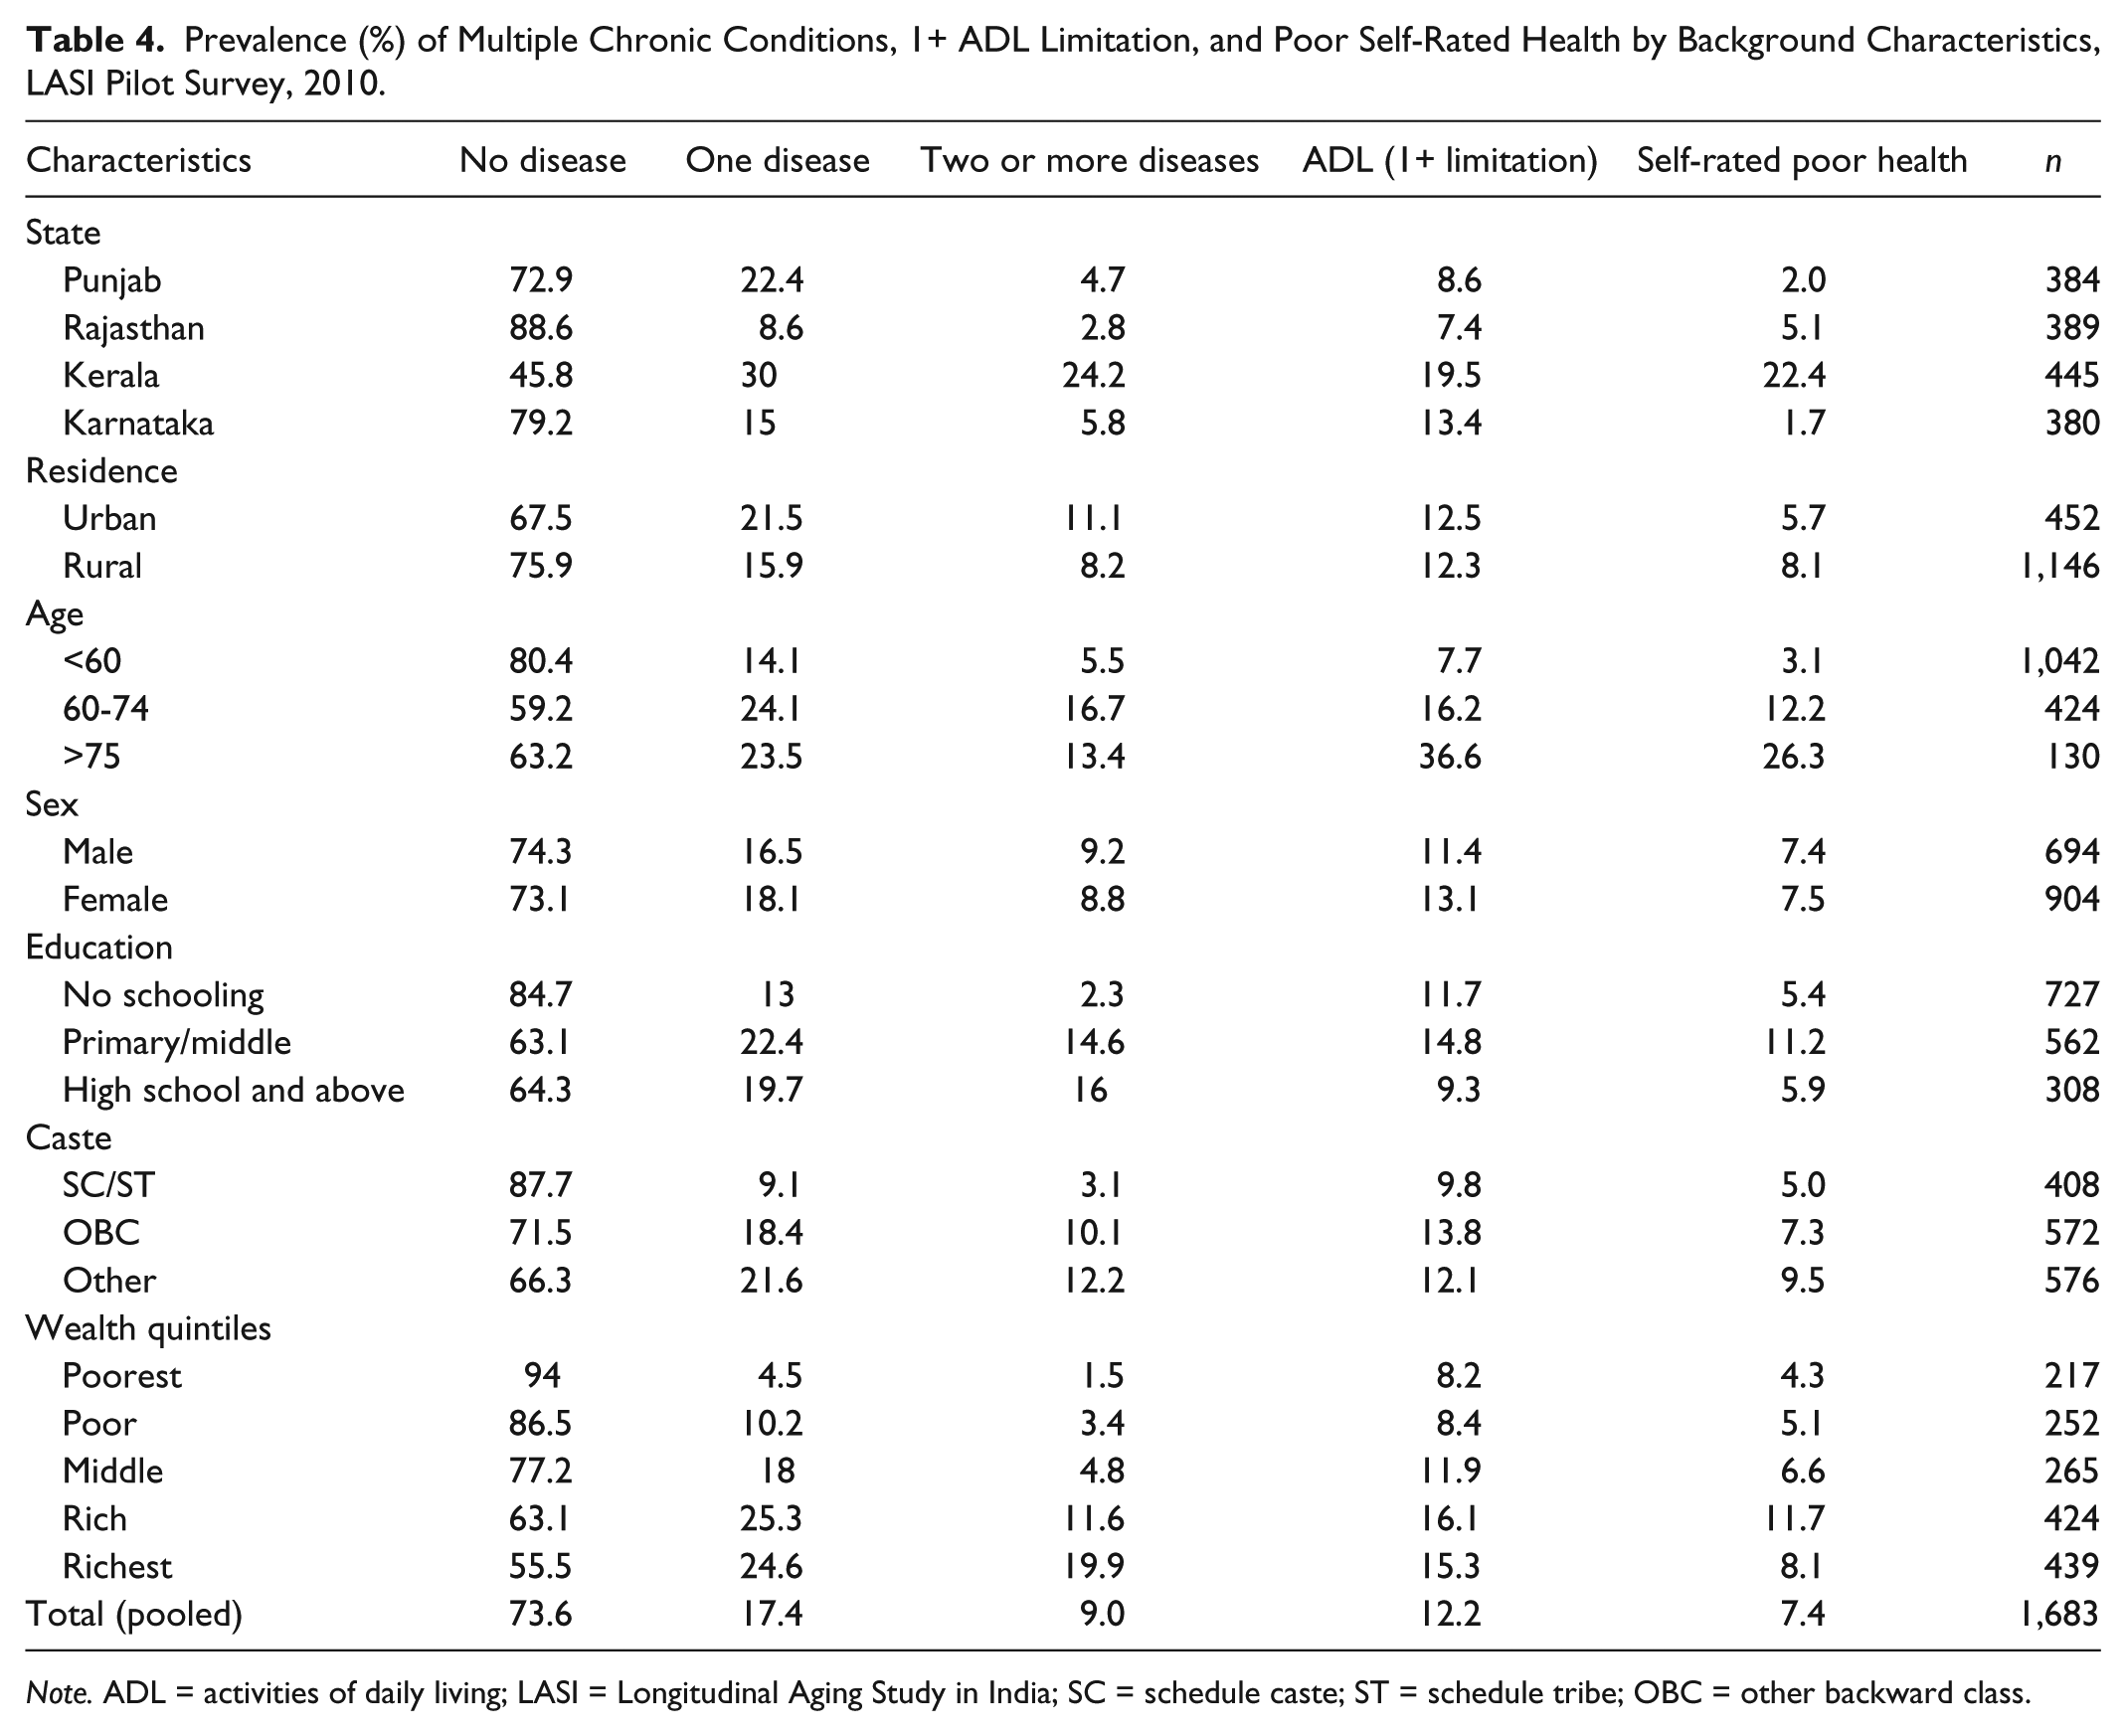
Note. ADL = activities of daily living; LASI = Longitudinal Aging Study in India; SC = schedule caste; ST = schedule tribe; OBC = other backward class.
Results indicate strong positive age gradient in the prevalence of multiple chronic diseases, ADL limitations, and poor self-rated health. Socio-economic determinants of health (wealth and caste) also show strong positive gradients in the prevalence of self-reports of diagnosed chronic diseases, ADL limitations, and poor self-rated health.
Cross-Sectional Correlates of Multi-Morbidity
Table 5 presents estimates from zero-inflated Poisson regression model with probit model taken as zero-inflation model used to examine the determinants of multiple reported diagnosed chronic diseases. Results are consistent with the patterns as indicated in bivariate analysis. Kerala has significantly higher rate (Incidence Rate Ratios [IRR] = 2.5, p < .01) of multiple counts of chronic diseases compared with Punjab. The incidence of multiple morbidities was significantly higher in the older ages and among females. The rate ratio for multiple morbidities increased consistently with the increasing level of education depicting positive socio-economic gradients with the prevalence of multi-morbidity. Among the health risk factors, higher level of physical activity showed significant negative association with multi-morbidity.
Estimates of Zero-Inflated Poisson Model With Probit Inflation Model for Number of Reported Diagnosed Chronic Diseases Among Older Adults, LASI Pilot Survey, 2010.

Note. LASI = Longitudinal Aging Study in India; IRR=Incidence Rate Ratios; the values in the paranthese refer to the 95% confidence interval.
Vigorous/moderate physical activity for more than 20 min continuously for more than 1 day in a week.
Solid fuel include coal, charcoal, crop residue, burning wood, and dung cake.
p < .1. **p < .05. ***p < .01.
Association of Multi-Morbidity With ADL Limitations and Self-Rated Health
Table 6 presents the effects of increasing levels of multi-morbidity on health outcomes: functional limitation and the self-rated health while adjusting for the background characteristics. The number of persons with three or more chronic diseases is too small; therefore, in this analysis, we have combined the two and more diseases as one category. The risk of poor health outcomes for both ADL limitations and self-rated health shows an increase with increasing number of chronic morbidities, and the effects are statistically significant. Moreover, the odds of 1+ ADL limitation and poor self-rated health are extremely high for 2+ chronic diseases. For example, individuals with 2+ chronic diseases are 6 times more likely to report 1+ ADL limitation and 10 times more likely to report poor health.
Logit Model Estimates to Examine the Effects of Number of Reported Diagnosed Chronic Diseases on the Self-Rated Poor Health and ADL Limitations, LASI Pilot Survey, 2010.
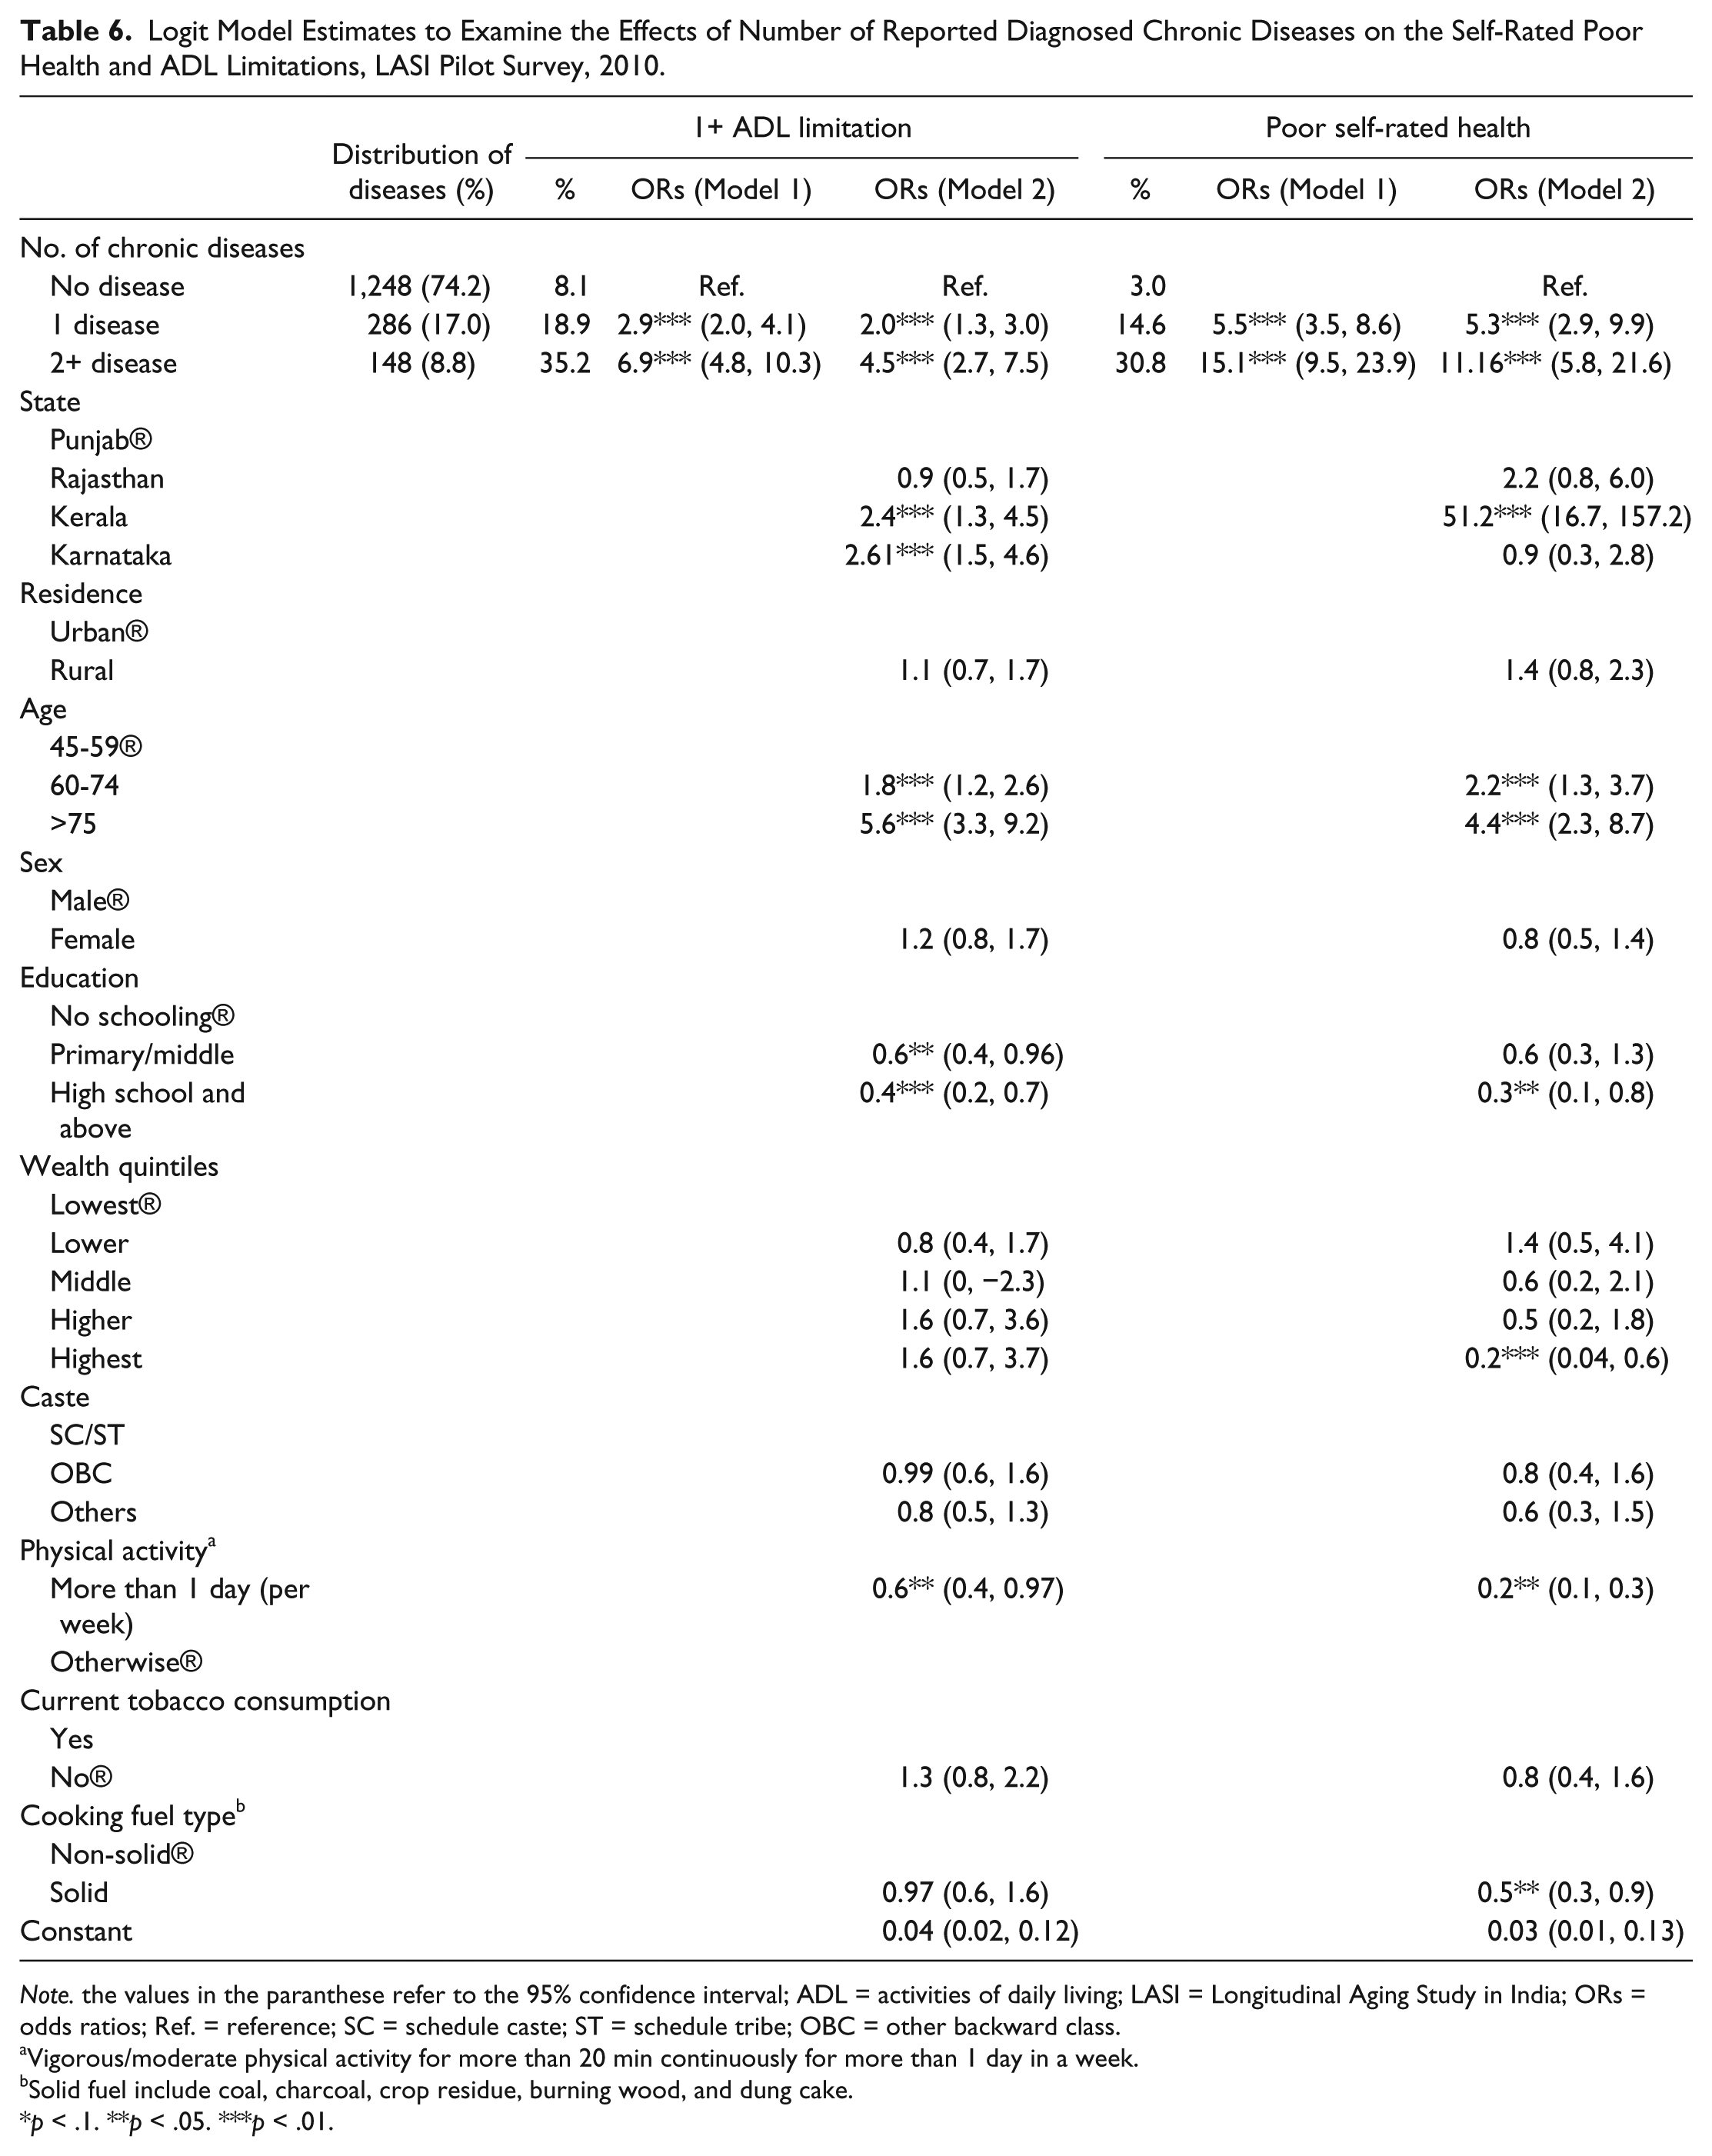
Note. the values in the paranthese refer to the 95% confidence interval; ADL = activities of daily living; LASI = Longitudinal Aging Study in India; ORs = odds ratios; Ref. = reference; SC = schedule caste; ST = schedule tribe; OBC = other backward class.
Vigorous/moderate physical activity for more than 20 min continuously for more than 1 day in a week.
Solid fuel include coal, charcoal, crop residue, burning wood, and dung cake.
p < .1. **p < .05. ***p < .01.
Discussion
This study describes the prevalence of multiple chronic diseases and their effects on functional health and self-rated health status among Indian elderly using data on 1,683 older adults aged 45 and above from the LASI pilot survey, 2010. The findings demonstrate a strong positive gradient of age in the prevalence of multiple chronic diseases among older adults in the age group of 45 years and above. Among the four states, Kerala has the highest prevalence of multiple chronic diseases, whereas Rajasthan has the lowest prevalence. The state variations point to the heterogeneity within India owing to variations in demographic and socio-economic conditions. Results show positive gradients of social determinants in the prevalence of chronic diseases. Chronic diseases reflect a paradoxical pattern of high prevalence of the chronic diseases at higher level of education, wealth, and caste. However, educational status of older adults is seen to be negatively associated with prevalence of ADL limitations and poor self-rated health. Household wealth and caste showed no clear association with these two health indicators. Result highlighting higher chronic disease prevalence in the higher SES groups corresponds with the evidences presented in a number of previous studies in India and other developing countries (Chadha, Radhakrishnan, Ramachandran, Kaul, & Gopinath, 1990; Corsi, Neuman, Finley, & Subramanian, 2012; Dilip, 2002; Singh et al., 1999) but in contrast to the evidences from the developed countries (Adler & Ostrove, 1999; Marmot & Brunner, 1991). Such studies over a longer period have consistently documented a higher prevalence of chronic diseases in the higher SES groups in India. The advocates of this hypothesis argue that the prevalence of chronic disease risk factors such as obesity, high-risk waist–hip ratio, and elevated lipids is higher among higher SES groups (Subramanian, Corsi, Subramanyam, & Smith, 2013). However, some researchers argue that with the progress of epidemiological transition in India, the association between SES and chronic diseases prevalence has reversed from positive to negative(Jeemon & Reddy, 2010). Also, some of the studies in India have documented a negative association between SES and prevalence of chronic diseases, particularly cardiovascular diseases (Gupta et al., 2003; Gupta, Kaul, Agrawal, Guptha, & Gupta, 2010; Reddy et al., 2007; Vellakkal et al., 2013). Such contrasting narratives have led to unsettled conclusions about the SES–health relationships in India. In a recent review article, Subramanian et al. (2013) have attempted to elucidate these contrasting findings on SES–health relationship in India. In this article, authors have primarily reviewed the articles on cardiovascular diseases/cardiovascular risk factors and have argued that the relationship between SES and chronic disease prevalence is positive. They further highlight that many of the studies reporting negative relationship between SES and chronic diseases prevalence have loosely interpreted the data presented in the articles.
However, the positive association between SES and chronic disease prevalence in India and other developing countries should be interpreted with caution as most of the morbidity data in the developing countries are based on self-reports of the respondents and such data are known to be biased (Sen, 2002). Sen (2002) pointed out that an individual’s assessment of his or her health is directly contingent on his or her awareness and social experience, which may not always be in accordance with the appraisal of medical experts.
Furthermore, the analysis of effects of multiple chronic diseases on the functional limitations (ADL limitations) and self-rated health shows that prevalence of ADL limitations and the poor self-rated health has increased manifold among the older adults with more than one chronic disease (multi-morbidity). This finding is consistent with the findings from previous studies, which have shown that multiple chronic morbidities substantially affect other aspects of an individual’s health such as self-rated health, functional limitations, cognition, and quality of life (Fortin et al., 2004; Fried et al., 1999; Galenkamp et al., 2011; Kadam & Croft, 2007; Walker, 2007).
In conclusion, the results of this study suggest that the concomitant experiences of multiple and co-morbid chronic diseases are likely to exert significant adverse effect on the functional and self-rated health. The burden of multiple morbidities and co-morbidities is much higher among the educated and non-poor older adults, but such an outcome is more likely in self-reports of diagnosed morbidities as educated and wealthier older adults have better awareness and capacity to access health care. In contrast, self-report-based results of low prevalence of multiple and co-morbidities among less educated and poor older persons are likely to have substantial burden of undiagnosed chronic diseases.
The findings of this study need to be interpreted in view of the following limitations. This study is based on the data obtained from a pilot survey conducted for the LASI, and therefore, it does not provide the nationally representative estimates; however, efforts have been made to capture the regional, demographic, and socio-economic heterogeneity of the population. Second, the sample size of 1,683 adults aged 45 and above is not amply adequate to carry out the detailed analysis across regions which apparently are in different stages of demographic and epidemiological transition. Finally, the assessment of disease prevalence is based on the reporting of the following question: Has any health professional ever told you that you have any particular chronic disease? This may result in two contrasting scenarios: (a) Some proportion of respondents who were diagnosed and treated may not have the disease at the time of survey, and (b) some proportion of respondents may not be aware about their disease condition and hence might not have consulted the medical professional. This may lead to overall underestimation of the disease prevalence. Also, we dichotomized self-rated health given on a 5-point scale to ensure sufficient cases for analysis. This is likely to lead to loss of information regarding perceived health of older adults.
Despite these common limitations of self-reported morbidity prevalence, this study provides a first time assessment of multiple chronic diseases and their effect on the functional health among older adults (aged 45+) of India.
Footnotes
Acknowledgements
We acknowledge the contribution of the Longitudinal Aging Study of India (LASI) team in conducting LASI pilot survey and furnishing data for further research.
Authors’ Note
No funding was especially given for this study. However, this study has used the data from Longitudinal Aging Study of India (LASI) pilot study, 2010, which was funded by National Institutes on Ageing/National Institutes of Health (R21 AG032572-01).
Declaration of Conflicting Interests
The author(s) declared no potential conflicts of interest with respect to the research, authorship, and/or publication of this article.
Funding
The author(s) received no financial support for the research and/or authorship of this article.