
Abstract
This study analyzed crime statistics of 2011/2012 with objectives to compare the characteristics of criminals based on correlates of crime such as age, gender, types of occupation, level of education, and marital status and to examine features of victimization by age and sex. The study was conducted in Oromia National Regional State. Police crime data of 2011/2012 were used. Furthermore, key informant interview was used. Descriptive statistics such as percentages, frequencies, and ratios were primarily used to analyze the aggregate police data. It is found that sociocultural and structural factors affect criminality and victimization patterns. The total number of criminals reported to and recorded by the police was 96,300, which constitute 85,100 male and 11,200 female offenders. About 37% of these criminals committed violent crime. The ratio of male to female offenders was 7.6:1. The dominance of male over female both in criminality and victimization is the extension of their social position in social structure and result of gender role socialization. Age group 19 to 30 was found to be the most criminal population with the criminal rate of 828 per 100,000 people. Unfortunately, the relationship between educational status, types of occupation/employment, and marital status on one hand and criminality on the other were less than conclusive mainly because of lack of adequate information on such variables for individual criminals and victims or the fact that the police data were only aggregate ones. Victimization rate was higher for males and 31 to 50 age category.
Introduction
Criminality and victimization are patterned social behaviors subject to empirical explanations. The behaviors are socially patterned because they are shaped by intricate sociocultural, economic, and political conditions. Hence, they are not individually determined as they appear and are disseminated in mass media. Not only crime features and criminal tendency but also reactions to them reflect the socioeconomic and political conditions of certain society. They occur in every society although relative variations in type and magnitude are unavoidable. For example, Durkheim argued that crime is inevitable within a society (Siegel, 2003).
Violation of mores 1 and folkways 2 could be subjected to social disapproval, whereas criminal law violations, which are considered more serious violation, can only be subjected to physical coercion and punishment (Siegel, 2003). The effectiveness of informal social control is weakened by the diversity of sub-cultural norms, lifestyles, and occupational activities. Structural factors that affect both criminality and victimization are age category, gender, occupation or employment condition, and marital and educational status. Criminal statistics of different countries show that a prevalence rate of the indictable offenses has the peak age of known offenders that falls within young age category after which the rate drops steadily (Coleman & Moynihan, 1996).
The relative rarity of female criminals is also quite clear from the criminal statistics. Women often commit less serious offenses compared with males and the types of crime in which women are most involved are underreported. Some scholars believe that gender has remained implicit to criminology. For instance, Jefferson (1993) cited in Coleman and Moynihan (1996) has argued that crime was men’s work (and not women’s) and that central criminological assumption has not been adequately explored. Understanding structural circumstances that shape views toward females’ criminality and criminalization is still quite helpful in analyzing gender–crime relationship (Walklate, 2007). Such simplistic sex-based division of labor perspective both distorts the reality and leaves the matter unexplored. The latter in turn creates a vacuum in gender–crime empirical studies.
The relationship between criminality and employment has been a point of disagreement among criminologists. Although some scholars have argued that unemployed persons are more likely to be stopped by police and receive a custodial sentence, others have disagreed mentioning that social class is irrelevant for criminality (Coleman & Moynihan, 1996). Yet, it is generally accepted that there is a correlation between social class and offending behavior (Siegel, 2003).
Accordingly, criminals can be differentiated by age, race, ethnicity, gender, and socioeconomic level. In other words, these characteristics enable us to group criminals and victims into categories to understand why some people are more likely susceptible than others. Offenders and victims are found in disproportionate numbers among these sub-groups of the population. However, the influences of the dark figure on the proportion of offenders and victims across these categories also deserve attention in examining each chosen variable (Coleman & Moynihan, 1996).
Crime incidences involve relationships between the offender and the victim who receive the consequences of the activity. Crime poses different problems to victims. Some of the problems, generally, include loss of property, loss of productivity caused by injury, emotional trauma, long-term suffering caused by loss of physical functions, and risk of death. These losses can be grouped as social, economic, physical, emotional, and psychological ills or costs (Siegel, 2003). Siegel argued that knowing the actual number of crime victims in a state or city is quite difficult. However, victimization rate could be roughly estimated in the same way as those of offenses and offenders. Accordingly, patterns in victimization survey findings are stable and repetitive, demonstrating that victimization is not random but a function of largely ecological factors.
Social and demographic characteristics such as gender, age, and social class distinguish potential victims from non-victims (Siegel, 2003). In this regard, one’s social position matters more than individual characters and preferences. Accordingly, except for rape and other sexual assault, males are much more likely to be victims of violent crimes than females; females are much more likely to be attacked by a relative man (husband, boyfriend, family members), or acquaintance than by men in general. Hence, most women victims knew or were familiar with their attackers. As a result, females’ victimization incidence is less reported to criminal agencies given the offenders are socially and physically closer to the victims. Furthermore, young people face a much greater victimization risk than do older persons because of their more risk prone lifestyles. It was also evidenced that the association between marital status and victimization could be influenced by age, gender, and lifestyle (Siegel, 2003).
This study tried to explain criminal and victimization behaviors in Oromia, the largest National Regional State in Ethiopia. Criminal rate, correlates of criminality, and victimization rate were investigated based on number of criminals, types of crimes, and socioeconomic and demographic backgrounds of offenders and victims, reported to and recorded by police commission of the region. There is a serious lack of scientific evidence regarding crime issue in Ethiopia, the gap that this study strived to bridge.
More specifically, the objectives of the study were to compare the characteristics of criminals based on criminality age, gender, types of occupation, level of education, and marital status; to examine features of victimization by age and sex; and to determine criminal and victimization rate. The following are operational definitions of words and phrases, as they were used in this particular research.
Theoretical Frameworks
In the development of causal explanations of delinquency and crime, the usual procedure is to identify factors, or variables, that are associated with the behaviors. The theories of delinquency attempt to explain delinquency, not to determine causality. Although no one theory is able to provide the causal answer, some appear to be stronger than others (Shoemaker, 1996). Modern criminological theories are turning away from the search for final causes and are dealing with probabilities rather than demanding misleading certainty. Structural, cultural, and social process models are more apt to look at societal conditions to explain criminal behavior (Kelly, 1990). Experts in the field believe that the key to understanding delinquent behavior lies in the social environment.
Sociologists argue that explanations of crime and delinquency as an individual-level phenomenon fail to account for the consistent social patterns of the behavior. They rather use structural model, which asserts crime is best seen as an expression of structural changes in the economy, opportunities, societal values, and changing roles and relationships. They look at the social forces producing criminal behavior, including neighborhood condition, poverty, socialization, and group interaction (Siegel, 2003).
The social structure theories tie crime rates to socioeconomic conditions and cultural values. The system of legitimate opportunities for achieving success, such as the availability of educational and occupational pursuits, is not evenly distributed within the society (Shoemaker, 1996). According to this argument, although most people can obtain some types of job, the ability to secure a high-paying position, or one with advancement potential, is dependent on a variety of conditions that a large part of the population does not possess.
Another theory called theory of differential opportunity argues that poverty of the lower classes prevents them from using legitimate means, such as education, to acquire valued goods, thus giving them no alternative but to engage in illegitimate activities. Whether they actually commit crimes depends on their access to the structures of legitimate opportunity. The logical conclusion, here, is that opening up avenues of educational and economic opportunity will reduce criminality (Clinard & Abbott, 1973). The theory also stresses access to illegitimate means, and it is this aspect that may represent the key, rather than the blocking of economic and educational opportunities, to an understanding of criminality in less developed countries. That is, the illegitimate opportunity structures also determine the form of deviance (Clinard & Abbott, 1973).
Social process theories emphasize socialization as the key determinant of behavior. Socialization theory is also called social control theory because the most important way we exercise that control is through the process of socialization (Williams & Mcshane, 1994). And, sociologists believe that the socialization process affects social deviance in three different ways: learning, control, and reaction. Criminal behavior is, therefore, the result of incomplete or negatively focused socialization process (Siegel, 2003).
Finally, social reaction theories, also known as labeling theory, argue that the way society reacts to individuals and the way individuals react to society determines behavior. Labeling theory posits that society creates deviance through a system of social control agencies that designate (or label) certain individuals as criminal, thereby stigmatizing them and encouraging them to accept this negative identity. Hence, once people are labeled “criminal,” it remains their master status (Williams & Mcshane, 1994, p. 134). Accordingly, social process and social structure theories are used in this study in interpreting criminal behaviors.
Method and Materials
Study Area
The study was conducted in Oromia National Regional State, Ethiopia. The country is located in the Horn of Africa with ethno-linguistic based federal structure since 1991. It constitutes nine regional states, among which Oromia is the largest in terms of physical territory, population size, and natural resource endowments. Located at the center of the country, Oromia is bordered by all regional states except one, Tigray. It also hosts the capital city of the country, Addis Ababa (Finfinne), which is also the headquarters of African Union, and seat of other regional and international organizations. As a result, intensive political, social, economic, and cultural interactions take place in it. Oromia’s police crime data do not include records of the capital because the capital independently manages all administrative issues through its city administrative structures.
Instruments, Data Collection, and Analysis
Secondary data source or official crime statistics were used to serve the purpose of the study. In addition, key informant interviews were used. The police data were analyzed using descriptive statistics such as percentages, ratios, and frequencies; and the results were presented using tables. Qualitative information obtained from 10 experienced police officers and data recorders were thematically analyzed simultaneously with the quantitative data. Aggregate crime statistics were taken from Oromia Police Commission and were systematically compiled to make them ready for analyses. Checklist was used to compile data from the police commission and interview guide was used to interview the key informants. In conducting this study, the following ethical considerations and safety measures were made. First, administrative ethical procedures were followed. Second, information gathered and the overall interpretation made were secured from exposure to the third parties.
It is imperative to pinpoint some limitations, in addition to the dark figure mentioned earlier, inherent to criminal statistics used in this study. The police data used in this study are in an aggregate form; that is, only the total number of criminals or victims under each category in the police recording format is available. No detail of personal data of each individual offender or victim is obtained which, in turn, hampers statistical manipulations to determine relationship between crime and its correlates. The only alternative means of analyzing the data is drawing associations between the variables on categorical bases. Consequently, only possible explanations of the associations could be made based on criminological theories consulted and qualitative information obtained.
Results and Discussion
The Total Volume of Offenders and Sex Ratio
In this sub-section, frequency of offenders is presented and analyzed based on the reported and recorded police statistics in 2011/2012. Criminal ratios and rates could be determined based on the total number of known offenders in relation to the total population of the region. Although this is a very rough indicator of criminal incidence because the actual number of offenders in Oromia cannot be known, it gives a general insight into the size of offenders in the region.
Table 1 gives a general overview of the total number of known offenders and male to female criminal ratio. The total number of criminals reported to the police was 96,300 out of which male and female offenders were 85,100 (88.37%) and 11,200 (11.63%) respectively. That is, female offenders share nearly 1/10 of all criminals in Oromia. The ratio of male to female offenders was 7.6:1, which tells us that for every female offender, there are nearly 8 male offenders. Or for 100 female offenders, there are 760 male offenders.
The Total Number, Percentage, and Ratio of Criminals by Sex, 2011/2012 (to the Nearest 100).
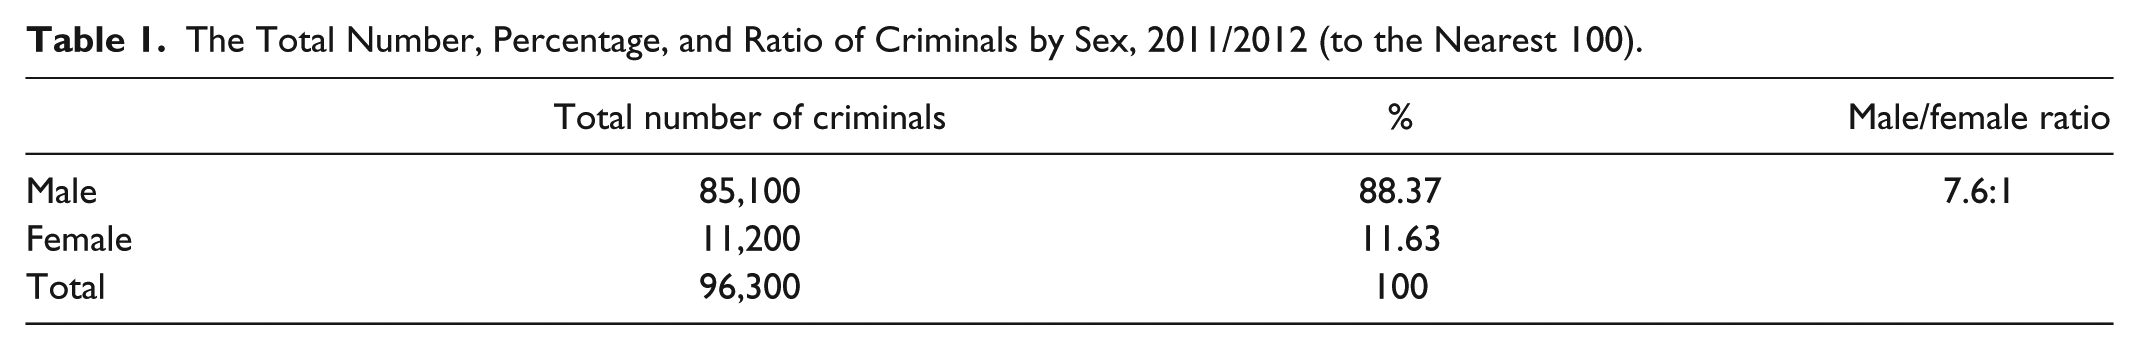
Compared with the male to female criminal ratio in Addis Ababa during the last decade, which ranges from 6.01 to 7.02, Oromia’s is larger. Precautions should be taken not to mistakenly conclude that female criminal involvement in Addis Ababa must be greater. Let us look at some possible affecting factors.
Although the ratio of male to female criminality can be significant, it may not be as large as it was reported to and recorded by the police both in Oromia and in Addis Ababa. In both areas, females’ criminal act is less reported because of different factors. The police officers interviewed in this study reported that attention is diverted from female criminals assuming that they are less harmful. Moreover, keeping female offenders in prison is administratively difficult and demands larger cost. Yet, the aggregate data and information obtained from the police officers prove that males’ criminality is by far greater than that of females.
In addition, one cannot be sure that there is more females’ criminal involvement in Addis Ababa, and it is even difficult to verify the difference just based on criminal statistics. First, the dark figure in general and of females in particular hampers such conclusions. Second, females’ socioeconomic and political situations limit both their criminal involvement and their access to the criminal justice system (Jibat, 2011). Hence, much of their experience both as criminals and victims is less reported to and less known by the police. The controversy is that while many women are confined to home and its surrounding hence their criminal involvement is limited, their offensive behavior in home setting escape from police access and report. The confinements are even greater in Oromia (most of which is rural area) compared with urban centers accompanied by absence of police personnel in the latter.
Table 2 shows further details of number of criminals by types and sex of criminals. The information helps to identify the degree of criminal involvement by type of crime and criminal course of each sex in relation to crime category. Accordingly, 35,800 (37.2%), 27,000 (28.0%), and 33,500 (34.8%) criminals engaged in violent, property, and other crimes, respectively. In this study, the phrase other crimes includes those that do not fall within crimes against persons or property. Violations of rules and regulations, victimless crimes, and crimes against the state comprise most of it. This order more or less matches with that of the number of crimes recorded for each type in the same year, yet relatively more criminals (proportionally) tend to engage in violent crimes. The disproportional size of criminals between violent and other crimes could be because of the involvement of many people in a single criminal act.
The Total Number of Criminals by Crime Categories by Sex.

Source. Oromia Police Commission 2012. Crime Statistics. Unpublished Official Material. Addis Ababa, Ethiopia.
Table 2 presents crime list and respective number of criminals by sex as it is used by the police commission in recording and reporting crime data. The format is commonly used across regions, city administrations, and federal police commissions for the sake of uniform communication through the ladders of reporting. The report goes from kebele (the smallest administrative unit in Ethiopia) through woredas and zones to regions and finally, federal police structures. To ensure ease of communication for the local readers, same list is maintained in this report; only translation from Amharic to English is made.
The list consists 43 crime items, which are classified into three categories by researchers for the sake of suitability of analysis. Violent crimes or crimes against the person comprise 9 crimes in which a total of 35,767 (37%) criminals have involved in this particular year. Although crimes against property consist of longer list of 27 crime items, it relatively accounts for lesser proportion of criminals, 26,999 (28%) of all. A major contributing factor for proportionally larger number of criminals’ involvement in violent crimes (crimes against the person) is patterns of each crime. Information obtained from the police officers show that a crime against the person in rural Oromia involves a group of people in disputes over land. Family members, relatives, and sometimes broader kinship members engage in a single crime. Finally, “other crimes” category with seven crime items is ranked second in terms of the number of criminals, 33,500 (34.8%), in the year.
Aggravated assault is a Number-1 ranked and single most common crime committed by 28,268 (79%) of violent criminals and 29% percent of all criminals followed by miscellaneous theft/larceny, which is committed by 14,271 criminals. Number of criminals in different forms of homicide sum up to 5,433 accounting for 5.6% of all criminals ranked third. According to the key informants, most aggravated assault and homicide are reported from rural areas whereas significant numbers of theft criminals are from towns. Factors for having larger number of criminals involved in aggravated assault and homicide are that these crimes are rarely underreported and the police give them better attention because they involve human lives.
Correlates of Criminal Behavior
In this sub-section, criminal rate and characteristics of criminals based on crime correlates such as sex, age, occupation, level of education, and marital statuses of criminals reported to and recorded by the police were analyzed. Some possible explanations on associations between crime and its correlates are also simultaneously presented based on some selected sociological theories of crime.
Sex and Criminal Behavior
Here, the analysis was made based on the total number of recorded male and female offenders. The primary focus in this sub-section was on the share (proportion) of and dominance between male and female involvement in criminal acts. Descriptive statistics used to measure the proportion and dominance between these two categories of sex are percentage and ratio, respectively. Whereas percentage simply indicates the proportion of each category out of the total number of offenders, ratio exactly shows the amount by which category of a variable (male or female) dominates over the other (Jibat, 2011). As described earlier, the largest proportion of criminals was from male population with the implication that males dominate over females in the criminal population. It is also possible to conclude, based on the criminal population of males and females, that males are more prone to criminality as long as population proportion by sex is nearly equal.
Although ratio is quite important to understand the dominance between the two sexes in criminal involvement, criminal rate by sex is helpful to check the extent of demographic effects on criminality as presented in Table 3.
Criminal Rate by Sex per 100,000 People, 2011/2012 (to the Nearest 100).

Of the total 96,297 criminals, 31,019 (86.7%) are males and 4,748 (13.3%) are females; male to female criminal ratio is 1.65:1. Except in case of abortion (which is among the most underreported type of crime), male offenders dominate over females. These figures tell us that females are nearly 7 times less aggressive than males. Categorically, this is the influence of gender role socialization that dictates the normative behaviors of males and females from early childhood through the consequent life courses. Qualitative data inform that females’ involvement in violent crimes (and also in others) is assisting males than independently acting. When it comes to abortion, which is sex-specific behavior, males take limited roles. Yet, male criminals are outnumbered by only two per year, which again proves males’ frequent criminal involvement even in traditionally female domain roles. In the abortion case, males participate as initiator or doer of the technical practice.
The key informants complain lack of means to get access to information and witnesses with regard to rape. Relatives, family members, and victims themselves keep the rape case secret because of its public significance in the future life of the raped person. That is, publicizing that a female was raped is highly feared for its negative consequences in her social lives including marriage. Furthermore, the rigid legal requirements of three eye witnesses in the dispute handling process by courts in deciding with the criminal status of a suspected person while the offense is secretly done among offenders and victims who are familiar to one another have discouraging effects on police operations.
The criminal rates for male and female populations were, respectively, 1,130 and 114, which indicate that 1,130 and 114 persons in respective categories were criminals. The male population is nearly 10 times more prone to criminal behavior although possible differential interaction between the police and male or female criminals could influence the figure to a certain degree.
Among other factors, lesser females’ criminal record is because of their limited involvement in fewer types of crime and underrecording by the police because of females’ secondary roles in criminal act (Jibat, 2011). For instance, no female offender was recorded on hiding or damaging trade commodities, damaging means of transportation, attempting or damaging production and distributor enterprises, pick-pocketing, and theft of car or its spare parts. Moreover, less than five female offenders were reported per year in each of the following crime items: spying or exposing military secrets (3), burning or other forms of damaging products or attempt (2), burning crops or attempt (4), illegal trading or exchange of gold or other mineral products (1), illegal importing or exporting (trafficking) commodities (1), attempt of intentional burning of home or building (arson; 3), attempt of robbery and snatching (1), burglary (at day; 4), stealing materials from vehicle (1), drug abuse (2), and corruption—giving or receiving (3). (Figures in parentheses are respective number of criminals.)
Generally, most of the crime items listed in police recording characterizes males’ behavior than females’. Hence, females’ confinement to home and its surrounding limits their engagement in these public crimes. On the contrary, criminal behaviors in which females possibly take place in their conventional social positions are excluded from the list. Child and the elderly abuse can be good examples of such behaviors. There is no single crime item, including abortion, in which female offenders outnumber male offenders. This simply shows the extent of the dark figure of female criminal activities. The crime data are, therefore, not only the reflection of actual behaviors of offenders but also a result of recording, which in turn was affected by the norms of criminal justice’s differential treatment of criminals or potential criminals based on certain categorical variables such as sex. Yet, factors that undermine the number of reported female criminals may not invalidate the general thesis that males are more criminals than females as understood from interviews with the police officers. The key informants also informed that although the actual number of female criminals is minimal relative to males, criminality of the former is ever increasing.
The most important factors for females’ low involvement in criminal activities both in Addis Ababa and Oromia seem to be the process of socialization that molds women’s behavior and limited opportunities of females’ socioeconomic positions. Hence, it seems that the difference between these categories is the extension of women’s low participation in social, economic, and political activities, which in turn presents opportunities to violate the laws. This argument is supported by the idea that states opportunities available to females’ criminality are molded by the social, familial, and occupational structures of the lives of women (Williams & Mcshane, 1994). Therefore, it can be taken as part of gender inequality in the broader aspects of life.
Anomie theory seems to suggest that differential goals held for males and females have led to different degrees of violating the “appropriate” means to achieve those goals (Shoemaker, 1996). This indicates that different degrees of expectations are attached to women’s and men’s roles. Theoretically, if women are expected to be good mothers or housewives than to be materially successful, they are less likely to involve in property crimes. Similarly, if they are expected to be submissive/smooth than being aggressive/tough, they remain less likely to engage in violent crimes (Jibat, 2011). So, fewer crimes against person are committed by women. Differential opportunity and treatment, socialization, and social learning/differential association theories have in common the idea that females and males have fundamentally different sub-cultures and learn different values, expectations, aspirations, and roles through a process of socialization (Kelly, 1990).
Accordingly, it seems that women in Oromia (similar to Addis Ababa) still do not have sub-cultures that adequately support their toughness, physical strength, and aggressive behavior compared with men. In other words, women have remained more conformists than men because of differential socialization (Jibat, 2011). Women might have less chance to get skills required to commit offenses, to get outside to involve in criminal activities, and to form peer groups organized for criminal purposes.
Finally, it is imperative to suggest that a lot should be done on male population to reduce its crime proneness without overlooking that of female.
Age and Criminal Behavior
In this sub-section, criminal behavior was analyzed in relation to the age of offenders based on the age category used by the police. Crime statistics obtained from Oromia Police Commission has five age groups of offenders. The five age categories consist unequal width/class interval mainly because offenders within the first two age categories, 9 to 15 and 16 to 18, have special provisions for their treatment. In Ethiopian Criminal Law, children under the age of 9 are not treated as wrongdoers because they are not mature enough to be responsible for their behavior or wrongdoings. Rather, their parents or custodies will be responsible for their offending and victimization behavior. As a result, the police data format has no records for people with ages below 9 years. According to the Ethiopian Criminal Code (Federal Democratic Republic of Ethiopia [FDRE], 2005), the minimum age for juvenile delinquency is 9 years and the maximum 15. Therefore, those between 9 and 15 years constitute minor offenders or juvenile delinquents. Offenders within this age category are not subject to laws and penalties provided in the Criminal Law. They should also not be imprisoned along with adult offenders. Rather, the law orders provision of rehabilitation and vocational services than punishments, and such special treatment should be provided in a separate setting or juvenile centers that can turn them to productive ways of life.
Offenders in the age group 16 to 18 are responsible for their wrongdoings except capital punishment (death penalty). This age group is considered to be and treated as part of juvenile delinquents in many other countries. The assumption is derived from the notion that till 18, people fall under the definition of children and hence need protection from their parents or other custodies. Although such definition holds true in Ethiopia, age group 16 to 18 has been treated as adults when it comes to criminal behavior.
The other age groups, 19 to 30, 31 to 50, and above 50, are fully responsible for their actions, and their punishment can include capital punishment. Here again, the age classification in use has unequal width/class interval for not clearly known reason/s. Determining the relationship between age and criminal behavior is also affected by the population proportion of each group. In determining criminality, therefore, measuring criminal rate for each group would give a better picture so as to know the extent of proneness of each age category compared with others. The crime data were categorized as aggregate than on the bases of individual offenders’ age; so it was very difficult to identify the number of offenders for single age. Hence, it is very difficult to identify the most criminal population on single age basis. Given the number of population for group and single age in 2007 National Population and Census, it is quite possible to rank the criminal tendency of age groups by using criminal rate. Herein, percentage distribution and criminal rate of each age category are presented simultaneously. Table 4 presents the total number of offenders known to the police from each age category per year and those who were convicted for their wrongdoings.
Number, Percentage, Population, and Criminal Rate of Offenders by Age Category, 2011/2012 (to the Nearest 100).

Source. Adapted from criminal data obtained from Oromia Police Commission(2011/2012 ).
In the first age group (9-15), the total number of juvenile delinquents was 2,100 (1,600 males and 500 females), which accounts for 2.2% of all offenders recorded by the police. The top three offenses in which this group involved most were aggravated assault (1,038), miscellaneous theft/larceny (326), and violations of rules and regulations (226). This group has no cases reported on 17 out of the total 43 crime items, only 1 case for 3 items, and less than 5 cases for 4 crime items in the list excluding crime items with 1 case. In particular, there were no female offenders for 24 crime items, only 1 female offender for 4 crimes, and less than 5 cases for 7 crimes. These roughly tell us that people with less than 16 years have limited engagement in criminal activities leaving aside the question of missing cases due to the dark figure. As mentioned herein above, criminal rate provides more accurate measure of criminality than percentage distribution. Accordingly, the criminal rate of this age category shows 40 persons per 100,000 in the age group 9 to 15 were juvenile delinquents in 2011/2012. This age group is the least offending group compared with the rest; its criminal tendency is 16 times less than that of age group 16 to 18.
As information obtained from the police officers give a clue, the number of juvenile delinquents might be underrecorded because of the huge resource demand for juvenile treatment in separate institution as per the order of the Criminal Law of Ethiopia (FDRE, 2005). The law orders that minor offenders need to receive special treatments whereby they should be behaviorally, educationally, and vocationally rehabilitated for which they need separate correction centers from those of adult criminals. Its application is difficult for poor countries such as Ethiopia for the potentially growing number of delinquents continue to consume huge budget. This reality may reflect itself on the size of juvenile delinquents brought to justice system and then properly recorded in the police data. The criminal justice system prefers to keep juvenile delinquents away in the community rather than institutionalizing them.
Volume of offenders in the second age group (16-18) was 12,600 (10,800 males and 1,800 females) or 13.1%, which is a significant share among the five age categories. Like in the first group, the top two offenses in which this group involved most were aggravated assault (4,537) and miscellaneous theft/larceny (2,265), and the third top was social crimes (1,416). There were five crime items for which this age group was not recorded in general whereas females were not recorded as criminals for 11 crimes in the list. Seven crime items had less than five cases.
The criminal rate of this age group was found to be 621 per 100,000 population, which makes it the third criminal population. Nega Jibat (2011) found this age group to be the most criminal population in Addis Ababa. Urban–rural variations to be suitable place for the breeding of deviant behavior best explain the difference between the study areas in this regard. Delinquency is a more common feature of urbanism than rural lifestyles. However, discussions with the police officers during interview clearly indicate that this group is considered very dangerous to the public peace particularly in towns.
The implication is that socializing agents are inefficient in shaping and controlling youth behavior. Because young people are expected to be under control and protection of their families, and other agencies such as school, such proneness to criminal behavior shows that the agents are not functioning well. The wider social environment such as school setting, services of youth recreational centers, access to quality education, and the media must have some deficiencies that contributed to the vulnerability of this age group to deviant behavior. Lack of interest in schooling by growing number of students in both rural and urban centers, which is reflected in large number of school drop-outs and truants, has become a fertile ground for delinquent behaviors. Poor teacher–student relationships, weak and inefficient school disciplinary measures, and less parents’ involvement in school management aggravate the problem. Moreover, uncontrolled expansion of shops serving addictive substances such as alcohol and khat surrounding schools has become a very frightening situation as repeatedly complained by the police officers.
In the third age group, 19 to 30, the total number of offenders was 45,500 (47.3%), 40,400 males and 5,100 females. This age group represents larger number of offenders who became part of the police statistics. Like in the first group, the top three offenses in which this group involved most were aggravated assault (13,828), miscellaneous theft/larceny (7,264), and violations of rules and regulations (7,142). This indicates that these crimes are not age-specific as they are committed by all age groups but at varying levels, with smaller size for the first and the last (>50) age groups and larger for the middle age groups roughly forming a normal curve. This age group has no record on only two crimes, namely, hiding or damaging trade commodities and illegal importing or exporting. And in only two crimes, it has recorded less than five cases. This implies that as age increases, the range of crime in which people engage also increases until the age of 30 and decreases onward. The criminal rate of this age group was 828, ranked first among all age groups.
The number of offenders in age group 31 to 50 was 28,000 (25,000 males and 3,000 females), which is 29.1% of all recorded offenders. This is the second largest group following 19 to 30 age group. This large proportion is partly the function of its class interval because its range is 19 (from 31 to 50) whereas first, second, and third, respectively, have 6, 3, and 11 age ranges. The criminal rate was 688 being the second most criminal population next to age group 19 to 30.
Finally, the last group (above 50) represents 8,100 (7,300 males and 800 females) recorded offenders, which is about 8.4% of all criminals. This smaller proportion roughly indicates that people’s criminal engagement decreases in the later ages and affecting factors could be multiple responsibility, maturity, and physical changes that occur during this period. Although the fifth age group has open upper limit, it represents relatively smaller population because of short life expectancy. This could be understood from the criminal rate, which was 430, the second least criminal population next to age group 9 to 15.
From the discussion above, one can understand that 19 to 30 age group contributes nearly half of the criminal population followed by 31 to 50 age group in Oromia; 9 to 15 contributes the least. However, it is a mistake to conclude that criminal proneness of the age groups necessarily matches with the percentage contribution. That is, one cannot conclude that age group 19 to 30, which shares the largest number of criminals, is the most criminal population. This is the case because criminal population is correctly determined by calculating criminal rates of each age group as indicated in Table 4. The coincidence between the size of percentage proportion and criminal rate of criminals for the age groups is not more than by chance.
Had the data been compiled based on individuals’ age, it would have been possible to come up with the exact peak age of criminals.
Educational Level and Criminal Behavior
The criminal statistics has classified educational levels of offenders into five groups: illiterate, primary level, primary–secondary level, secondary level, and tertiary level. Table 5 provides categories of offenders by their levels of education. The number of illiterate offenders, 46,120, accounted for 47.9% of all, which could be considered significant proportion. This group shared smaller proportion in criminal population of Addis Ababa (Jibat, 2011) compared with other educational groups of offenders except those who attended tertiary level. The difference is best implied by the demographic variations with regard to literacy level. As usually common to other parts of the country, more rural people are illiterate than those of urban mainly because of differential access to education.
Number and Percentages Distribution of Offenders by Educational Category a , 2011/2012 (to the Nearest 10).
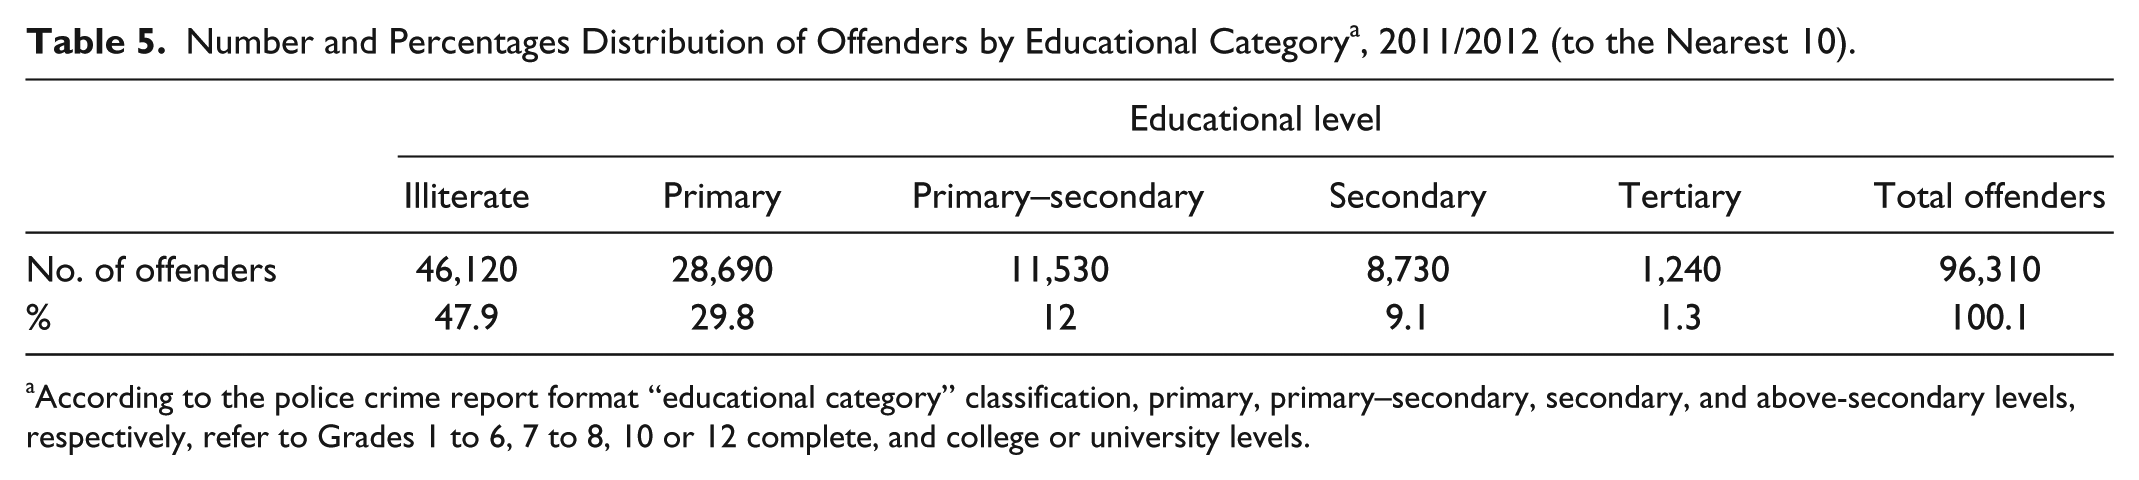
According to the police crime report format “educational category” classification, primary, primary–secondary, secondary, and above-secondary levels, respectively, refer to Grades 1 to 6, 7 to 8, 10 or 12 complete, and college or university levels.
Such significant number and larger proportion of offenders in this educational category might match with our common sense assumptions if we may believe that illiterate people have more propensities toward crime. Demographic factors rather than educational ones might have influenced the number of offenders and their proportion. Therefore, the greater number of offenders in this educational group should not guide us to a misleading conclusion, which wrongly tends to imply that less educated or illiterate people are more likely to commit crime in Oromia. As Addis Ababa provides better access to education for its residents and many of livelihood activities need at least basic writing and reading skills, sizable proportion of its residents are literate compared with Oromia whereby 88% of the people live in rural areas.
Compared with other educational groups, primary level of education had the second largest number or proportion of offenders. Number and percentage of contribution of offenders who have attended above secondary level of education were the smallest; both sum up to only 10.4%.
Generally, the number of offenders in higher educational group has remained the least of all. Here again, we need to take some cautions in interpreting such results. First, demographic factors may affect the size of offenders in this group. That is, the proportion of population who attended above secondary level of education can be fairly estimated to be smaller than other educational groups. This is the case because very small proportion of population in the country has attended higher education. Hence, comparison between such disproportional categories can lead us to misleading findings. Similar condition was observed in criminal proportion of Addis Ababa over the last decade (Jibat, 2011).
Second, being largely dominated by rural areas, it is less likely to find significant number of people who moved to the upper ladder of education as better educated people live in towns because of different pushing and pulling factors. Moreover, as educated people who live in towns are more likely to enjoy higher prestige, public or police’s attention might also be diverted away from criminal behaviors of such people. Nature of their occupation, sophisticated techniques they use to commit criminal acts, having higher power of money and knowledge, more protected working environment, and better structural opportunities open to members of this group can help them to hide their criminal behaviors.
Third, some criminal behaviors of such people such as white-collar crimes (common type of crime in this group) are dealt with special agencies such as anti-corruption commission. Hence, such crimes are less likely to be counted in criminal statistics compiled by the police because the police have no discretion to directly deal with such crimes but only through delegation from anti-corruption commission. Therefore, one should not easily rush to conclude that highly educated people are less likely to commit crimes. Further and detailed research needs to be conducted to fully understand the nature and extent of criminal behaviors of people in higher level of educational category.
Type of Occupation and Criminal Behavior
Hereunder, analysis of criminal involvement of people based on their occupational categories as used by the police commission was made. In the criminal data obtained from Oromia Police Commission, offenders have been classified into five different occupational categories: government employees, employees in private organizations, agrarian, jobless (unemployed), and self-employed.
The least number and the smallest percentage share of offenders in government employee, unemployed, and self-employed resulted from the dominance of agrarian occupational group. Most of rural people, which accounts for nearly 90% in the region, run agrarian livelihood. In other words, the dominance of agrarian offenders by occupation simply resulted from the livelihood’s significant contribution in the study area.
Offenders in government employee comprised the least share of criminals. In addition to factors related to livelihoods, less access and attention given to this occupational category by criminal justice, particularly the police, played important roles. The police officers reported that the police had limited access to know and record crimes committed by this group of people, given that they are physically, socially, and bureaucratically more protected.
Differences in size of offenders and consequent proportion among the group might also be reflections of the groups’ proportion in the total population. Employment statistics with report formats that match with the occupation classification used by the police is not readily available for use. Therefore, it was difficult to determine prevalence rate of each group, which could have given us more informative statistical result. Unfortunately, the police operations were excessively targeted on the jobless people contrary to the facts observed in figures in Table 6. Because the jobless are regarded as potential criminals by criminal justice system. It seems that the police left aside other categories believing that they are less harmful. This wrong perception is specially observed in towns.
Number and Percentages Distribution of Offenders by Occupational Categories, 2011/2012 (to the Nearest 10).

Jobless occupational category comprised the second least number of offenders, which partly implies that less people are unemployed in the region than unemployed people are less prone to criminality.
Marital Status and Crime
As Table 7 indicates, crime data obtained from Oromia Police Commission provide overall clues on crime distribution in relation to marital statuses of offenders. In this regard, offenders were generally classified into two broader categories (married and unmarried) based on their marital status at the time of their conviction.
Number, Percentages Distribution, and Ratio of Offenders by Marital Status, 2011/2012 (to the Nearest 10).
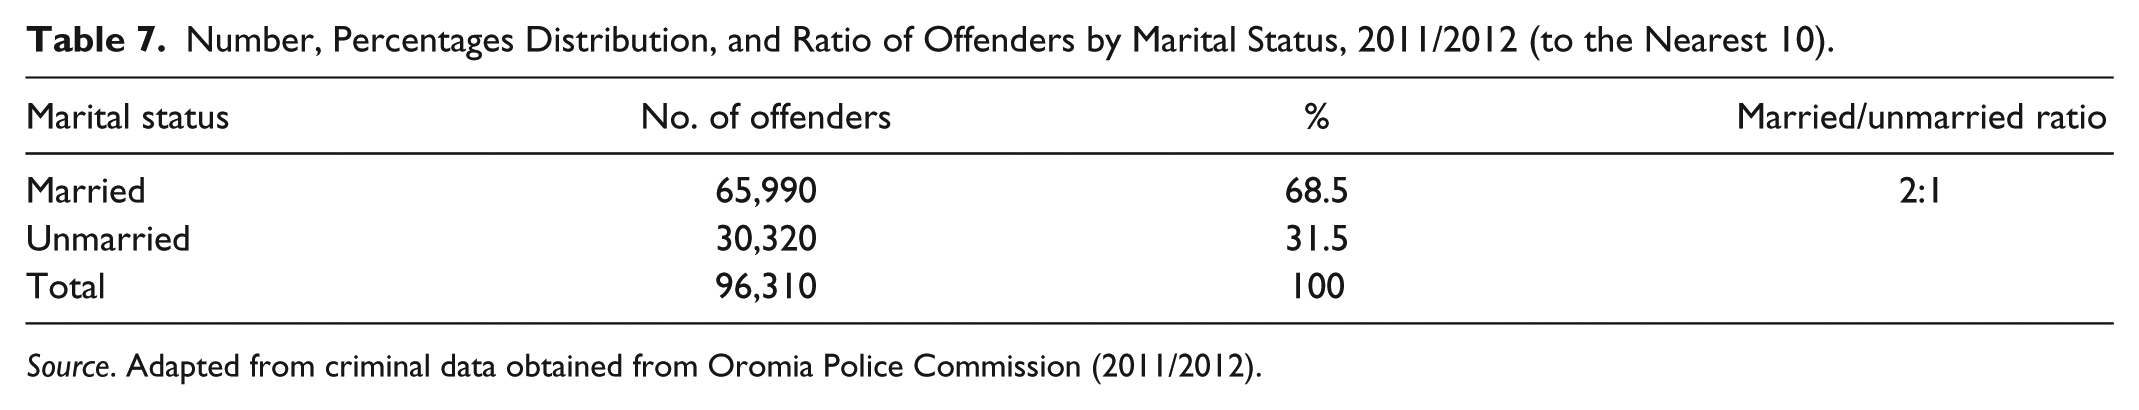
Source. Adapted from criminal data obtained from Oromia Police Commission (2011/2012).
The largest number of offenders (65,990) was married people, which accounted for nearly 70% of all criminals. Unmarried offenders constituted a bit greater than 30%. The proportion was just opposite in the case of Addis Ababa (Jibat, 2011). The average of married and unmarried offenders was 27% and 73%, respectively, during 2001 to 2010 in which unmarried offenders were nearly 3 times more than married offenders.
Some explanations are quite necessary for such crime–marital status relationships. In the first place, difference in number of offenders based on marital status could be resulted from population proportion of both statuses, that is, demographic factors such as unmarried to married ratio of the total population of the region can disproportionately affect the corresponding number of offenders. Married to unmarried offenders’ ratio is 2:1. That is, for every 100 unmarried offenders, there are 200 married offenders.
Second, variation of marriage values and practices between the two areas could also affect population proportion of married and unmarried people. Greater pressure toward marriage is expected in rural areas whereby traditional marriage arrangement is prevalent. Such possible demographic variation could indirectly influence the criminal population.
Therefore, such factors could simultaneously influence both their marital status and their criminal behavior. Hence, the causal relationship between marital status and criminal involvement might be a spurious one because a third variable might have caused people to be both unmarried (never married or divorced at the time of conviction) and prone to crime (Jibat, 2011). The qualitative information brings an opposite. Nearly all key informants perceive that unmarried people are more criminally prone assuming that married people are more responsible, accountable, and trustful.
Victims of the Criminal Behavior
In this section, the total number, proportion, ratio, and criminal rate of victims by age and sex were provided just to give an overview of crime victimization in Oromia. Using police data is not the best technique to understand features of victimizations; victimization surveys provide more accurate, although not perfect, information. Unfortunately, there is no agency that conducts victimization surveys in Ethiopia. Yet, official data can give an insight into crime victimization.
Incidence, Proportion, and Ratio of Victimization by Sex and Age
The criminal data compiled by the police classify victims based on their sex and age. Generally, it was found that more males were victims of crime compared with females. And, victimization increases as age increases until late 20s and continuously decline afterward.
The total number of victims recorded in the year was 17,214 out of which males were 13,397 (77.8%) and females 3,817 (22.2%) [see Table 8]. Male to female victimization ratio was 3.5:1, which is to mean for every female victim, there were 3.5 male victims. In other words, for every 100 female victims, there were 350 male victims. So, male victims were more than threefolds compared with female criminals. Male to female victimization ratio correlates with age. As age increases, male to female victimization ratio also increases from 1.2 (for 9-15 age group) to 5.9 (for age group above 50). Identification of factors that contributed to such differences needs further studies.
Number, Percentage, and Ratio of Victims by Sex and Age, 2011/2012.
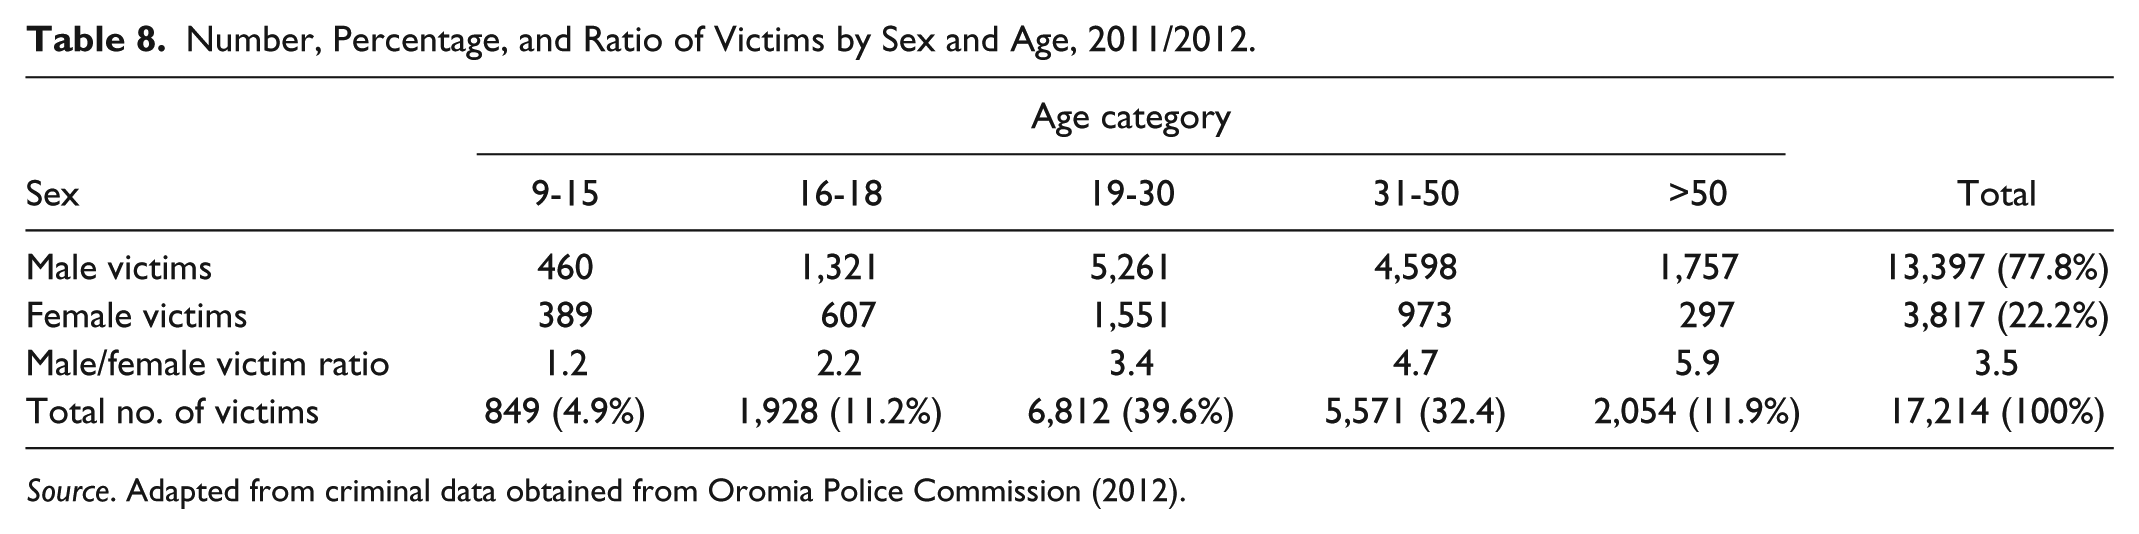
Source. Adapted from criminal data obtained from Oromia Police Commission (2012).
Although the dark figure is expected to be high for victimization because of the methodological limitation mentioned above, the number of victims could be less than those of offenders and offenses. This happens because of the fact that targets of some crimes are not humans; rather, they can be rules and regulations, social norms, public/state property, and even the state itself. Moreover, the format does not contain columns for population of less than 9 years age at all. All crimes for these correspondences and victimized children are missing from the police statistics.
The male to female victim ratio of Oromia (3.5:1) is greater than that of Addis Ababa, which was 2.2:1 on average for the decade 2001 to 2010.
The fact that males dominate females both as offenders and victims may not be a simple coincidence. It must be related to the sociocultural, structural, and political structures. For instance, social position occupied by and social roles expected from males and females could have behavioral effects on them including criminal behavior. This argument is quite feasible because crime is mainly a patterned behavior that is socially shaped. Moreover, interactional processes such as gender role socialization and nature of social control mechanisms can influence not only criminality and victimization but also their recordings.
Lesser female victimization can be partly the result of the dark figure. Different females’ and males’ experiences, and differential interaction with the police can also affect it. Females are also usually attacked by someone very familiar to them, whose offenses are less exposed to criminal justice system outside home. In addition, they have limited access to the criminal justice system because of lack of information and patriarchal cultural effects that forces women to tolerate harms made to them by their fathers, husbands, and brothers than reporting the cases to the police. These result in many underreported victimization experiences such as domestic violence, rape, labor and/or exploitation, harassment, and so on.
Interviews with the police officers gave us insights that they attributed criminalization to individual characteristics and behaviors. More of their explanations tend to make victims responsible for loss, damage, or harm they incur although they do not totally disregard environmental factors. The officers largely associated victimization to lack of care and control over one’s own property and behavior. Although the present researchers do not deny the role of personal attributes to determine it, victimization such as that of criminality is more likely characterized socially than individually. The behavior is patterned into sex, age, occupation, and educational structures whereby individuals are positioned. It is not the matter of choice rather situation determines. It is imperative to argue that a girl schooled in sub-standard public school is more likely to be victim than a boy in the same school or a girl in a more protected private school, given that intervening variables are controlled. An elderly living in broken house in a poor neighborhood is potentially at risk of criminal attack than another elderly living in a protected corner of a city, if we forget other variables.
Victimization Rate
This sub-section presents the rate of victimization based on age group and sex categories. Victimization rate shows clearer extent of victims of the total population, males and females, and different age categories. The rate was determined based on population size and the number of age- and sex-based (reported) victims.
As shown in Table 9, the victimization rate sharply increased with age increment. Victimization rate of age group 9 to 15 was the least of all, 16 people per 100,000. The rate was 95 for age group 16 to 18, about 6 times larger than that of 9 to 15. The increment continued through the next two age groups (19-30 and 31-50) before it started to decline after 50. The overall victimization rate of population above 9 (inclusive) was 92 per 100,000 people.
Number of Victims and Population and Victimization Rate by Age Group per 100,000, 2011/2012.

Note. Source of population size: : Central Statistics Authority (2007).
Given the population size and number of victims above 9 years old for males and females, because of missing records for victims under 9 in the police statistics, the victimization rates for males and females were, respectively, 144 and 41 per 100,000 (See table 10). The victimization rate of male population was more than threefolds of that of females. The victimization rate for both males and females could be as low as 144 and 41 partly because of underrecording as a result of the so-called “victimless crimes,” crimes that are non-violent in nature and do not receive attention from the police.
Number of Victims, Population, and Victimization Rate by Sex per 100,000, 2011/2012.
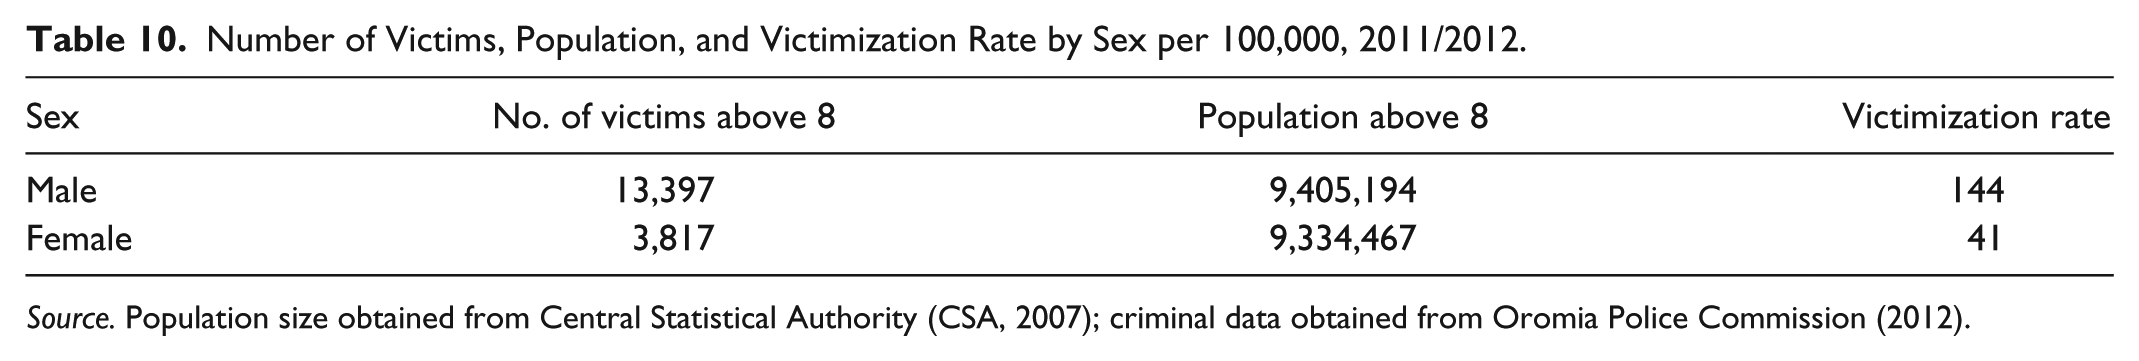
Source. Population size obtained from Central Statistical Authority (CSA, 2007); criminal data obtained from Oromia Police Commission (2012).
Conclusion
The large male to female offender ratio in criminal activity is the result of the combination of gender influences and dark figures due to different reasons. Low criminal participation of women in crime is the extension of their low public participation outside home settings; it mainly resulted from lack of opportunities to targets or victims of crime that are located in public spaces from which most women are blocked-off. In addition, less access to women’s illegal activities in the existing socioeconomic, cultural, and political spheres by the criminal justice system downsizes females’ criminal statistics.
Age group 19 to 30 represents the most criminal population. Different types of crimes were committed to different extent by different age groups, which also affect proneness to crime. In this age group, for example, aggravated assault, theft, and social crimes were commonly committed, and these crime items have larger proportion among the list of single crimes.
The dominance of farmer criminals in the criminal population was the implication of demographic effect than any other possible factors given we cannot determine criminal rate by occupational categories because getting population size of these categories is difficult.
There was no clear association between marital status and the propensity of being criminal simply based on results obtained from aggregate data in Oromia. Although demographic factors could partly affect the results, marital status differently characterizes criminality in rural and urban areas. However, robust investigation is required in the future to come up with strong conclusive remarks.
The association between criminal rate and victimization rate by age and sex may not be a simple coincidence. Rather, it could have resulted from differential socialization, life experiences, opportunities, and sociocultural and political structures. Yet, the growing tendency of victimization rate in the later age than their criminal rate implies the greater tendency of vulnerability of the elderly to many social, economic, and political challenges compared with their counterparts (young and adult population).
Footnotes
Acknowledgements
We would like to thank Jimma University for funding this research and Oromia Police Commission and its officers for providing official data, without which this study could not have been materialized.
Declaration of Conflicting Interests
The author(s) declared no potential conflicts of interest with respect to the research, authorship, and/or publication of this article.
Funding
The author(s) received no financial support for the research and/or authorship of this article.