
Abstract
There is great emphasis recently on improving the quality of early childhood education in the United States. Within quality rating improvement systems, classroom quality is often reported at the center or program levels. Yet little is known about teaching quality at the center level or the influence of center characteristics on teaching quality. Specifically, this study examines the extent to which the quality of emotional support provided by the teacher is associated with characteristics of the center (e.g., prior turnover rates) and center director (e.g., education, management practices). Findings from Head Start Family and Child Experiences Survey (FACES) 2009 data indicated that emotional support dimensions were differentially predicted by characteristics of the center and the director, including prior teacher turnover rate and director job satisfaction. However, highly regulated indicators of center quality (e.g., student:teacher ratio) did not substantially explain emotional support.
At federal, state, and local levels, there has been a massive push to increase the quality of early childhood education. For example, the Race to the Top Early Learning Challenge and the new Head Start performance standards have increased the pressure for states and programs to use appropriate assessments of classroom quality (National Research Council of the National Academies, 2008). This is a well-founded focus given that an abundance of literature has established a link between classroom quality and children’s outcomes (e.g., Burchinal, Vandergrift, Pianta, & Mashburn, 2009; Curby et al., 2009; Mashburn et al., 2008; National Institute of Child Health and Human Development [NICHD] Early Child Care Research Network, 2003; Peisner-Feinberg et al., 2001).
The growing attention to the importance of quality has resulted in many states adopting quality rating improvement systems (QRISs) intended to hold centers accountable to standard definitions of quality. Levels of quality are typically conveyed to perspective parents and policy makers at the center level through indicators such as stars or medals (Tout et al., 2010), which summarize a variety of ratings into a single, easily interpreted rating. In many states, including Virginia and Minnesota (Tout et al., 2010), these ratings incorporate measures of classroom quality for some or all classrooms in a center (Zellman & Perlman, 2008). Due to cost considerations, classroom observations are often completed in only a subset of classrooms in a center. Particularly, when a small proportion of classrooms are observed in a center, this approach necessarily assumes that the selected classrooms are a good representation of the center (Karoly, Zellman, & Perlman, 2013). The purpose of this study is to quantify the degree to which one aspect of classroom quality, emotional support, is a center-level phenomenon and to begin to unravel the influence of center and center director characteristics on classroom quality.
Classroom Quality and Children’s Outcomes
Children’s experiences in early childhood classrooms can establish a cycle of future social success or failure (Campbell & von Stauffenberg, 2008). In classrooms, the quality of teachers’ interactions with children is one of the most salient features children experience (Pianta, 1999). These interactions are often divided into three domains: emotional support, classroom organization, and instructional support. In particular, emotionally supportive interactions between children and the adults who care for them positively influence children’s development academically and socially (Howes et al., 2008; Mashburn et al., 2008; Rimm-Kaufman & Pianta, 2000; Stipek & Byler, 2004). Emotionally supportive teachers tend to be more aware of students’ needs for extra academic or social support and tend to respond appropriately to these needs (Hamre & Pianta, 2007). Consequently, children in classrooms with more supportive teachers display more adaptive learning behaviors and better academic outcomes (Graziano, Reavis, Keane, & Calkins, 2007; Hamre & Pianta, 2005; Rimm-Kaufman, Curby, Grimm, Nathanson, & Brock, 2009), and lower rates of problem behaviors, negative affect, and aggression (Howes et al., 2008; NICHD Early Child Care Research Network, 2003; Zinsser, Bailey, Curby, Denham & Bassett, 2013).
Center-Level Influences on Classroom Quality
Beyond the individual classroom, a smaller body of research (Bloom, 2010; Zinsser, 2013) has considered influences at the center level, which may contribute to quality teaching and children’s achievement. Early childhood centers are more than a series of contiguous classrooms, operating independently with no effect on each other. Although center climate may be a more distal influence than the classroom (Bronfenbrenner & Morris, 2006), center-level policies and the center director affect classroom practice, which in turn can affect child outcomes. In other words, children attending early childhood programs are influenced not just by their teachers and close peers but also by the less immediate and indirect features of the early childhood environment, including structural (teacher–child ratios), procedural (hiring decisions), and interpersonal features (employee job satisfaction) of the center in which the child’s classroom operates.
Salary, Education, Student–Teacher Ratio
Some of the most tangible aspects of early childhood center management have to do with how staff members are paid, their levels of training, and the ratios of children to adults in each classroom. There is a great deal of variance in the annual salaries of administrators of early childhood education centers, with top earners receiving nearly US$60,000 more per year than the bottom 10% of center directors (U.S. Bureau of Labor Statistics, 2014). Furthermore, director education has been found to be a predictor of overall program quality (McCormick Center for Early Childhood Leadership, 2012), although the directionality of the association cannot be assumed. Bloom describes center directors as “gate-keepers to quality” (Bloom, 1999, p. 207). Through providing graduate-level training for center administrators, Bloom and others have shown that more highly educated directors are better able to support high-quality teaching (Bloom & Sheerer, 1992). In Bloom and Sheerer’s (1992) study, directors who completed the advanced certificate program reported greater perceived competence and decision-making influence, and higher commitment to their centers than directors in a control group. Bloom and Sheerer also observed significant differences in teacher quality, as measured by the Early Childhood Classroom Observation Scale, across the training and control groups, indicating that directors’ education may have pronounced impacts on the quality of teachers’ interactions with children.
Ratios have long been considered a critical component of program quality (Howes, 1982), whereby smaller teacher:child ratios are considered indicators of higher quality. As such, child care centers are required to operate within acceptable ratio ranges as determined by state accrediting bodies and Head Start performance standards. Therefore ratios may not statistically relate to measures of quality because of these restricted ranges. Mashburn et al. (2008) found that there was a small positive correlation between ratio and classroom emotional support at the classroom level.
Supportive Management
There is a positive relationship between the quality of center management practices and the quality of children’s learning environments (Lower & Cassidy, 2007). Directors who are able to foster a sense of community for teachers may facilitate positive attitudes toward teaching and help them be more committed to and satisfied with their jobs, all critical components of a high-quality education (McGinty, Justice, & Rimm-Kaufman, 2008).
Unsatisfied teachers are more likely to contemplate leaving their position while more satisfied teachers feel more committed to the field of early childhood education (Saari & Judge, 2004). Turnover rates for preschool teachers have been previously documented at 25% to 50% annually; comparatively, public elementary school teacher turnover is about 7% annually (Barnett et al., 2010). The instability of the preschool teacher workforce has been attributed to a variety of conditions associated with early childhood education, such as isolationism, perceived lack of career reward, and lack of preparation (McGinty et al., 2008). Stress and low overall job satisfaction especially contribute to teacher turnover (Rosenholtz & Simpson, 1990; Sutton & Wheatley, 2003) and degrade teachers’ abilities to be emotionally supportive (Jennings & Greenberg, 2009). Teachers who experience higher levels of stress at work are less consistent in their emotional support and also tend to have students who display greater negativity and aggression (Zinsser et al., 2013).Turnover can have a large effect on a center. High turnover rates year over year are likely to be an indicator of poor quality for a center. However, center directors may also counsel underperforming teachers out, giving the director an opportunity to affect program quality by hiring new teachers (Zinsser, 2013). Recently, turnover rates were additionally affected by changes in Head Start policies. The Improving Head Start for School Readiness Act of 2007 stipulated timelines for new minimum education requirements for classroom teachers—by 2011 all classroom teachers needed a minimum of an associate’s degree and by 2013 half of all classroom teachers within a center were required to hold a bachelor’s degree or higher. Thus, centers employing a larger number of undereducated teachers likely have turned over a number of positions, hiring replacement teachers who meet the new requirements and may provide higher quality instruction.
Director Job Satisfaction and Management Challenges
Although there is a large quantity of research on the impact of management styles on teachers’ job satisfaction, to our knowledge school administrators’ own job satisfaction has not received the same attention. Our ecological view of early childhood centers, where the quality of teachers’ interactions with children may in part be influenced by adult interpersonal relationships in the center and broader organizational factors, necessitates that we consider the director’s commitment to and satisfaction with his or her job as well. A frustrated or burned-out administrator may be less enthusiastic or engaged in the running of a center, may provide less substantive feedback and professional development for teachers, and may be less persistent in ensuring that a program has sufficient resources to promote children’s success and teacher well-being.
To some degree, directors’ satisfaction with their jobs may be related to the challenges they face, how they prioritize responsibilities, and the decisions they make about how to handle those challenges. Despite all working under the same performance standards, even administrators in Head Start show remarkably little agreement about the relative importance of their various job responsibilities, such as maintaining financial records and providing a positive environment for teachers and students (Zinsser, Curby, & Ullrich, in press). Directors’ decision-making styles are related to the quality of adult interpersonal relationships within the center—team decision making increases staff motivation, dedication, and trust (Neugebauer, 1990).
Furthermore, administrators hold different opinions on the relative importance of various instructional techniques, curricula, and professional development (Zinsser et al., in press), which may influence teachers’ classroom practices and teacher–child relationships. This ecological view of early childhood centers, where the quality of teachers’ interactions with children may in part be influenced by organizational factors, necessitates program evaluation approaches that respect the shared experience of teachers within centers.
The Present Study
Bronfenbrenner’s bioecological systems model (Bronfebrenner & Morris, 2009) provides a natural platform for the present investigation given that it nests the individual child within concentric circles of proximal and distal influences. Attention to center-level influences on teacher quality is particularly important when implementing accountability efforts such as QRISs, which often sample teachers for observation as an indicator of center quality. Although there has been a great deal of research on classroom quality, analyses typically only nest children within teachers, but not teachers in centers. Recent evidence suggests that variations in early childhood classroom quality ratings are attributable, to some extent, to the center in which a classroom is housed (Karoly et al., 2013), but the degree to which characteristics of the center or center director (e.g., salary, management style, commitment to the field, prioritization of social and emotional learning) may account for some of the center-level variance is largely unknown. Thus, a basic, yet important line of inquiry focuses on the amount of variance in classroom observations that is attributable to the center. If the center-level variance is low, then a large proportion of teachers should be observed to produce a reliable and accurate estimate of a center’s classroom quality.
The present study seeks to answer the following research questions: (a) To what extent are ratings of classroom Emotional Support dimensions attributable to the centers? (b) Which characteristics of a center or its director best predict aspects of teachers’ emotional supportiveness? To address these goals, the present study used a large-scale, nationally representative data set to estimate the amount of center-level variance in emotional support. Subsequently, center-level predictors were added to assess the degree to which classroom emotional support could be associated with center-level phenomena.
Method
Participants
Data come from the Head Start Family and Child Experiences Survey (FACES) 2009 cohort (United States Department of Health and Human Services, Administration for Children and Families, Office of Planning, Research and Evaluation, 2013), a nationally representative sample of Head Start programs, centers, classrooms, children, and their families. In the FACES study, multistage clustered sampling was used to select programs, centers, and classrooms with probability proportional to size. The full sample included 60 programs, 2 centers per program, and up to 3 classrooms per center for a total of 486 classrooms. The analysis sample for the present study includes 120 centers and 370 preschool classrooms as these were the center-based classrooms (non-home visiting) for which classroom observation data were available. Additional demographic information for teachers can be found in Table 1. The FACES 2009 cohort included 3,349 three-and four-year-old children (49.8% female) who were 22.9% White, Non-Hispanic; 33.0% African American, Non-Hispanic; and 36.0% Hispanic/Latino.
FACES Participant Demographics.

Note. FACES = Head Start Family and Child Experiences Survey.
Measures
In-person interviews were conducted with center directors during the fall of 2009. During these interviews, directors reported on program characteristics and management practices, as well as personal workplace experiences, commitment, satisfaction, and experience. Observations of classroom quality were conducted by trained research assistants in the spring of 2010.
Classroom-level variables
Dimensions of emotional support
Observations of Emotional Support dimensions were coded using the Classroom Assessment Scoring System (CLASS Pre-K; Pianta, La Paro, & Hamre, 2008) over four contiguous observation cycles within a day. Each observation cycle consisted of a 20-min observation followed by a 10-min rating period. During each rating cycle, 10 dimensions of quality in teachers’ interactions with children were coded. Each dimension was scored on a Likert-type scale from 1 = low to 7 = high. Based on theoretical (Hamre & Pianta, 2007) and empirical (Mashburn et al., 2008) work, three domains are typically formed from 10 dimensions: Emotional Support, Classroom Organization, and Instructional Support. The present study focuses only on the dimensions that constitute classroom Emotional Support: Positive Climate, Negative Climate (reversed when aggregating), Teacher Sensitivity, and Regard for Student Perspectives. Positive Climate describes the extent to which teachers create an emotional atmosphere conducive to learning. Teachers whose interactions foster relational closeness, enthusiasm, and respect rate highly on Positive Climate. Negative Climate refers to teachers’ expressed irritability, anger, or aggression. Teacher Sensitivity captures teachers’ interactions that support individual student needs, academic or emotional. Regard for Student Perspectives describes the degree to which the teachers’ interactions with students and classroom activities place an emphasis on students’ interests, motivations, and points of view, rather than being teacher-driven (Hamre & Pianta, 2007). Prior to data collection, raters completed training and passed a reliability test, which consisted of being within 1 point of the gold standard rating 80% of the time (Moiduddin, Aikens, Tarullo, West, & Xue, 2012).
Student:Teacher ratio
During each CLASS cycle, observers recorded the total number of children in the room and the total number of adults. From this, a ratio of children to adults was averaged across the observations.
Center-level variables
Job satisfaction
Directors reported on their Job Satisfaction via 5-point anchors ranging from 1 (strongly disagree) to 5 (strongly agree) on three items, such as “I really enjoy my present job” (α = .81).
Management challenges
Directors reported their experiences with 11 possible challenges (e.g., staff turnover or not enough funds for supplies and activities) on a 3-point scale reflecting the degree to which such issues made their jobs harder (0 = not at all harder, 1 = somewhat harder, or 2 = a great deal harder; α = .78).
Prior turnover rate
The rate of prior turnover was computed by dividing the total number of teachers who left the center in the prior year and needed to be replaced by the total number of teachers employed by the center.
Steps to address turnover
FACES directors were asked to report which of seven strategies they were using to address turnover of staff (e.g., increasing teacher salaries, providing more or better training or education subsidies). Responses across all seven items were summed and final scores range from 0 (no steps to address turnover) to 7 (all strategies are being utilized).
Supportive management practices
Directors reported on efforts to support center staff using a 5-point Likert-type scale (four items, such as my program “helps teachers feel that they are part of a team,” α = .92). During the interview, directors also reported their highest level of education and their annual salary in whole numbers
Data Analysis
Analyses were conducted in a Hierarchical Linear Modeling (HLM; Raudenbush & Bryk, 2002) framework to account for the fact that the multiple teachers were nested within each center. The first step in our analysis was to run an unconditional model for each outcome (Positive Climate, Negative Climate, Teacher Sensitivity, and Regard for Student Perspectives). This answered our first research question by providing an estimate for each variable of the amount of variance at the center level, quantified as an intraclass correlation coefficient (ICC).
Next, the student–teacher ratio variable was added as a predictor at Level 1. Finally, Level 2 variables were added to the model. All variables were grand-mean centered during analysis. HLM software does not report standardized coefficients, so all effects are reported with unstandardized coefficients. Notably, classroom sampling weights were used to adjust for the probability of classroom selection and classroom-level response, such that results are representative of the entire Head Start 2009 cohort of teachers and centers (U.S. Department of Health and Human Services, Administration for Children and Families, Office of Planning, Research and Evaluation, 2013).
Results
The degree to which there was center-level variance in each of the emotional support dimensions was calculated by running unconditional models, which partition the variance in each outcome into classroom-level and center-level components. Each ICC is calculated as the proportion of center-level variance divided by the total variance. ICCs from the unconditional models are presented in Table 2. ICCs were significant for Positive Climate (ICC = .18), Teacher Sensitivity (ICC = .23), and Regard for Student Perspectives (ICC = .34), but not for Negative Climate (ICC = .05). Because the goal of the analyses was to look at the contribution of center-level predictors, and Negative Climate did not have significant center-level variance, Negative Climate was dropped from additional analyses. For the remaining dimensions, the significant ICCs indicate that a portion of the variance in classroom quality can be attributed to the centers.
Results From HLM Analyses Examining Variance in Emotional Support Dimensions Attributable to Classroom and Center-Level Predictors.
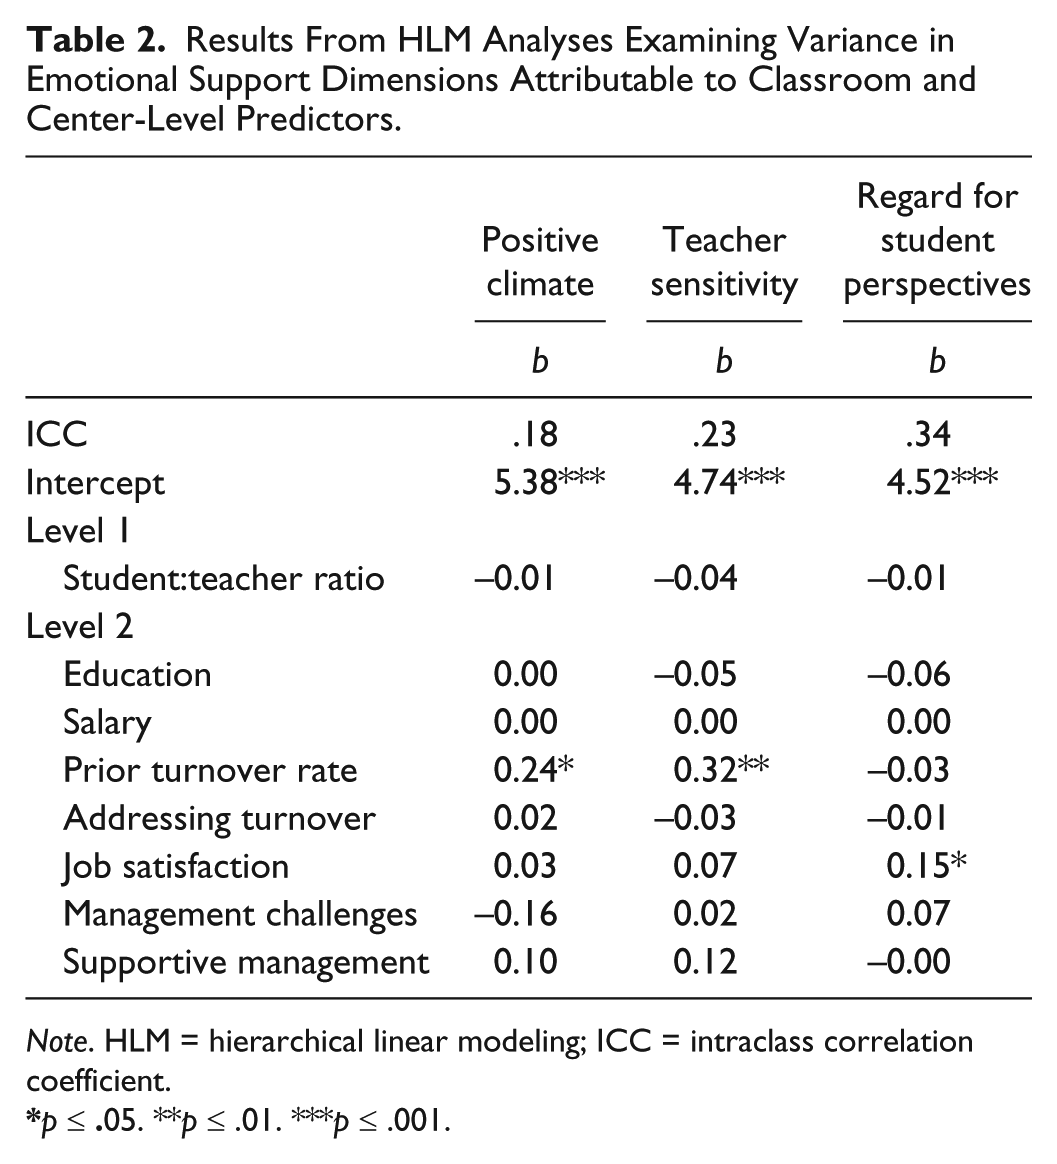
Note. HLM = hierarchical linear modeling; ICC = intraclass correlation coefficient.
p ≤ .05. **p ≤ .01. ***p ≤ .001.
Final models with all predictors are presented in Table 2. Each model provided an intercept that can be interpreted as the mean level for the outcome when all classroom and center variables had the average level (because they were centered at the grand mean). Positive Climate had an intercept of 5.38. In terms of predictors, surprisingly, Prior Turnover Rate (b = 0.24, p < .05), the only significant predictor, was positively related to Positive Climate. In other words, centers with higher turnover the previous year had higher levels of Positive Climate. For Teacher Sensitivity, the intercept was 4.74. Once again, Prior Turnover Rate was positively related to the outcome (b = 0.32, p < .01). For Regard for Student Perspectives, the intercept was 4.52. Job satisfaction was the only significant predictor (b = 0.15, p < .05).
Discussion
Three findings are notable from this study. First, portions of variance in some dimensions of emotional support can be considered to be center-level characteristics. Second, emotional support dimensions were differentially predicted by characteristics of the center and the director. Third, typical indicators of center quality do not substantially explain classroom quality in the form of emotional support.
Center-Level Variance
There was a wide range of variance attributable to the center level. Estimates ranged from an insignificant amount of variance in Negative Climate to 34% in Regard for Student Perspective. Thus, in some instances and to some extent, dimensions of emotional support can be viewed as a characteristic of the center. These dimensions are typically aggregated together; however, the amount that they have variance attributable to the center varied substantially across dimensions.
Negative Climate
Negative Climate, while an indicator of classroom quality and a predictor of child outcomes (Curby & Chavez, 2013), must be considered in a different way from the other three dimensions of emotional support. The fact that Negative Climate does not have (much) center-level variance suggests that this is primarily a characteristic of a classroom and not a center. However, this should not be taken to mean that center-level supports would not be useful. Rather, center-level support should be given individually to those teachers who struggle with Negative Climate in their classrooms. In instances of classrooms with persistent Negative Climate, interventions would likely be most effective if they focused on working with centers to support individual teachers on classroom climate, rather than applying more universal center-level interventions.
Generally, these results do not support the use of the CLASS instrument as an indicator of center quality, such as in QRIS programs, in instances when few teachers from a center are sampled as only a small proportion of teachers’ classroom practices are indicators of center quality. These results are in alignment with those of Karoly and colleagues (2013) who suggested that center-level evaluations of classroom quality will be best estimated using a larger proportion of randomly selected classrooms. This finding is especially important to communicate to center directors and state QRIS administrators. When a large proportion of classrooms are not sampled, few inferences can be made about the center, just as teachers should not be judged based on a handful of observations or children.
Predictors of Emotional Support
Turnover
Turnover rate, generally considered a negative indicator of center quality, was actually found to be a positive indicator of emotional support. We had expected to find a negative effect because turnover is likely to bring in less-experienced teachers who require additional training, and teachers who are leaving on their own will may be choosing to do so because of negative characteristics of the center. However, as was alluded to above, it is possible that turnover may also reflect purposeful counseling-out of underperforming or underqualified teachers on the part of a center director. Although these data do not allow us to explain the cause of high turnover rates, it is notable that these data were collected shortly after the most recent Head Start Reauthorization Act (2007), which raised teacher education requirements. Therefore, in this 2009 sample, turnover may have been increased relative to past cohorts as the 2011 deadline for new education minimums approached. Unfortunately, this explanation cannot be tested with prior years’ FACES data, because 2009 was the first year in which the entire CLASS measure was administered. One potential explanation for this positive association between quality and prior turnover rates is that newly hired teachers may be better educated than those they are replacing. It may also be that teachers who were hired more recently have been trained in ways that reflect more recent conceptualizations of classroom quality and are thus better able to teach in more emotionally supportive ways. Head Start Directors may also be hiring teachers differentially. Directors may be hiring teachers who are more knowledgeable about the CLASS measure because it is commonly being used to evaluate program quality. Furthermore, recent qualitative work has shown that teachers who score higher on CLASS Emotional Support actually conceptualize their role in emotion education differently from lower scoring peers (Zinsser, Shewark, Denham, & Curby, 2014). Either way, directors may be aware of these differences when interviewing prospective new hires or using such differences to make hiring decisions.
Director job satisfaction
The other significant predictor of center variance in emotional support was center director job satisfaction. Directors who enjoy their jobs, feel they are making a difference, and are committed to early childhood education tended to have teachers who scored higher on Regard for Student Perspectives. Regard for Student Perspectives includes the degree to which teachers are over-controlling (low end) or give students autonomy and responsibility (high end). It may be that teachers who give students autonomy are easier to work with and are contributing to a more positive workplace environment. Perhaps this is easier to see in the opposite: Teachers who are over-controlling may be very particular in how they feel their classroom should operate and may be less accepting of director input. Thus, a center director’s feelings of efficacy could be diminished, resulting in lower job satisfaction. We believe that this association is important to communicate to center directors as well, as it underscores the interconnected ecology of preschool centers. Directors’ own workplace experiences are indirectly related to children’s experiences in the classrooms through their teachers. Thus, directors who wish to positively affect children may benefit from some degree of self-reflection.
Seeking additional predictors of center-level variance
Except for the predictors discussed above, the majority of hypothesized predictors of center-level variance were not predictive. Many structural characteristics of centers that are heavily regulated and for which there are resources available to directors (e.g., education level, management challenges such as insufficient technical assistance, and supportive management practices such as providing orientation to new teachers) were not related to emotional support dimensions. For example, student:teacher ratio, which conceptually should be related to emotional support, was not related in these data. However, unsurprisingly, the regulations around ratios result in little variance, and therefore any effects of these ratios has already been felt throughout the programs. We suspect a similar reason was at play with center director education levels, where all directors had at least some college and the majority had a bachelor’s degree or greater. Thus, any effects of education would have to be operating within the higher end of education. Conversely, there was a great deal of variance in center director salaries but salary was not a significant predictor in any of our models. We expect that this lack of association is due in part to the fact that Head Start grantees determine pay scales based on local factors such as cost of living. Although within a grantee’s jurisdiction more effective center directors may be paid more, when examining data nationally, we cannot assume that all highly paid directors in urban areas with high costs of living are more effective managers than their rural peers
Another reason for the lack of associations may be that the characteristics captured in these scales of challenges and supportive techniques are not telling the whole story. There have been calls for research to identify what effective center director management practices look like in the early childhood field (Muijs, Aubrey, Harris, & Briggs, 2004). Still, the majority of research on early childhood leadership has focused on more tangible aspects of program administration, including compliance with health, safety, legislative, and contractual requirements; coordinating family and social services; and financial management (e.g., Osgood & Stone, 2002). Even the recently formed Head Start National Center on Program Management and Fiscal Operations is primarily focused on structural components such as “fiscal planning . . . risk management, governance, data collection and analysis, and budgeting and cost allocation” (Education Development Center, 2014). Future research utilizing less structurally focused measures will be necessary to identified which characteristics of centers and/or center directors account for shared variance in classroom emotional support quality.
Although broader, the well-known work conducted by Bloom and colleagues (Bloom, 2010; Bloom & Sheerer, 1992; Talan & Bloom, 2011) also takes a structural approach. In response to decades of research into early childhood teacher turnover, job satisfaction, and burnout, Bloom worked to develop assessment tools focused on organizational climate and work attitudes (Bloom, 2010) to help program administrators identify organizational threats to teacher retention and quality of care. The Early Childhood Job Satisfaction Survey captures teachers’ experiences of workplace satisfaction and frustration as well as experiences of support and professional growth (Bloom, 2010). Although it is more emotionally focused, this instrument has not been extensively used to examine directors’ experiences or the associations among directors, teachers and emotionally supportive classroom practices.
In predicting children’s emotional experiences in preschool, measures that tap into emotional climate and emotionally relevant management practices may be most beneficial for identifying the role of emotions in early childhood education and connecting workplace climate with teacher and child social and emotional competencies (Zinsser, 2013). When present, a culture and climate of support within a Head Start center can have positive impacts on teachers’ job satisfaction and commitment (McGinty et al., 2008) and the quality of children’s learning environments (Lower & Cassidy, 2007).
Limitations and Future Directions
It is notable that a majority of the predictors included in these models were not able to significantly explain the center-level variance in Emotional Support. This could be due to limitations in measurement. The variables selected and included in these models are somewhat indirectly related to the measured outcomes. It is possible that there are other center-level indicators of center directors contributing to emotional support, such as the employment of a mental health consultant or adoption of a social-emotional learning curriculum, which could be included in future analyses. Future work should also consider role of assistant directors in a center.
Beyond such structural components, there are few measures that capture non-structural center director elements which may influence classroom emotional support quality. Measures that assess the process of a director constructing an emotionally supportive climate and culture may better elucidate the connections between teachers’ workplace experiences and their use of supportive classroom practices. Future work to develop such measures would benefit both research and practice if paired with professional development.
Although generalizable to Head Start in 2009, we do not know the degree to which features of Head Start make this study’s findings unique to that context, nor do we know how changing policies have continued to reshape Head Starts and thereby change this study’s findings. Future work will need to continue to explore the stability of these findings over time and in different early childhood contexts.
Conclusion
Initiatives such as the Race To The Top Early Learning Challenge encourage the development of a high-quality early childhood workforce. Thus research into the potential pathways of influence on teachers and students is increasingly necessary. In particular, it is important to know how center-level contextual factors lay the foundation for supportive teacher–child interactions. Findings indicate that center-level characteristics explain meaningful portions of variance in each dimension of emotional support except Negative Climate but that these dimensions were differentially predicted by characteristics of the center and the director, including director job satisfaction. Based on these results we now know that a substantial proportion of teachers’ classroom behaviors can be explained by factors at the center level. At the same time, this study draws into question the trend of QRIS programs utilizing aggregate observations of a small sample of teachers to represent center quality, because only a third of teachers’ classroom practices are representative of center-level quality.
Footnotes
Declaration of Conflicting Interests
The author(s) declared no potential conflicts of interest with respect to the research, authorship, and/or publication of this article.
Funding
The author(s) disclosed receipt of the following financial support for the research and/or authorship of this article: The authors are grateful for an award from the Inter-university Consortium for Political and Social Research for training in the FACES datasets. The authors also wish to acknowledge the Research Open Access Publishing (ROAAP) Fund of the University of Illinois at Chicago for financial support toward the open access publishing fee for this article.