
Abstract
This study examined the concurrent validity of assessments based on a prescribed set of preparation standards of teacher candidate competency. Participants were 94 candidates from a small, comprehensive liberal arts university in the northwest. Teacher candidate performance measures included a Summary Student Teaching Evaluation, an evaluation of a Teacher Work Sample (TWS), learning gain scores from P-12 students during a unit of instruction completed as part of the TWS, and State licensure content area tests. Measures of student teaching showed strong correlations internally and moderate correlations with the TWS evaluation. Measures of the TWS showed moderate correlations internally. Learning gain scores and content area test scores were weakly correlated with all other measures of candidate performance. The absence of moderate or strong correlations among different assessments suggests they are measuring different constructs supporting the use of a comprehensive set of standards-based assessments to determine candidates’ readiness for licensure.
Teacher preparation programs are caught between two views of how best to evaluate candidate readiness for licensure. One view promotes using a variety of measures to examine multiple aspects of a candidate’s progress toward becoming a teacher, and the other suggests that candidate competence can be demonstrated in a single assessment (Wineburg, 2006). Added to the debate is the requirement that whatever assessments are used should be based on teacher standards that are developed external to the preparation program by accreditation and licensure agencies (Council for the Accreditation of Educator Preparation [CAEP], 2013). Our program designed standards-based assessments of candidate competency, and we needed to establish if these assessments really were measuring the different constructs outlined in the standards, or if they were multiple assessments of the same construct. We believe multiple assessments are needed to measure the full array of constructs and the complexities of what makes a highly qualified teacher. Teacher preparation programs are being criticized for not preparing new teachers adequately (e.g., Greenberg, Walsh, & McKee, 2014). This criticism is evidence that researchers and policy makers need a clearer understanding of how to evaluate candidate readiness. Evidence gained in this study, using multiple assessments based on the standards that accrediting agencies say are necessary to develop highly qualified teachers, can assist programs nationally on how to know their candidates are prepared for licensure.
The purpose of this study is to examine the concurrent validity of an Educational Preparation Provider’s assessments of teacher candidate competency. Specifically, are measures of candidate preparedness strongly correlated? Strong correlations would indicate that measures are assessing similar constructs, a measure of concurrent validity. Weaker correlations would indicate that measures are addressing differing constructs, possibly supporting the need for multiple assessments to measure candidate competence more completely. This question is relevant in an environment of conflicting opinions about how teacher candidate competency should be assessed.
Single Measures of Candidate Competency
Candidate competency, especially in regard to the individual’s capacity to affect P-12 student learning, is a central focus of not only national accreditation standards such as those of National Council for the Accreditation of Teacher Education (NCATE) and CAEP but also of all of the Specialized Professional Associations (Darling-Hammond, 2010; NCATE, 2008a). Although there are concerns about the accuracy or efficacy of using measures of student learning to assess teacher effectiveness (Amrein-Beardsley, 2008), Value Added Modeling (VAM) has become an approach mandated in states receiving federal Race to the Top grants (Youngs, 2013). VAM is a system of comparing actual academic growth with predicted growth for each student in a teacher’s classroom using standardized assessments. McCaffrey, Lockwood, Koretz, Louis, and Hamilton (2004) described VAM strategies with a number of different algorithms that assess student progress. They require data connected to longitudinal student outcomes, and the “models must account for and use the likely positive correlation among multiple measures on the same student” (McCaffrey et al., 2004, p. 68). Fallon (2006) not only outlined the need for VAM but also described cautions for its use. Of particular concern is whether standardized assessments used in VAM are aligned with curriculum taught by the evaluated teachers and how VAM accounts for the positive or negative impact of previous teachers a student may have had.
VAM is also problematic for teacher preparation. Candidates are in schools with P-12 students for relatively short periods of time while they are developing the necessary skills to become effective teachers. They may student teach full-time for 6 weeks or less versus a full academic year that standardized testing assumes. Both time and the candidates’ developmental progress make the use of VAM for assessment of teacher candidates inappropriate.
Most states require passing scores on initial licensure standardized content knowledge exams prior to licensure. Most typical of these tests are the PRAXIS II series developed by the Educational Testing Service (https://www.ets.org/praxis/about/praxisii) or Pearson Publishing’s National Evaluation Series tests (http://www.nestest.com/). The selection of required licensure tests and the establishment of cut scores for passing are within the purview of each state department of education. The content of licensure exams depends on whether a candidate plans to teach in the elementary grades or in high school. If a candidate plans to teach in high school, one of the tests he or she would need to pass is a subject-specific exam, such as in chemistry. If a candidate chooses to teach in the younger grades, one of the exams he or she would need to pass is something like the Oregon Educator Licensure Assessments (ORELA; Subtests I and II) that are matched to the national standards and are designed to determine if a candidate has the knowledge and competency to be designated a highly qualified teacher (No Child Left Behind Act, 2001).
Evidence of the predictive validity of standardized content area tests on teacher efficacy is mixed and mostly weak. Ayers (1988), Carroll and Waggoner (2011), and D’Agostino and Powers (2009) all found weak correlations between tests scores and performance assessments completed while candidates were still in their teacher preparation programs. Darling-Hammond (2009) and Goe, Bell, and Little (2008) reviewed studies examining the relationship of standardized content area tests and in-service teaching and pointed to some evidence of stronger correlations in secondary math, less evidence of an association in secondary science, and little or no evidence of a relationship in other secondary areas or in elementary teaching. Darling-Hammond (2009) and Carroll and Waggoner (2011) discussed the difficulty of this analysis in that data are only used from candidates or teachers who have met minimum competency (cut scores) on these exams. Obviously, individuals who did not meet the minimum cut score were not admitted to teacher education programs, so there are no data on the relationship of low content area test scores and P-12 performance assessments.
For most educator preparation programs, measuring teacher candidate proficiency is a process of developing assessments based on the state and national standards within which they work. If the standards are well written, and if assessments designed around those standards are valid, reliable, and are appropriately applied, evidence should be available that shows candidate progress toward the standards on which the assessments are based. “Perhaps ideally from a measurement point of view, there would be commonly used evaluations that provide measures of absolute levels of subject knowledge and teaching accomplishment for teacher candidates” (Wise & Leibbrand, 2001, p. 250). Toward this goal of definitive single assessments of candidate readiness for licensure, the Education Teacher Performance Assessment (Pearson Publishing, 2013) and similar assessments (Pecheone & Chung, 2006) are gaining wide acceptance across the United States. In general, these assessments are based on the Interstate Teacher Assessment Support Consortium (InTASC) standards (Council of Chief State School Officers, 2011) and are used to evaluate performance-based artifacts that teacher candidates produce during clinical experiences.
Multiple Measures of Candidate Competency
Schools of education focus on the characteristics of competent teachers described in national (CAEP, 2013) and state (e.g., Oregon Administrative Rules, 2012b) standards when designing assessments of candidate abilities. For instance, CAEP Standard 1 addresses content and pedagogical knowledge, requiring that candidates develop a deep understanding of critical concepts in their discipline. Standard 2 requires clinical partnerships and practice that require candidates to “demonstrate a positive impact on all P-12 students’ learning and development” (CAEP, 2013, p. 14). CAEP reviews the quality of an educator preparation program’s assessments to determine if they are valid and reliable evidence of a program’s impact.
However, it has not been carefully evaluated how well educator preparation programs have matched their assessments to CAEP or individual states’ standards. Wise and Leibbrand (2001), discussing the NCATE (2008b) standards, call for a careful alignment of standards, performance-based assessments, and curriculum in educator preparation programs to insure teacher candidates are ready for licensure. It has been emphasized more recently that candidates need to demonstrate they are proficient in assessing whether all children in their classrooms are learning. This includes children with special needs (e.g., learning disability), English Language Learners, all ethnicities, and all socioeconomic levels. As D. Gollnick said during a CAEP conference presentation (March 26, 2014), “All means all.”
Kane and Staiger (2012), in a report funded by the Gates Foundation, suggested that observation measures used in conjunction with standardized test scores increase the ability to predict teachers’ impact on student learning. In their study, 7,491 videos from 1,333 teacher classrooms were each scored by at least 3 trained raters. The authors’ interests were to examine the efficacy of five different teacher evaluation instruments to predict student learning gains. They found all observation instruments were positively associated with student learning gains. In addition, they demonstrated that other measures of teacher competency, such as years of teaching and student evaluations, increased the ability to predict teacher impact on student learning.
Stacy and Guarino (2012) acknowledged the important first steps represented by the observational study funded by the Gates Foundation, and they suggested that the observations may be identifying different characteristics of teacher performance that were not measured in standardized assessment schemes. Even though evidence existed that observational ratings could serve as predictors of teacher performance, development of appropriate measures was an ongoing challenge. Darling-Hammond (2009) outlined essential teacher abilities and pointed to the widely used InTASC standards (Council of Chief State School Officers, 2011) as potential sources for evaluation of new teacher abilities. Indeed, many programs already use InTASC as the foundation for teacher assessment (Carroll & Waggoner, 2010).
Standards-Based Assessments
InTASC and state standards are used in conjunction with a similar set of standards defined by the NCATE. These are encapsulated in the 2008 Unit Standard 1 (NCATE, 2008b). The alignment of the NCATE and InTASC standards was demonstrated by Kraft (2001). NCATE summarized essential teacher competencies in five areas: content knowledge, pedagogical content knowledge, pedagogical knowledge, student learning, and professional dispositions. The CAEP (2013) described similar teacher competencies in their newly established standards. NCATE-accredited institutions across the country have invested considerable energy into developing valid and reliable measures of candidate competencies in these five areas. Trained NCATE Board of Examiner teams have served as the common element in evaluating the degree to which institutions have addressed issues of validity and reliability of these measures. Discussion of the interrelationship of the standard elements was noticeably absent from literature around either the InTASC or NCATE standards, however.
Concurrent Validity of Predictor Variables
A number of authors have attempted to identify variables that are associated with competent teachers in an effort to know possible predictor variables useful to educator preparation programs. The necessity for identifying predictor variables is reinforced by the 2013 CAEP Standard 3.3 that states “The provider selects criteria, describes the measures used and evidence of the reliability and validity of those measures, and reports data that show how the academic and non-academic factors predict candidate performance in the program and effective teaching” (CAEP, 2013). Much before CAEP standards, Ayers (1988) examined relationships between scores on the National Teacher Examination (NTE) and a variety of other variables including other standardized assessments, grade point average (GPA), and classroom observation evaluations. Although standardized assessments and GPA were moderately correlated, other variables were not, suggesting the complexity of identifying measures associated with a recognized measure of candidate competence in educator preparation.
Looking more closely at teacher performance tests as a possible key predictor of candidate competence, D’Agostino and Powers (2009) found preservice tests were not a good predictor of teaching performance, but preservice observations were a good predictor.
Nweke and Hall (1999) found that redesigning assessments for newer standard sets did not necessarily increase identification efficacy. There were no differences in the ability of the tests to identify qualified teachers.
The program outcome of candidate completion rate is another CAEP (2014) measure of whether a program is preparing candidates properly to be qualified teachers. Caskey, Peterson, and Temple (2001) examined the concurrent validity of six program admission measures to determine their ability to predict successful program completion. They found considerable overlap in the variance that the measures demonstrated. This led the authors to suggest simplifying the admission process.
However, to determine which admission measures can be eliminated in this simplification process, it is important to know what variables are connected to course grades and ultimately program completion. Naizer (1997) used discriminant analysis to test four variables as predictors of course grades, which were based on scores on a performance portfolio and a final examination. The author determined that a mix of weak and moderate correlations suggests that the variables in the study are measuring different constructs.
Consistently, research has been unable to demonstrate exactly what variable or combination of variables may best capture the essence of a candidate’s readiness for licensure. Standards-based assessments often require ratings by multiple observers and rely on candidate performance indicators from multiple sources over time. A more careful examination of the efficacy of a program’s assessment system and of the importance of each of the elements in that system will assist in determining a candidate’s readiness for licensure. Evidence of strong relationships among assessment elements (concurrent validity) suggests that the elements are measuring similar constructs (Cohen & Cohen, 1983).
The purpose of this study is to examine the concurrent validity of an educational preparation provider’s assessments of teacher candidate competency. As the assessments in our programs have been designed to match the prescribed InTASC and NCATE national standards for teacher preparation, our approach to examining the relationship among assessments is to determine if the multiple assessments we use measure different constructs, or if there is a more global construct of candidate preparedness that each of these assessments similarly addresses.
Method
Participants
Data were gathered on 94 student teachers in a small, comprehensive liberal arts institution in the northwest. The sample included 38 candidates completing an undergraduate teacher preparation program and 56 Master of Arts in Teaching (MAT) candidates (Table 1). All candidates were Caucasian except for two Asian candidates—one undergraduate and one MAT.
Sample Demographics.

For each teacher candidate, data from four types of assessments were analyzed: a Summary Student Teaching Evaluation (STE), a Work Sample Evaluation (WSE), P-12 student learning gains, and scores from State licensure exams.
Summary STE
The State of Oregon is explicit about the knowledge, skills, and professional dispositions that candidates must demonstrate prior to licensure (Oregon Administrative Rules, 2012b). These standards are aligned with both the InTASC and NCATE standards. The five areas listed in the Oregon Teacher Preparation Standards are planning for instruction, establishing classroom climate, engaging students in learning activities, evaluating student progress, and exhibiting professional behaviors. The Summary STE measures candidate competencies in these five areas. Faculty content experts in the areas listed designed the instrument. Questions were formulated to match the State standards and were tested with candidates. Definitions for each level of the rating scale were developed in accordance with Danielson’s (2007) teacher evaluation work. University supervisors participated in a group training each fall prior to the beginning of the semester to establish instrument rating guidelines. The STE is completed 4 times for each candidate: at two midterms and at the end of their two student teaching assignments. Often, supervisors use the midterm evaluations to highlight areas for improvement. In addition, the second end-of-experience evaluation may reflect the supervisor’s attempt to evaluate the candidate in the most positive light—a halo effect. For these reasons, we used the student teaching experience evaluation from the end of the first student teaching experience as the most accurate description of the knowledge, skills, and professional dispositions of the candidate. After a semester of observation of the teacher candidate, a university supervisor and cooperating teacher, in discussion with the candidate, rated the teacher candidate on 31 elements in the five categories of the Oregon Teacher Preparation Standards. The university supervisor and mentor teacher each observed a candidate a minimum of 10 times for approximately 50 min during both student teaching experiences. Observational ratings were on a 4-point ordinal scale anchored by novice candidate and highly accomplished candidate.
This evaluation protocol had been used productively for a number of years, and it had provided useful information for candidate evaluations and accreditation reviews. Regardless, we had never tested to see if the protocol actually was giving us the data for which it was developed. For this sample, we conducted a factor analysis (principal components/varimax rotation) on the responses to the evaluation to see if data reduction would identify the same subcategories that are in the standards. Four factors appeared (eigenvalues greater than 1) representing 80.17% of the variance in the model (Table 2). The largest single factor, (62.67% of the variance), included items from all five sections of the standards: planning for instruction, establishing classroom climate, engaging students in learning activities, evaluating student progress, and exhibiting professional behaviors. We renamed this factor (1) instructional process.
Summary of Items and Factor Loadings for Varimax Rotation of the Summary Student Teaching Evaluation (N = 95).
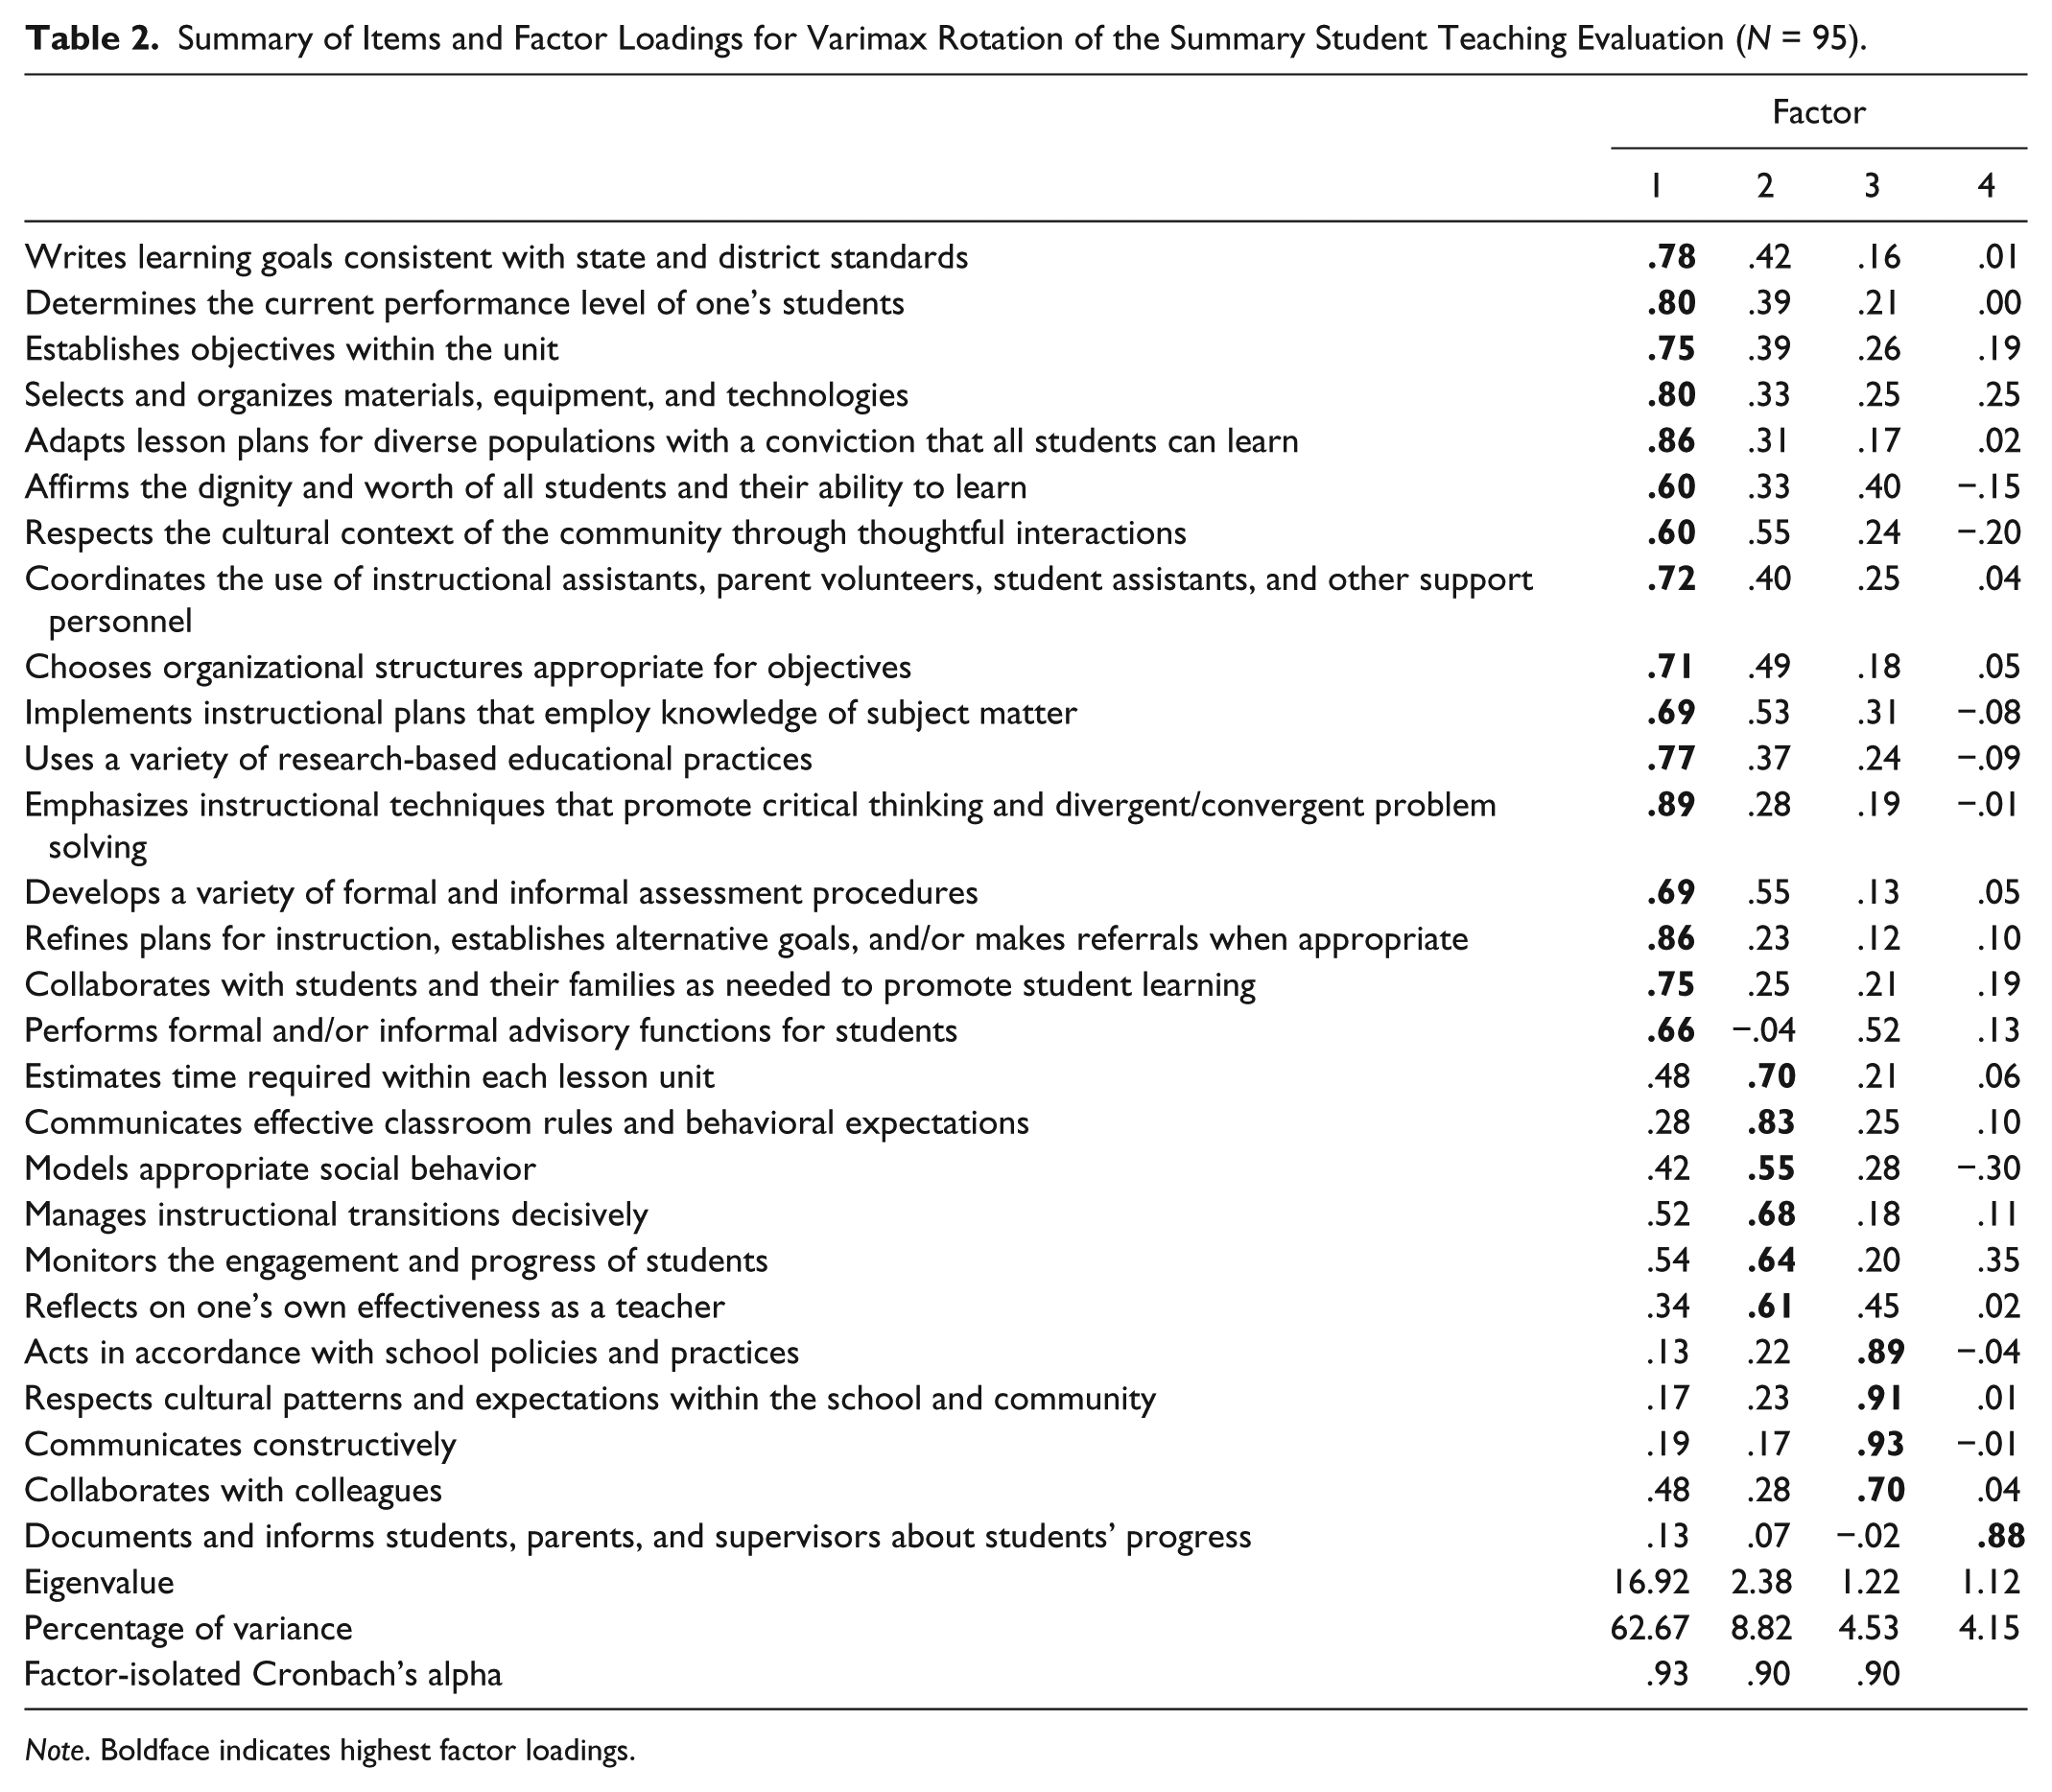
Note. Boldface indicates highest factor loadings.
The other three factors that represented the remaining 18% of the variance in the model were (2) managing the instructional process, (3) communication (included items from the original category of professional dispositions), and (4) communicating with parents. We had some concerns about this last factor because of the difficulty supervisors had in observing and evaluating this characteristic firsthand.
Internal consistency of the items identified in each of the first three factors was evaluated using Cronbach’s alpha. Results ranged from .93 to .90 indicating excellent reliability (Kline, 2013). Averaged scores from the four factors were used in the comparative analysis of multiple measures.
WSE
The Teacher Work Sample (TWS) is an artifact that each candidate produced, which represented a unit of instruction during student teaching. State statutes list the specific requirements that candidates must demonstrate in the TWS (Oregon Administrative Rules, 2012a). Candidates prepare and teach a 10-lesson unit of instruction. They design an assessment plan including pretesting, formative assessment, and summative assessment. They assess student progress and report results to students and parents. The candidate is prompted to reflect on problems and successes throughout the process, focusing particularly on differentiating instruction for the learning needs of each student. Candidates accumulate relevant documents (lesson plans, assessment, and reflections) into a physical artifact that is used as part of the basis for analysis of candidate readiness for licensure.
Because the TWS is one piece of evidence that candidates must produce to demonstrate readiness for licensure, the required elements of the WSE map onto the State-outlined areas of knowledge and skills listed above as part of the Summary STE. A rubric was designed by faculty content experts to match the elements of the State standards for the WSE. University supervisors participated in a group training each fall prior to the beginning of the semester to establish rating guidelines for interrater reliability estimates. The university supervisor completed the evaluation of the WSE at the end of each candidate’s clinical experience.
Again, although we had used the WSE rubric for some years, we had not conducted an analysis to determine the degree to which the instrument reflected the state standards around which it was designed. The subcategories within the standards and the rubric were classroom diversity, unit goals, instructional planning, assessment of student learning, reflection, and communication. A factor analysis (principal components/varimax rotation) was conducted on the responses to see if data reduction would identify the same subcategories as appeared in the standards around which the form was developed. Seven factors appeared, (eigenvalues greater than 1), representing 77.99% of the variance in the model (Table 3). We named the first five factors (1) individual learning needs, (2) use of formative assessment, (3) differentiation, (4) unit organization, and (5) unit goals. Cronbach’s alpha was used to assess the internal consistency of the items in each factor. The results for Factors 1 through 5 ranged from .83 to .62, indicating good and acceptable internal consistency (Kline, 2013).
Summary of Items and Factor Loadings for Varimax Rotation of the Teacher Work Sample Evaluation (N = 95).

Note. IEP = Individualized Education Plan; ELL = English language learner. Boldface indicates highest factor loadings.
Because Factors 6 and 7 consisted of two items each, a Pearson’s r was used to estimate the consistency of the factor items. In both cases, resulting values fell below acceptable levels for reliable assessments. Each of these factors contained items that were rated inconsistently by university supervisors. Factor 6 included use of technology and other resources. Raters often left this blank if candidates had not used technology in their unit of instruction. Similarly, Factor 7 included plan for reporting learning gains to students and parents. Again, raters often left this item blank if candidates had not had an opportunity to discuss assessment results with parents. They were removed from the analysis because of the inconsistent behavior of these two factors.
Considerable overlap appeared among the standards-based categories and the remaining identified factors from the assessment, suggesting validity of the instrument. Averaged scores from the five factors were used in the comparative analysis of multiple measures.
Student Learning Gains
Within the TWS, candidates must present “Data on learning gains resulting from instruction, analyzed for each student, and summarized in relation to students’ level of knowledge prior to instruction” (Oregon Administrative Rules, 2012a, section D).
Candidates take an assessment course as part of their preparation program. One of the assessment strategies presented in the course is the design and use of a matched pre- and post assessment. In the TWS, candidates use matched pre- and post assessments in the P-12 unit of instruction to measure learning gains based on their instruction. Although each unit of instruction is tied to state curriculum standards, the assessments used by candidates vary widely. These may be multiple-choice exams, performance rubrics, or even standard assessments of student skill. To standardize the difference in scores for pre- and post assessments among the various assessments used, we translated pre- and post scores into percent-correct scores and computed percent learning gain (Waggoner, Carroll, Merk, & Weitzel, 2014). The strength of the using of this and other strategies for including P-12 student learning data as part of program evaluation have been supported by previous work around the TWS (Denner, Norman, Salzman, Pankratz, & Evans, 2004; Stobaugh, Tassell, & Norman, 2010).
On a preformatted Excel spreadsheet, candidates reported to the School of Education assessment scores for each student in their classroom and the total score possible on the assessment. Percentage-correct scores and percent learning gains were computed for each student in the candidate’s classroom. In addition, an average learning gain was computed for each candidate’s classroom that was used in the comparative analysis of multiple measures.
State Licensure Exams
All candidates in the sample were required to pass general content knowledge tests prior to entering student teaching. The tests were the ORELA Subtests I and II, which were designed and administered by Pearson Education (http://www.orela.nesinc.com/). Subtest I covered language arts, social science, and the arts. Subtest II covered mathematics, science, health, and physical education.
Analysis
The data set for the study included the average STE score in each of the four factors of the Summary STE, the average WSE score in each of the five factors, the average learning gain score for the students in the candidate’s classroom, and the test scores for both the ORELA I and II subtests for each candidate.
A test of normality was completed for each variable. Most variables demonstrated negative skew between −.10 and −1.0, except for learning gains that were positively skewed at .22. The more notable exception was the STE measure of communicating with parents that was strongly negatively skewed (−1.51). Although this measure was problematic for a number of reasons that are reviewed in the discussion, we retained this factor because it represented a substantial portion of the variance in the model and demonstrated an eigenvalue above 1 (Table 2). State licensure exams are standardized tests, and all candidates in this sample previously had passed the tests. In addition, our admissions process seeks to admit those with the highest passing scores, thus negatively skewing the results. Because of the small to moderate inconsistency in the normality of the distributions, analysis was not redesigned to accommodate nonnormal distributions.
Concurrent validity is a measure of the extent to which the results of instruments used at the same time, and purported to examine similar constructs, agree (Cohen & Cohen, 1983). A Spearman’s rho was calculated for the comparisons of each of the 12 variables with all other variables. The additional measure of concurrent validity in this study is being used to examine the degree to which these standards-based assessments measure the same constructs. Weak correlations (r< .30) were not considered in this study as sufficient evidence to demonstrate concurrent validity.
Results
Scores from the Summary STEs, WSEs, P-12 student learning gains, and state licensure tests were compared for 94 teacher candidates (Table 4).
Correlations of STE, WSE, ORELA Content Area Tests, and Learning Gains Assessments.

Note. STE = Student Teaching Evaluation; WSE = Work Sample Evaluation; ORELA = Oregon Educator Licensure Assessments.
p< .05.
Learning Gains and Content Assessments
Only weak correlations (−.20 ≤r≤ .23; p> .05) appeared between P-12 student learning gains and any other element in the analysis. A moderate correlation of r = .56 (p< .001) appeared between the two ORELA subtests, but only weak correlations (−.08 ≤r≤ .22; p> .05) appeared between either ORELA subtest and any other element in the analysis.
STE
All remaining measured associations between possible pairs of assessment elements were positive. The STE factor of communicating with parents showed only weak correlations with all other assessments.
All other STE factors were strongly correlated with other Summary STE factors at r≥ .74 (p< .001). One exceptionally strong correlation (r = .92; p< .001) appeared between the factors of instructional process and managing the instructional process in the STE.
WSE
WSE factors of learning needs and formative assessment were strongly correlated with other WSE factors at r≥ .70 (p< .001). All other correlations of WSE factors were moderate.
When examining correlations among the factors of the WSE and the STE, most of the correlations were moderate, .35 ≤r≤ .57 (p< .02), with the exception of STE factor of communication.
Discussion
The purpose of this study was to examine the concurrent validity of assessments of teacher candidate competency, given that there are conflicting opinions about how teacher candidate competency should be assessed (Darling-Hammond, 2010; Wineburg, 2006). The results show that measures of student learning in candidate classrooms (learning gains) and the standardized test scores of candidate content knowledge (ORELA Subtests I and II) are not demonstrating concurrent validity with the Summary STE and the WSE and are unlikely, therefore, to be measuring the same constructs. The two sets of measures that university supervisors used to rate candidate performance, the Summary STE and the WSE, are moderately or strongly correlated, implying some possible similarities in the constructs they are measuring. Last, each of the university supervisor set of measures internally demonstrated moderate or strong associations among subcategories, suggesting that each of the subcategories is addressing similar constructs. The exceptionally strong correlation of instructional process and managing the instructional process in the Summary STE and the relative strong correlations among all three factors of the Summary STE (omitting communicating with parents) implies that there may be little differentiation in these factors, even though they represented a substantial portion of the variance in the initial factor analysis of the instrument results.
Student Learning Gains
Assessment of P-12 student learning is a critical part of a candidate’s work in clinical experience, and candidate assessment of student learning is articulated in the State and national standards (NCATE, 2008b; Oregon Administrative Rules, 2012b). In this study, P-12 learning gain scores did not demonstrate statistically significant relationships with any other variable. These scores are generated from P-12 students’ performance on classroom content assessments and not from a proficiency rating of a skill demonstrated directly by a candidate and rated by a university supervisor. Candidates’ assessment courses, and the coaching they receive during clinical experiences, are designed to help them become strong in assessment practices, so that they design valid and reliable assessments. In addition, we ask candidates to reflect on the meaning of their P-12 students’ assessment scores, their ability to differentiate instruction for all students, and the efficacy of their assessment strategies (Stobaugh et al., 2010). These skills are evaluated in both the WSE and the Summary STE. The P-12 learning gain scores are important in the candidates’ process of learning how to make data-informed decisions while teaching. However, it should be acknowledged that candidates’ ability to acquire assessment skills is developed over time, and the P-12 learning gain scores represent only one component of the work that teacher candidates do in clinical experiences as they develop into professional educators. Programmatically, we monitor P-12 gain scores to determine if teacher candidates, as a group, are demonstrating they are teaching to the needs of each student in their classrooms. However, P-12 gain scores are not a measure of predictive validity of whether a candidate will be a good teacher. They should not be used as high-stakes, make-it-or-break-it determinants separate from other evaluations of candidate competencies, because candidates may have difficulty achieving learning gains for all students as they learn to differentiate instruction, construct valid and reliable assessments, hone the use of instructional strategies, and improve their classroom management skills. This is reiterated in the State standards, in that candidates must demonstrate the measurement of student learning gains, but there is no suggestion in the standards what levels of student learning gains should be achieved, even though we know that as a group, learning gains in candidate classrooms mirror the types of gains seen in early career teacher classrooms (Waggoner et al., 2014).
Content Assessments
The issue of standardized assessment of candidate content knowledge poses a different set of concerns. This study shows, parallel to Ayers (1988) and D’Agostino and Powers (2009), that the variance in ORELA Subtests I and II standardized scores is not related to ratings of the observation of candidate knowledge, skills, and professional dispositions in the classroom. As standardized test scores are not correlated with other valid measures of candidate performance in the classroom, those scores are either representing a unique, standards-based construct for teacher preparation (i.e., level of content knowledge), or they are not predictive of candidate readiness for licensure once the candidate meets the minimum passing score for the test. Every member of the sample of candidates in this study had passed State-required tests, thus skewing the distribution toward a more highly qualified set of candidates. We believe more data are needed to determine whether meeting the minimum passing score is sufficient to indicate candidate content area knowledge and whether differences in scores beyond this passing cut point provide any useful additional data for evaluating candidates. These findings are consistent with other studies (Carroll & Waggoner, 2011; Darling-Hammond, 2009; Goe et al., 2008).
STE
STEs are completed by university supervisors who observe candidates teach lessons prior to the completion of the summary evaluation. Supervisors are not only making judgments about candidates’ technical skill but also about the degree to which candidates are making reasonable progress toward licensure. Regardless of the rater training that we conduct, it is difficult for supervisors to separate these two variables in their evaluations. Candidates doing well in one area tend to be perceived as doing well in all areas. The reverse is also true. Confirmatory bias is common (Barrett, 1986). For that reason, we were not surprised to see the strong correlations among the factors of the STE and, more explicitly, the numbers of items that loaded onto the instructional process factor.
Regardless, the instrument was developed to measure elements of a qualified teacher based on state standards (Oregon Administrative Rules, 2012b). More to the point in this study, what the STE measured is not related to what was measured by content knowledge tests or candidates’ assessment of student learning gains.
There were weak correlations (r< .25) for the factor of communicating with parents in both the Summary Student Evaluation and the WSE. As it is more difficult for university supervisors to observe a candidate communicating with parents directly during the relatively short time of student teaching, this could be a factor in how the item was rated. In addition, during interrater reliability trainings, we discovered that the operational definition of communicating with parents varied among university supervisors, thus requiring revision of the item in the instrument affecting future iterations of data collection. University supervisors also reported that some candidates had limited opportunities to communicate with parents during this rating period because candidates were taking university classes half-time. Communicating with families is important for P-12 students’ education, and it is a component of professional standards. Thus, this factor needs further exploration.
WSE
The WSE appears to provide additional assessment data not captured in the Summary STE (Denner, Norman, Salzman, & Pankratz, 2003). Although the assessment instrument is derived from similar standards that were used for the Summary STE, the correlations do not suggest the WSE is measuring precisely the same characteristics. The STE focuses on observation of candidate performance, while the WSE rates the quality of an artifact that candidates produce to represent a unit of instruction that they implement. Apparent differences in the constructs being evaluated suggests the WSE needs to be included in our assessment practices to provide a well-rounded assessment of candidate competence, regardless of the similarity of the standards from which both assessments were derived.
Cautions
It is important to note that exploratory studies examining the correlations of a high number of variables are suspect (Warner, 2013). Our approach is to be conservative in examining the outcomes of this study. All of the instruments used in this study had demonstrated internal reliability, and we did not compare data from different samples. Scatter plots of each correlation were examined for nonlinearity and for excessive outliers. Finally, our concern over the potential for Type I errors (Keselman, Cribbie, & Holland, 2002) in the identification of variable relationships was mollified by the observation that moderate and strong correlations that appeared were supported by literature around the nature of integrated practices in teacher candidate preparation (Darling-Hammond, 2000). We were more interested in whether the weak relationships that appeared supported the use of multiple measures of new teacher competencies.
There are two main concerns over the evaluation of these data. The Summary STE data came from the final evaluation of teacher candidate performance captured at the end of the first clinical experience. We wondered whether the ratings of candidates at this point did not reflect candidates’ final readiness for licensure. Thus, a parallel analysis was conducted on data from the same candidates at the end of their final clinical experience. The pattern of correlations from those data was similar to that of the data in this study, but the specific correlation coefficients were slightly lower.
Second, our program, like many across the nation, is continually improving our assessment practices. This process includes reviewing and updating assessment instruments. Because of this continuous improvement practice, data from adjacent years to this study were not comparable. Although a sample of 94 candidates is acceptable, a larger sample over multiple years would be desirable.
We understand that the external validity of this study is limited. The assessments we used were designed from teacher education standards for the State of Oregon and vary substantially from other states. For instance, Oregon is the only state that requires the TWS as evidence of candidate preparedness even though many programs across the country use TWSs within their curricula. In addition, the limited diversity in the demographics of candidates in our programs will not be similar to many other programs. It may be that the lack of ethnic diversity in our sample affects the results of our assessments in ways that we are not able to recognize from the data analysis. A comparison investigation with a more diverse group of candidates would be informative.
This was not a predictive validity study, per se. However, we analyzed assessments designed to measure the qualities that national and state accrediting agencies indicated represent characteristics of good teachers. Regardless, effective measures of the performance of graduates in their early careers are difficult to develop. Currently, we track employment rates and new teacher attrition rates, and we interview and administer a survey to a sample of principals who employ our teachers. We see confirmation of the efficacy of our assessment procedures at a preliminary level, but we are not in a position to identify which assessments best represent the quality of our graduates. For now, an array of assessments is linked to evidence of graduates performing well as new teachers, lending credence to the predictive validity of these constructs.
Conclusion
Eventually, we may discover that assessment of teacher candidates by organizations external to educator preparation programs (see, for instance, Pearson Education’s edTPA, 2013) will help programs’ graduate teachers who have a greater impact on P-12 student learning than do today’s teachers. It will still be necessary to identify which performance indicators best predict future performance of graduates.
In contrast to reports by others (McCaffrey et al., 2004), high-stakes, single assessments of candidate performance may not assist educator preparation programs in identifying teacher candidates’ strengths and where some improvement in candidate competencies may be warranted. Particularly for teacher candidates, our current approach of assessing multiple factors seems essential (Bill and Melinda Gates Foundation, 2010; Hill, Kapitula, & Umland, 2011) not only for assisting teacher candidates in developing a broad range of abilities but also for understanding how teacher preparation programs may improve their capability to prepare exceptional professional educators—what accreditors call continuous improvement.
Educator preparation programs would do well to remain focused on the standards that guide their programs and continually reevaluate the quality of assessments used to determine candidates’ progress toward meeting and exceeding those standards. As an answer to those who believe single measures of competency will suffice, for now, it does not appear that single measures of teacher competencies are sufficient to determine the breadth of skills required of an effective teacher. It is, therefore, important to understand the interrelationships of the multiple assessments we use to determine candidates’ readiness for licensure.
Footnotes
Declaration of Conflicting Interests
The author(s) declared no potential conflicts of interest with respect to the research, authorship, and/or publication of this article.
Funding
The author(s) received no financial support for the research and/or authorship of this article.