
Abstract
The ERIraos Checklist (CL) is a screening instrument for assessing psychosis risk. Measuring CL data on a Rasch scale means that this scale locates individuals on a dimension of “proximity to psychosis onset” according to their current prodromal status. The probabilistic Rasch model leads to interval (difference) scales. The CL data from the German Research Network on Schizophrenia (GRNS) study were analyzed using the Rasch program Winsteps. All item measures based on data from different patient groups were consistent with the Rasch model. Examples demonstrate how item parameters were comparable in different subgroups and in patients in the early and late prodrome. The CL is a simple assessment tool fulfilling the requirements of a Rasch scale. This guarantees good psychometric properties, such as a high reliability and internal validity, and yields a measure of the construct “proximity to psychosis onset” on a difference scale.
The Initial Prodrome of Schizophrenia
Schizophrenia usually begins with an initial prodromal phase of several years duration. From the onset of the first non-specific symptoms to full-blown psychosis, patients run through a process of symptom aggravation and symptom accumulation, moving nearer to the event of transition to psychosis (Häfner & Maurer, 2001; Häfner et al., 1995). To describe and measure this process, the construct “psychosis proximity” has been introduced. It is based on the idea that a psychotic disorder or schizophrenia follows a certain line of development, before manifest psychosis can be diagnosed. Psychosis is the endpoint of a process unfolding over several years. Its onset usually happens with non-specific symptoms, but symptoms characteristic of depressive disorders and/or negative symptoms of schizophrenia, too, may occur. As the disorder progresses, more specific symptoms, such as typical basic symptoms, manifest themselves, indicating an increasing psychosis risk (Häfner & Maurer, 2005; Häfner et al., 2005; Klosterkötter, Hellmich, Steinmeyer, & Schultze-Lutter, 2001). Symptoms of such an increased “at-risk mental state” are attenuated psychotic symptoms (APS) and brief limited intermittent psychotic symptoms (BLIPS; Yung et al., 1998). Finally, if the psychotic symptoms persist, transition to psychosis occurs, and full-blown psychosis can be diagnosed. The progression from the first non-specific symptom to the onset of the first psychotic symptom should be depictable on a single dimension called “psychosis proximity.”
Measuring Prodromal Development on a Rasch Scale
The probabilistic test model of Rasch implies that the symptoms in question are located on a single homogeneous dimension. Symptom development starts at the far (left) end of this dimension. With a growing number of symptoms, the severity of the disorder, too, increases. Finally, the closest proximity to the time-point when transition to psychosis happens is reached. The symptoms should unfold in a similar sequence in all patients. It is assumed that, once the symptoms have occurred, they usually persist continuously. These assumptions about symptom sequence and symptom persistence imply that in a sample of prodromal patients who are at different stages of the prodromal development non-specific symptoms are reported most often, because more patients experience and pass through the early than the later stages. In contrast, symptoms of greater specificity occur at lower frequencies, because fewer patients reach the late stage of disease development characterized by the more specific symptoms.
It is possible to demonstrate that the terminology of Rasch scaling is applicable to the association between symptom presence and stage of disease development for the purpose of measuring “proximity to psychosis onset” by symptoms of growing severity. If this conception is correct, then the ERIraos Checklist (CL) should fulfill the requirements of the Rasch test model.
How Does Rasch Scaling Work and What Are Its Advantages?
Rasch scaling is a psychometric technique for scaling attributes (abilities, attitudes), based on the work of the Danish mathematician Georg Rasch (1960). The observed test value (raw score, sum score) is used as an indicator of the attribute or ability we want to measure. It is a latent trait parameter, because we cannot observe it directly. The Rasch model belongs to the category of item-response models. It is called a two-parameter model, because it needs only two parameters to explain the test scores: a difficulty parameter to characterize the items and an ability parameter to characterize the persons (Andrich, 1988). The basic assumption holds that the probability of a correct answer of an item increases with the ability of the person tested and decreases with the difficulty of the item. Hence, it is possible to construct an odd indicating the chances of a person to solve the item versus not to solve it: p(x = 1)/p(x = 0). The functions showing how the answer probabilities change depending on the probands’ abilities are called item-characteristic curves (ICCs). The Rasch model produces measurements on a difference scale. Such scales are characterized by absolute measurement units of 1 (= logits) and an arbitrary zero-point, which is usually defined by an item with a solution probability of 50%. This probabilistic test model is consistent with the fact that human behavior is not normally deterministic, but influenced by random factors. All ICCs of the items defining a Rasch scale have an identical shape. They are only shifted in parallel along the abscissa. An important advantage of the Rasch model is that the number of items answered correctly is a sufficient statistic of the total information for estimating the ability. This attribute of the Rasch model is called “specific objectivity.”
Examples for Rasch Scales in Psychiatric Research
The test model was originally developed for measuring people’s task-solving ability by the difficulty of tasks in school attainment tests. In psychiatric research, Rasch scaling has been applied only seldom. There are a few notable publications from research into psychopathology and schizotypal personality and some from quality-of-life research.
Lewine, Fogg, and Meltzer (1983) applied the Rasch model to derive psychiatric scales for assessing negative and positive symptoms in schizophrenia. The authors presented the basic ideas of Rasch scaling, addressing the question of how to transfer these ideas from attainment measurement to the assessment of psychopathological measures.
A large number of studies have reported worse results for people with schizophrenia in the “University of Pennsylvania Smell Identification Test” (UPSIT). Minor, Wright, and Park (2004) conducted Rasch analyses on the UPSIT in chronic patients with schizophrenia and healthy controls. These analyses were done with the assistance of B. D. Wright, the leading protagonist for Rasch analysis in the United States, using the Winsteps software (Linacre & Wright, 1998). The result was that the UPSIT items measured one single (unidimensional) construct “smelling ability” in patients with schizophrenia and healthy controls. The items (here, probes for smelling) and persons could be located on this ability-to-smell dimension.
Lange, Greyson, and Houran (2004) reported on the Rasch analysis of a 16-item scale for the assessment of near-death experiences (NDE; Greyson, 1983) with a satisfactory result.
The detection and possibly also the treatment of mental disorders in non-psychiatric settings need simple screening instruments, applicable daily by general practitioners (GPs) not specially trained in psychiatry. Fink et al. (2004) conducted a Rasch analysis within a validation study of a short diagnostic questionnaire comprising eight dichotomized items (e.g., depressive mood, feeling everything is an effort, nervousness or shakiness inside) of the Symptom Checklist Eight-Item Dichotomized Version (SCL-8d) for the recognition of psychiatric disorders in general hospitals. These authors’ aim was similar to ours with the ERIraos CL.
Olsen, Jensen, Noerholm, Martiny, and Bech (2003) analyzed the internal and external validity of the Major Depression Inventory (MDI) as a method of measuring the severity of depressive states. The MDI includes 12 items, among them the 10 depressive symptoms of the International Classification of Diseases (ICD-10). The authors applied not only the method of classical test analysis to determine the factorial structure and Cronbach’s alpha but also modern psychometric techniques, such as Rasch and Mokken analyses . The Rasch analysis confirmed the symptom order on a single dimension, and the order of the symptoms was comparable with that of the less restrictive Mokken model.
Zelinski and Gilewski (2004) reported a further application of the Rasch model to measuring the self-efficacy of memory. The 10 items of the Rasch modeled “Memory Self-Efficacy Scale” were determined by the computer program Winsteps of Linacre and Wright (1998), an algorithm we also used in our Rasch analyses. Zelinski and Gilewski (2004) started with the 33 items of the “Frequency of Forgetting Scale,” including the best discriminating and most informative items in the new scale. According to the authors, the advantage of the 10-item Rasch scale was its shortness and psychometric properties comparable with the complete 33-item scale.
Finally, Tennant, McKenna, and Hagell (2004) suggested using the Rasch analysis in the development and application of instruments for assessing quality of life. In the Schizophrenia Outpatient Health Outcome (SOHO) study (Prieto et al., 2003), conducted within a European Union project, the transcultural validity of the “Euro Quality of Life Dimension Nr. 5” scale (EQ-D5) was tested. The item order was nearly identical in the 10 cooperating countries: (a) mobility; (b) self-care; (c) usual activities; (d) pain, discomfort; (e) anxiety, depression; and the item parameters were comparable across the different Rasch analyses in the 10 participating countries.
Materials and Methods
Early Detection of Psychosis Risk by the Early Recognition Inventory ERIraos 1
In the German Research Network on Schizophrenia (GRNS), psychosis risk was assessed using the Early Recognition Inventory ERIraos (Häfner, Bechdolf, Klosterkötter, & Maurer, 2012; Maurer, Hörrmann, Trendler, Schmidt, & Häfner, 2006). The ERIraos is a two-step procedure. In Step 1, a 17-item CL is used as a screening instrument, applied before a contact with specialized services for early intervention is established. It is used by GPs, psychiatrists in free practice, and psychologists. In Step 2, experts carry out a comprehensive diagnostic assessment of the “at-risk mental state” at an early-intervention center using the complete 110-item Symptom List (SL) and additional modules for the assessment of further risk factors, such as genetic risk, obstetric and birth complications, alcohol and drug use, and schizotypal personality traits. Table 1 shows an overview of the ERIraos components.
The Components of the Early Recognition Inventory ERIraos.

Note. IRAOS = Interview for the Retrospective Assessment of the Onset of Schizophrenia.
In the GRNS early-intervention study, the ERIraos was administered to 235 patients who fulfilled the criteria for the initial prodrome of psychosis (Häfner et al., 2004). The aim of the study was to derive a model for predicting indication for early intervention (cognitive-behavioral therapy [CBT] or atypical neuroleptic medication), for example, by finding a formula to determine the probability of transition to psychosis.
A prerequisite for a successful early intervention in psychotic disorders is knowledge of the relevant prognostic symptoms occurring in the initial prodrome, at the very beginning of the psychotic episode or, finally, in psychotic transition. A decision for early intervention can be taken in a responsible way only on the basis of reliable information on patients’ at-risk status.
Due to the relative rareness of psychotic disorders and a risk period—sometimes extending over several decades—a psychosis screening in the general population is neither possible nor practical. Early detection, therefore, requires self-identification and self-selection in the first step. This means that people at risk consult their family doctors or psychologists/psychiatrists to report their early, mostly non-specific symptoms and ask for help. In this way, people become active and find their way in the treatment system. Usually, the first point of contact in this system is the GP. Hence, GPs should be sufficiently informed about early prodromal symptoms, risk factors, and forms of manifestation of the initial prodrome to be able to decide how to proceed. It is for this first step of risk augmentation that the CL has been included as a screening instrument in the early recognition inventory ERIraos. It helps the GP to explore early symptoms and, if necessary, initiate the next diagnostic steps at a specialized early-detection and early-intervention center.
The ERIraos CL
The CL, applicable both as an interview and a questionnaire, comprises 17 items. All these items are also included in the comprehensive ERIraos SL. The CL symptoms are listed in Table 2.
Symptoms of the ERIraos Checklist.

The CL symptoms are rank-ordered according to their increasing specificity for psychosis. Those occurring early in the process of disease development are non-specific in nature, for example, restlessness, impaired sleep, depressive mood, and social withdrawal. The subsequent symptoms, closer to psychosis onset, include mistrust, changed perception, and the experience of derealization. As the disorder progresses, APS or BLIPS will occur, indicating a high risk for transiting to psychosis. If the sequence of symptom development is in accordance with the pattern described, then it should be possible to arrange the CL symptoms on a single dimension called “psychosis proximity.” The Rasch model presumes that with growing proximity to psychosis onset the probability of symptom manifestation increases.
ERIraos CL Data Used for the Rasch Analyses
The Rasch algorithm of the Winsteps program presumes dichotomous items (correct vs. not correct or symptom present vs. not present). As the CL items allow a third category “uncertain,” this category had to be counted as 0 (symptom not present).
In the following, the project numbers 1.1.2 2 and 1.1.3 3 refer to the GRNS early-intervention studies, based on n = 125 patients in the early prodromal phase and n = 101 in the late prodrome. Included in Project 1.1.1 was a heterogeneous group of n = 1,060 probands from the GRNS studies, for whom 965 CL data were available, but who were not able or refused to participate, and persons who were already psychotic or did not fulfill other criteria (medication, age) for the early-intervention studies.
Comparisons of the item order and independent estimations of item parameters permitted conclusions on reproducibility and, hence, on the samples’ independence from the solution.
The Rasch analyses were conducted using the program Winsteps of Linacre and Wright (1998, Version 3.52 of July 2004), and SPSS 14 for Windows was used for the statistical analyses.
Results
Rasch Scaling of the CLs from the GRNS Studies
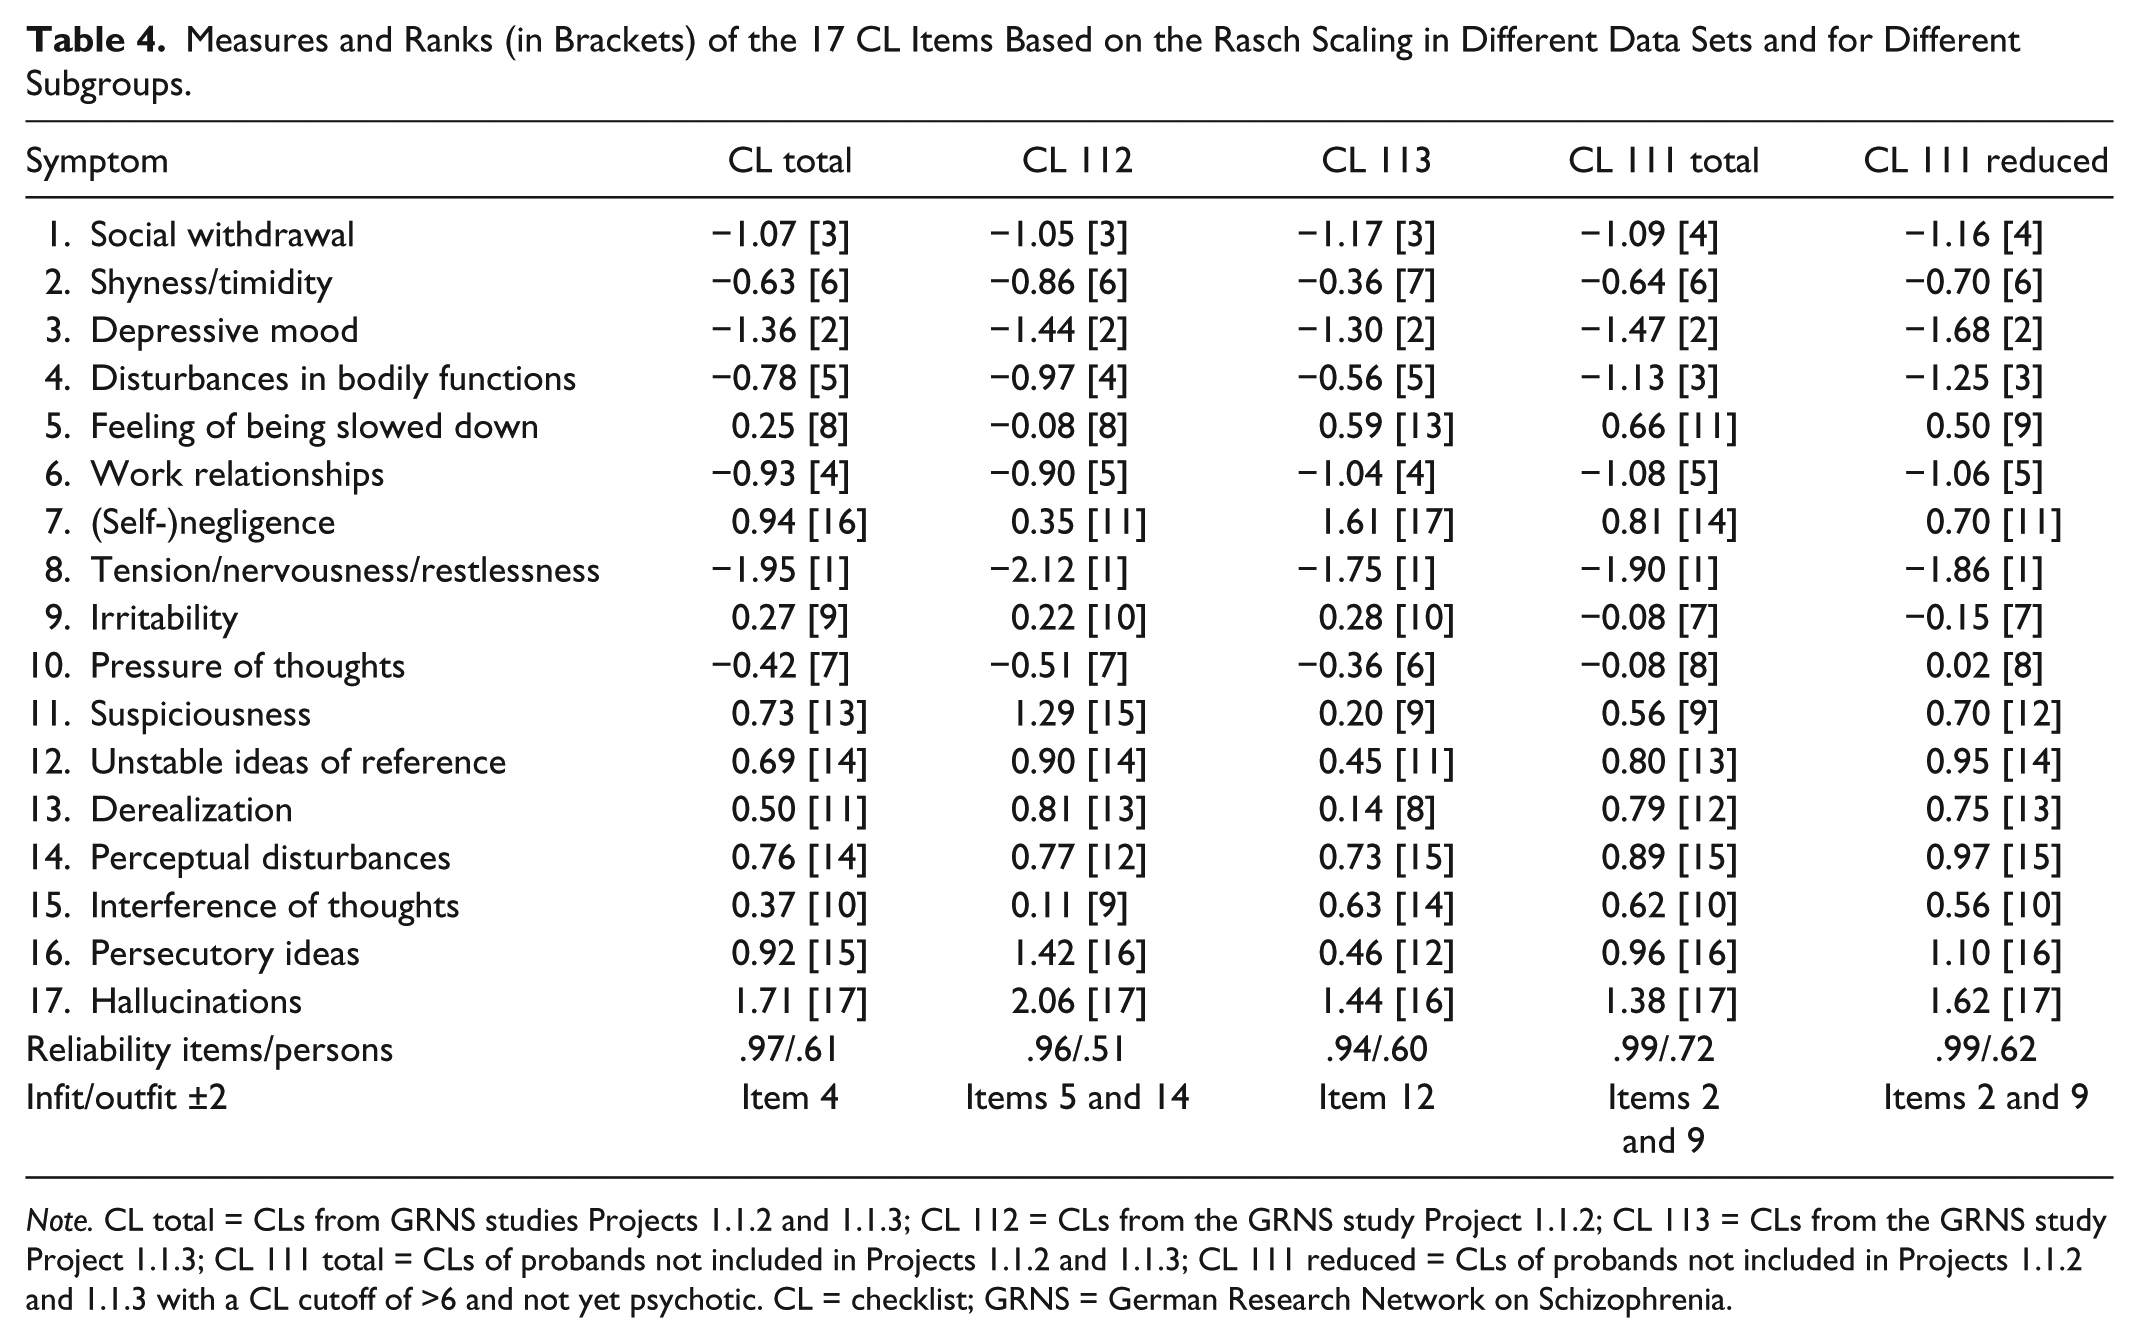
The result of the Rasch analysis run on the 226 CLs from the GRNS studies is presented in Table 3. It shows for the 17 CL items the measures that define the items’ location on the Rasch scale (see column “measure” in Table 3). The items are arranged by decreasing difficulty (total score/count). The scale units are logits, and the value 0 corresponds to a solution probability of 50%. Such an item should be placed between Items No. 5 and 10. Increasing “difficulty” here means that patients more often state that the symptom has not been present. Hence, “difficult” items correspond to rarer symptoms, thus indicating growing proximity to psychosis onset. At the upper end of the scale—at a considerable distance to the other symptoms—Item No. 17 “hallucinations” is located, which in the study sample already indicates transition to psychosis and may occur in this sample as BLIPS. At the lower end of the scale, the Non-Specific Symptom No. 8 “tension, nervousness, restlessness” is located. The items of the scale range between values −1. 95 and +1. 71. All in all, the item order is plausible: Further non-specific symptoms are located at the lower end of the scale (depressive mood, social withdrawal, reduced interest in work, disturbed body functions, shyness/timidity). They are depressive and negative in type, frequently reported as occurring at the non-specific onset of the prodromal stage in psychotic disorders. They are followed by symptoms of disturbed thinking (basic symptoms) and symptoms of dysphoric mood. Both types of symptoms already indicate a higher specificity for psychosis. Next, there are symptoms of an increasing proximity to psychosis onset, for example, derealization or mild paranoid symptoms (unstable ideas of reference, subject-centrism, mistrust, ideas of persecution).
Result of the Rasch Scaling of the ERIraos Checklist.

Only Item No. 4 “disturbed bodily functions” exceeds the range of ± SD.
The only non-specific symptom ranking high, although it actually should not indicate a high proximity to psychosis onset, is Item No. 7 “reduced self-care.” This symptom was rated more often by patients at the early prodromal stage than by those in the late prodrome in Project 1.1.3. As this result contradicted the assumption of homogeneity of the items included in a Rasch scale, the item became a candidate for elimination from the CL. But the Rasch model proved quite flexible against such deviations from the model assumptions, so the standardized in- and outfit statistics did not require the symptom to be excluded (cf. Table 3). Items with infit or outfit measures falling outside the range of ±2 standard deviations do not fit the model and should be eliminated. In the analysis presented here, only Item No. 4 “disturbed body functions” exceeded this cutoff (see also the graphical part of Table 3).
A measure for the overall evaluation of the scale is a reliability coefficient of .97. It corresponds to the quotient of the variance determined by the model divided by total variance (model variance plus residual variance). This quotient approaches a maximum of 1, provided the model estimations and the empirical values are located close to each other, and that was the case here.
Reproducing Rasch Parameters on Different Data Sets
It would be desirable to reproduce the item parameters from a Rasch scaling on different data sets instead of just trusting the reliability statistics. For this reason, we carried out two cross-validations: First, the total sample with complete CL data from the GRNS projects was divided into two subgroups depending on which of the two intervention projects they belonged to. In this way, a subgroup for psychological early intervention (Project 1.1.2: n = 125 patients) and one for pharmacological early intervention (Project 1.1.3: n = 101 patients) were obtained.
A second cross-validation was done in a different, non-overlapping sample of patients who did not participate in the early-intervention studies (CL 111 total). To make the Project 1.1.1 sample better comparable with the GRNS total sample, patients with CL scores below the cutoff value of 6 and those who were already definitely psychotic and fulfilled the inclusion criteria of the GRNS Project 2 first-episode study were excluded from the analysis in the subset of patients called “CL 111 reduced.” This restriction had hardly any influence on the computation of the Rasch item parameters.
The Rasch analyses were based on these subgroups and data sets. Item order and item measures were fairly consistent. After splitting the GRNS total sample into Project 1.1.2 and Project 1.1.3 subsamples for the purpose of cross-validation, patients showing different proximities to psychosis onset were compared. These comparisons yielded differences in the item difficulties. It was particularly interesting to see whether the Rasch measures could be reproduced even under these more stringent test conditions. In the subsamples, the items showed different difficulties, as we had expected they would, but it was still possible to reproduce the item order (Table 4).
Measures and Ranks (in Brackets) of the 17 CL Items Based on the Rasch Scaling in Different Data Sets and for Different Subgroups.
Note. CL total = CLs from GRNS studies Projects 1.1.2 and 1.1.3; CL 112 = CLs from the GRNS study Project 1.1.2; CL 113 = CLs from the GRNS study Project 1.1.3; CL 111 total = CLs of probands not included in Projects 1.1.2 and 1.1.3; CL 111 reduced = CLs of probands not included in Projects 1.1.2 and 1.1.3 with a CL cutoff of >6 and not yet psychotic. CL = checklist; GRNS = German Research Network on Schizophrenia.
The computer program Winsteps, which we used to compute the Rasch analyses, yielded a reliability measure for each scale. It can be interpreted in the same way as Cronbach’s alpha coefficient. The items showed reliability measures ranging from .94 to .99 for the different scalings and, thus, were very satisfactory without exception. For the persons, they ranged between .60 and .72, which seemed to be somewhat low compared with the item reliabilities. Another unsatisfactory result was that some items turned out not to conform to the model in various analyses.
Testing the Correspondence of the Rasch Scales: Correlations of the Item Measures
The different Rasch scalings can be correlated with each other to test whether they lead to comparable item measures. We computed both product–moment correlations (see Table 5) and rank correlations (Spearman’s rho coefficients). In the latter case, only the symptoms’ positions in the rank order of the items were relevant. The correlations yielded satisfactory results. We concluded that the result of the Rasch analysis was replicable and the construct “psychosis proximity” is adequately operationalized in the ERIraos CL.
Correlations of the Item Measures for Different (Sub)Samples.

Note. Above the diagonal: Pearson’s correlations. Below the diagonal: Spearman’s rho. CL total = CLs from GRNS studies Projects 1.1.2 and 1.1.3; CL 112 = CLs from the GRNS study Project 1.1.2; CL 113 = CLs from the GRNS study Project 1.1.3; CL 111 total = CLs of probands not included in Projects 1.1.2 and 1.1.3; CL 111 reduced = CLs of probands not included in Projects 1.1.2 and 1.1.3 with a CL cutoff of >6 and not yet psychotic. CL = checklist; GRNS = German Research Network on Schizophrenia.
p < .001.
The product–moment correlations were above .90 throughout the CL data. The rank correlations were somewhat lower, but still satisfactory.
Graphical Testing of the Correspondence of the Item Measures
Another possibility to test the correspondence of the Rasch measures proceeds from a linear transformation of item measures by the equation y = x − a. Rasch scaling results in a difference scale, which allows only this special form of linear combination (with the multiplicative factor b = 1). The units of Rasch scales are always logits. Hence, they are like the scale units of an absolute scale, but the zero-point can be chosen arbitrarily. This means that the measures can be shifted around the zero-point either to the right (or to the left) by adding (or subtracting) a constant.
If the measures of the “real” CL in the GRNS total sample are used as a reference, then all the other measures should be located on the straight line in Figure 1, provided the values correspond exactly. For different scalings, the values can be shifted parallel to this line. The result is presented in Figure 1: All the measures are located closely to the reference line, for Project 1.1.2—characterized by lower scores—somewhat below it, for Project 1.1.3—characterized by higher scores—somewhat above it. As expected, the replication turned out well.

Rasch scaling of the ERIraos Checklist: Graphical test of the agreement of item measures in different (sub)samples.
Frequency Distributions of Projects 1.1.2 and 1.1.3 Patients on the “Proximity-to-Psychosis” Dimension
The purpose of locating items on a Rasch scale and, thus, of an implicit proof of a homogeneous scale is to determine the degree of manifestation of the attribute in question (i.e., to measure it). The person parameter (in general, “ability”; here, “proximity to psychosis onset”) is determined simply by a raw score—the number of items positively answered. This is a formal attribute of the model, resulting from the fact that Rasch scalability is given, and it is not correct to assume it a priori. Provided that the additive sum score carries all the information about a person’s “ability,” the relevant question is not which symptoms, but only how many symptoms have occurred. Given that items have a defined item order and the data structure conforms to the assumptions of the Rasch model, it is rather unlikely that unexpected symptom patterns—for example, a person answers all the difficult items correctly, but fails in the simple items—will be produced, because items not conforming to the model assumptions will be eliminated during scale construction.
Figure 2 shows the frequency distributions of the patients at the “early” and the “late” prodromal stage as based on the intervention criteria of the GRNS early-intervention studies. The majority of the late prodromal group (Project 1.1.3) is located to the right of the zero-point, whereas the majority of the patients located to the left of the zero-point are at the early prodromal stage (Project 1.1.2). If the two groups, early and late in the prodrome, are determined using the Rasch scale, then the picture will be somewhat different: Probably the group to the left of the zero-point will show a lower proximity to psychosis onset and the group to the right of it (or some other cutoff) a greater proximity to psychosis onset.
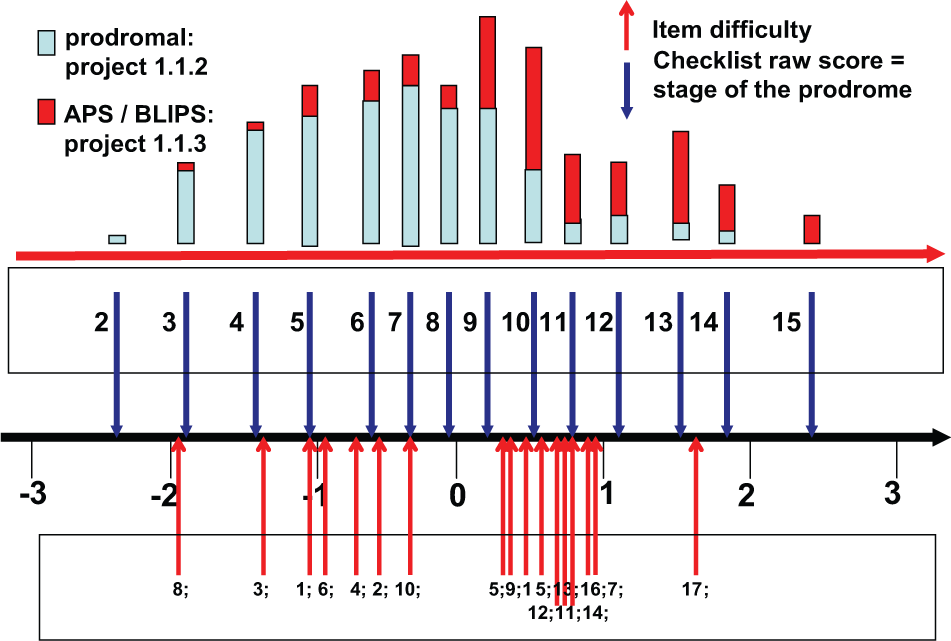
Rasch scaling of the ERIraos Checklist: Item and person measures for the prodromal and the APS/BLIPS group.
Discussion
When psychiatric scales are being developed, the focus is usually on the content and concepts to be assessed, while formal-methodological considerations are sometimes being neglected. For example, a depression scale has to adequately consider the diagnostic criteria of the Diagnostic and Statistical Manual of Mental Disorders (5th ed.; American Psychiatric Association [APA], 2013) or ICD-10 (WHO, 2010) instead of defining a homogeneous scale to measure the severity of depression on an interval scale. This was also the case when we were selecting the symptoms for our CL. The 17 CL items were chosen on the basis of expert judgments, a comprehensive analysis of the literature, and some empirical evidence. The primary aim of designing the CL was not to obtain a unidimensional measure, but a screening method for identifying increased psychosis risk. Psychosis development can be understood as a process which starts with fairly non-specific symptoms followed by more specific ones, until, finally, a psychotic transition occurs. This event is preceded by mild symptoms, for example, APS or BLIPS, which in the end grow to full-blown psychotic symptoms in severity and duration. This description is consistent with the empirical results from the Mannheim Age Beginning Course (ABC) schizophrenia study (Häfner et al., 1995). The results have led to a cumulative model of how psychosis evolves, including a typical temporal sequence of symptoms. Implicit in that process is that the onset of initial symptoms is followed by additional symptoms at later stages of the process, while the earlier symptoms tend to persist. Different stages of disease development are characterized by typical sets of symptoms. In an at-risk sample, symptom frequency can be seen as indicating the symptom sequence. A higher frequency of particular symptoms means that they must have occurred at an earlier stage, too. If this assumption is correct, the two-parameter Rasch model should also be applicable to the CL data, and it should be possible to measure “proximity to psychosis onset” on a unidimensional scale using binary items.
A remarkable advantage of our analyses was the availability of several independent sets of CL data. The scaling procedure was not only applied to the complete GRNS CL data but also used to replicate and cross-validate the item measures. A replication of the Rasch scale on independent data sets and a test of the conformity of symptom measures by correlation analysis yielded high correlations. Similar values from comparisons of item measures—restricted by admissible transformations in a graphical test—and high negative correlations of item measures confirmed the validity of this unidimensional construct and its measurability by the CL.
However, there are a few limitations. Although the reliability of the item measures was near to 1, the reliability of the person measures was not very high. One reason might be that the Rasch model is not applicable to a subgroup of patients with an acute onset of psychotic symptoms. Earlier statistical analyses of Interview for the Retrospective Assessment of the Onset of Schizophrenia (IRAOS) data have shown that this was the case in about 8% of the ABC first-episode sample. Another limitation might be the narrow range of measurement between about −1 and +2 logits covered by the CL symptoms and the fact that the symptom measures are not equally distributed over this range. Nevertheless, the Rasch model enabled us to locate probands on the scale between −2.5 and +2.5. Another unsatisfactory result was that the symptoms which turned out not to be model-conform were not always identical in the different data sets. However, we did not exclude these items from the CL, allowing for a certain degree of item deviation from model conformity.
A final point to be raised pertains to the study design: It did not permit us to proceed from a large number of symptoms in a rich item pool and to select by means of Rasch scaling the most appropriate ones with the highest discriminative power and covering all levels of item difficulties. This surely is a weakness. The CL items were chosen on the basis of expert knowledge, available literature and to some degree also of empirical studies on how schizophrenia develops. The GRNS study produced data on symptom frequency. Only a post hoc testing of whether the CL fulfills the formal conditions of the Rasch model was feasible.
Despite these limitations, it can be concluded that the Rasch scaling of the CL was successful. As the CL symptoms were consistent with the assumptions of the Rasch model, proximity to psychosis onset could be assessed and the process of stepwise disease development over time from less severe to more severe stages of the prodrome could be demonstrated. During this process, psychosis risk kept increasing, as the individuals moved along the “proximity-to-psychosis” dimension. Overall, the successful Rasch scaling of the CL can be seen as a clear indication of the validity of this screening instrument.
Summary
To sum up, Rasch scaling has been successfully applied to a wide range of topics in psychiatry. It enabled us to depict proximity to psychosis onset and, hence, the stage of the initial prodrome on a measurement dimension. The CL symptoms are ordered along this dimension according to the results of the Rasch scaling, and their order indicates the degree of psychosis proximity.
The use of modern probabilistic test models is to be welcomed: They promise
more economical test applications (in terms of time and costs),
a better theoretical foundation for the measurement and measurability of the construct under consideration,
the validation of unidimensional constructs and an item selection based on objective methodological criteria.
They also allow
a more adequate interpretation of people’s responses to test items
and may also
contribute to improving the quality of psychiatric data.
Footnotes
Declaration of Conflicting Interests
The author(s) declared no potential conflicts of interest with respect to the research, authorship, and/or publication of this article.
Funding
The author(s) disclosed receipt of the following financial support for the research and/or authorship of this article: The ABC Schizophrenia Study was funded by the German Research Foundation (DFG) as part of the Special Research Branch (Sonderforschungs-bereich) 258 at the Central Institute of Mental Health from January 1, 1987 to December 30, 1998 and from January 1, 1999 to May 31, 2012 as an independent project. The German Research Network on Schizophrenia (KNS) was funded by the German Federal Ministry of Education and Research (BMBF) (grant 01 GI 0236).