
Abstract
Relations between state-aggregated responses of 619,397 residents to the neuroticism items of the Big Five Inventory and 2005-2007 age-adjusted state cancer, heart disease, total all-cause, other-disease, and non-disease mortality rates for the 50 states were examined. Partial correlations controlling for four state demographic variables and three risk variables showed neuroticism correlated significantly only with cancer mortality (.34) and heart disease mortality (.31). Hierarchical regression with demographic variables entered first, neuroticism second, and risk variables last showed neuroticism accounted for another significant 7.6% of cancer mortality variance and an additional significant 4.6% of heart disease mortality variance. Significant βs of .28 and .30, respectively, showed higher neuroticism was associated with higher cancer and heart disease mortality when all seven demographic and risk variables were controlled. Overall, the results show resident neuroticism is related to state cancer and heart disease mortality rates but not to total all-cause, other-disease, or non-disease mortality rates.
Cancer and heart disease mortality rates vary greatly from nation to nation. Based on the most recent data for 192 countries (WorldLifeExpectancy, 2013b), the three with the highest annual cancer mortality rates have a mean rate that is approximately 16 times that of the three with the lowest annual cancer mortality rates: Maldives, Mongolia, and Hungary have the highest; Syria, Samoa, and Kiribati have the lowest. Similarly, in regard to coronary heart disease, the three countries with the highest annual mortality rates have a mean rate that is approximately 4 times that of the three with the lowest mortality rates: Turkmenistan, Ukraine, and Kyrgyzstan have the highest; Japan, France, and Kiribati have the lowest.
Within the United States, cancer and heart disease mortality rates also differ rather sharply from state to state (WorldLifeExpectancy, 2013a). For example, age-adjusted cancer mortality rates per 100,000 for 2010 ranged from a high of 208.3 in Kentucky to a low of 133.7 in Utah. As well, age-adjusted total heart disease mortality rates per 100,000 for 2010 ranged from a high of 251.1 in Mississippi to a low of 119.4 in Minnesota.
What can at least in part account for such geographical differences in cancer and heart disease mortality? From the emerging perspective of psychological geography (Rentfrow, 2010, 2014; Rentfrow, Gosling, & Potter, 2008), Rentfrow et al. suggested a novel answer based on American state-level evidence: personality differences between the residents of different geographical units. They found that state cancer and heart disease mortality rates are elevated in states where residents are higher on the neuroticism personality dimension of the Big Five (John & Srivastava, 1999).
The “Big Five” refers to the most widely accepted contemporary model of personality differences (e.g., Costa & McCrae, 1987, 1995; Goldberg, 1990; John & Srivastava, 1999). It involves five personality traits that represent the key ways in which individuals differ in their dispositional tendencies: openness to experience, conscientiousness, extraversion, agreeableness, and neuroticism. Those high on neuroticism manifest heightened degrees of anxiety, vulnerability, sadness, depression, angry hostility, irritability, impulsiveness, fearfulness, helplessness, self-consciousness, embarrassment, and the inability to cope with stress. Neuroticism is quite stable over the course of adulthood (Costa & McCrae, 1987).
In the research of Rentfrow et al. (2008), more than 600,000 Americans responded to the full 44-item Big Five Inventory (John & Srivastava, 1999). From the responses, Rentfrow et al. computed the mean score for each state and the District of Columbia on each of the Big Five. These mean scores then were presented as five z scores for each state to facilitate interpretation and comparison. As part of their validation process, Rentfrow et al. (2008) examined correlations between their Big Five state z scores (n = 51) and various state variables including cancer and heart disease mortality rates from the 1990s. Partial correlations showed that levels of neuroticism correlated .70 with cancer mortality rates when the four other Big Five variables were statistically controlled. As well, the partial correlation was .30 when state median income, percent with at least a college degree, percent African American, proportion living in a city with at least 1,000,000 residents, and percent female were controlled. Similarly, neuroticism correlated .74 with heart disease mortality when the other Big Five were controlled and .43 when the five demographic variables were controlled. The only other Big Five relation occurred for conscientiousness, which correlated .31 with heart disease mortality with the other Big Five variables controlled but .00 with the five demographic variables controlled.
If cancer and heart disease mortality are more likely in populations characterized by higher mean levels of neuroticism, through what processes might this link be established and maintained? Stress and lack of efficacy in the management of stress continue to be implicated in the dynamics of cancer and heart disease onset and mortality (e.g., Baum, Trevino, & Dougall, 2011; Emery, Anderson, & Goodwin, 2013). Correspondingly, according to the Big Five (John & Srivastava, 1999), a person higher on the neuroticism dimension is one who generally tends to be emotionally unstable, tense, unable to relax, moody, depressed or blue, easily upset, prone to excessive worrying, easily stirred to a nervous state, unable to handle stress well, and unable to remain calm in tense situations. Therefore, the most plausible interpretation is that aspects of this constellation of personal characteristics, which center mostly on stress and stress management, may somehow be involved in the onset of at least some lethal forms of cancer and heart disease, and that the observed pattern of results at the state level is reflective of such underlying dynamics at the individual level. As well, both illness and personality are heavily influenced by genetics (Hobgood, 2010), and it is possible that aspects of genetic endowment share relations to neuroticism and to cancer and heart disease, and that common linkages ultimately at least partially account for relations between neuroticism and cancer and heart disease mortality. In addition, higher levels of physiological biomarkers of chronic inflammation related to greater morbidity and mortality, such as interleukin-6 and C-reactive protein, have been found to be higher in more neurotic individuals (Sutin et al., 2010), and this link too may prove to be important in the future in explaining the association between neuroticism and cancer and heart disease mortality.
At the individual level of analysis, there is evidence that neuroticism positively correlates with all-cause mortality, which, of course, includes cancer mortality and heart disease mortality (e.g., B. P. Chapman, Fiscella, Kawachi, & Duberstein, 2010; Martin et al., 2006; Mroczek & Spiro, 2007; Mroczek, Spiro, & Turiano, 2009; Murberg, Bru, & Aarsland, 2001; Nakaya et al., 2006; Shipley, Weiss, Der, Taylor, & Deary, 2007; Ploubidis & Grundy, 2009; Wilson et al., 2005). Nevertheless, there are complications. For example, Ploubidis and Grundy found that higher neuroticism was associated with lower mortality for women but higher mortality for men. As well, other studies have found either a negative correlation between neuroticism and all-cause mortality (e.g., Korten et al., 1999; Weiss & Costa, 2005; Weiss, Gale, Batty, & Deary, 2013) or no correlation (e.g., Hagger-Johnson et al., 2012; Huppert & Whittington, 1995; Iwasa et al., 2008; Maier & Smith, 1999; Masui, Gondo, Inagaki, & Hirose, 2006). A review of prospective studies by Roberts, Kuncel, Shiner, Caspi, and Goldberg (2007) concluded that higher neuroticism does tend to be associated with shorter lives. Overall though, it probably would be more accurate to say that neuroticism seems to be associated with higher all-cause mortality risks, but some studies have not found such a connection.
However, in contrast to the state-level association between a greater likelihood of death from cancer and higher neuroticism reported by Rentfrow et al. (2008), individual-level studies have shown only limited support specifically for such links between neuroticism and cancer mortality. In his broad review of the significance of neuroticism for public health, Lahey (2009) cited the Danish prospective study of Nakaya et al. (2006) to confirm such a neuroticism–cancer mortality link, but others have found no relation between neuroticism and cancer mortality (Hagger-Johnson et al., 2012; Nakaya et al., 2010, 2005; Shipley et al., 2007). Although the focus in the present study is on mortality from all cancers, some researchers have focused on specific cancers such as breast cancer, Hodgkin’s disease, and non-Hodgkin’s lymphoma in studies with relatively limited sample sizes and have found no relation between mortality and neuroticism (e.g., Dean & Surtees, 1989; Greer, Morris, & Pettingale, 1979; Hislop, Waxler, Coldman, Elwood, & Kan, 1987; Ratcliffe, Dawson, & Walker, 1995). As well, Amelang (1997) reported that neuroticism was associated with cancer incidence, but others have found no such relations (e.g., Hansen, Floderus, Frederiksen, & Johansen, 2005; Nakaya et al., 2010). So overall, evidence for links between neuroticism and cancer incidence and cancer mortality is mixed. After an extensive review of the literature, Ranchor and Sanderman (2006) claimed that “personality is clearly unrelated to the onset of and survival from cancer” (p. 47), but Johansen (2012) suggested the need for additional research to eventually draw a more definitive conclusion about the relation of neuroticism to cancer.
Associations between cardiovascular heart disease and higher neuroticism at the individual level of analysis have been documented (e.g., Charles, Gatz, Kato, & Pedersen, 2008; Clark et al., 2012; Suls & Bunde, 2005; Yousfi, Matthews, Amelang, & Schmidt-Rathjens, 2004). This relationship also has been found at the state level of analysis by Pesta, Bertsch, McDaniel, Mahoney, and Poznanski (2012), who reported that the Rentfrow et al. (2008) state estimates of neuroticism were related to the state prevalence of heart disease. However, an individual-level prospective study by Nakaya et al. (2005) did not find that neuroticism was a risk factor for heart disease. Specifically in regard to death from heart disease, Shipley et al. (2007) found that high neuroticism was related to heart disease mortality risk, and Murberg et al. (2001) found that neuroticism predicted mortality in a sample of heart failure patients. However, Hagger-Johnson et al. (2012) found that high neuroticism was only a risk factor for low socioeconomic status (SES) women but was a protective factor for high SES women. The state-level results of Rentfrow et al. also showed an association between high neuroticism and heart disease mortality risk. Overall, the evidence does suggest a relation between neuroticism and heart disease mortality at both the individual and the state levels of analysis.
A basic assumption of the theoretical framework of Rentfrow et al. (2008) is that a geographical area’s aggregate position on a particular dispositional dimension reflects the central tendency of the geographical area’s individuals on that dimension. In turn, an area’s aggregate dispositional position links to the pervasiveness in that area of manifestations of the psychological and behavioral tendencies related to that particular dispositional dimension. Aggregate relations between personality and social indicators may derive from associations between personality variables and such psychological and behavioral tendencies at the individual level.
Such relations, however, may be most detectable at the aggregate level of analysis because the nature of aggregation itself can increase the chances of finding significant relations between variables (e.g., Erikson, Wright, & McIver, 1993; Rushton, Brainerd, & Pressley, 1983). Errors of measurement tend to cancel each other out when items are aggregated. Consequently, correlations between variables based on aggregation are higher than correlations based on the original cases. The capacity of aggregation to reduce error variances also can produce associations between aggregate variables at the macro level that might not be evident in existing research results at the conventional micro level in psychology.
Rentfrow et al. (2008) noted the complications inherent in extrapolations across individual-level and aggregate-level relations. The “ecological fallacy” (Robinson, 1950) occurs when one assumes that aggregate-level results generalize to the individual level; the “compositional fallacy” (Pettigrew, 1997) occurs when one assumes that individual-level results generalize to the aggregate level. One cannot assume that relations at one level also apply to the other level although relations often are consistent across analytic levels. Cross-level generalization is dependent on empirical verification at each level. Parallel relations at each level must be demonstrated, not assumed. It must be determined empirically whether links exist at both levels to consider whether it is logical to conclude that relations at the individual level may be responsible for relations at the aggregate level. As well, Rentfrow et al. noted that relations at the aggregate and the individual levels may be consistent but remain logically independent. In other words, different explanations may be appropriate for parallel relations at the aggregate and individual levels. Of course, the possibility also exists that geographical regularities in relations between variables may be identified that pertain only to aggregates in an analogous manner to the way macroeconomic principles relate to market masses and not necessarily to individuals within the market (e.g., Katona, 1975).
Rentfrow et al. (2008) explicitly intended their preliminary explorations to spur further in-depth investigations. Therefore, the present study reexamined the relation between neuroticism and cancer and heart disease mortality rates at the state level of aggregation with more recent data, with additional controls for demographic and risk factors, and with alternative analytic strategies. As well, the present research was designed to determine whether neuroticism also was related to all-cause mortality rates, other-disease mortality rates, and non-disease mortality rates among the 50 states, and whether such relations persisted when several appropriate demographic and risk variables were statistically controlled.
The present study incorporated demographic controls comparable with those used by Rentfrow et al. (2008), but they were somewhat more broadly based in certain respects. For example, Rentfrow et al. gauged SES with state median income and percent of residents with a college degree. In the present work, state high school graduation, undergraduate degree, personal income per capita, poverty line, and unemployment data were used to create an SES composite.
As well, in the present study, the relations of neuroticism to each of the five mortality rate variables also were analyzed in conjunction with three well-known risk factors: obesity prevalence, smoker prevalence, and alcohol consumption rates. Research has shown that obesity, smoking, and drinking are associated with cancer and heart disease (e.g., Danaei, Vander Hoorn, Lopez, Murray, & Ezzati, 2005; Huxley & Woodward, 2011; Roerecke & Rehm, 2012). However, neuroticism also has been found to be predictive of these three risk factors, with higher neuroticism associated with greater chances of obesity (e.g., Brummett et al., 2006; B. P. Chapman, Fiscella, Duberstein, Coletta, & Kawachi, 2009; McCann, 2011), smoking (e.g., Costa & McCrae, 1981; McCann, 2010; Terracciano & Costa, 2004), and drinking (e.g., Kuntsche, von Fischer, & Gmel, 2008; Ruiz, Pincus, & Dickinson, 2003; Rush, Becker, & Curry, 2009).
Statistical analysis of the relations of neuroticism to the mortality criteria in the present study was more varied and comprehensive than those used by Rentfrow et al. (2008). They analyzed the partial correlations between each of the Big Five and cancer and heart disease mortality rates first controlling for the other four personality variables and then, in a separate analysis, controlling for state median income, percent college education, percent African American, percent female, and proportion living in a city with at least 1,000,000 residents. In the present work, relations between neuroticism and the five mortality rate criteria were determined using Pearson correlation, partial correlation, and multiple regression. The partial correlations were computed with demographic controls and with simultaneous demographic and risk factor controls. Hierarchical regression equations also were computed including demographic variables in conjunction with risk factors, taking into account the fact that neuroticism has been shown to be predictive of the risk factors. As well, the specificity of the relations of neuroticism to state cancer and heart disease mortality rates were tested by comparing the relations of neuroticism with state and adjacent-state mortality rates using Pearson correlation, partial correlation, and multiple regression strategies.
Although the current study should be considered exploratory, there were certain expectations. Based largely on the results of Rentfrow et al. (2008), it seemed fairly clear that higher state levels of resident neuroticism should be associated with elevated state cancer and heart disease mortality rates. On the other hand, it was an open question whether neuroticism would be related to state all-cause mortality rates, other-disease mortality rates, or non-disease mortality rates. It also was not known whether adjacent-state cancer and heart disease mortality rates would show similar relations to neuroticism for adjacent states versus target states, or if control for relations in adjacent states would eliminate relations between neuroticism and cancer and heart disease mortality rates for target states.
Method
Measures
State age-adjusted mortality rates
The mean annual age-adjusted cancer mortality rate, heart disease mortality rate, total (all-cause) mortality rate, and non-disease mortality rate per 100,000 for each state based on the data for 2005, 2006, and 2007 were obtained from the Centers for Disease Control and Prevention (CDC) WONDER Online Database (2012). State age-adjusted cancer mortality rates included all cancer sites, state age-adjusted heart disease mortality rates included all diseases of the heart, and state total (all-cause) mortality rates included deaths from all causes. State non-disease mortality rates included all deaths not attributable to disease and illness such as those from drowning, firearms, motor vehicle traffic, poisoning, suffocation, falling, and all manner of injury. Age adjustments were made by the source using the 2000 U.S. standard million population. No states were flagged by the source as unreliable for any of the four selected mortality rate variables. In addition to these four state mortality variables, a fifth variable was constructed for this study: The sum of the state age-adjusted cancer mortality rate, the state age-adjusted heart disease mortality rate, and the state age-adjusted non-disease mortality rate was subtracted from the state age-adjusted total mortality rate to form a state mortality rate variable based on all other deaths related to diseases other than cancer and heart disease.
Neuroticism
Rentfrow et al. (2008) provided z scores for the Big Five personality variables for each of the 50 states and the District of Columbia. The scores were based on the responses of 619,397 residents to the 44-item Big Five Inventory (John & Srivastava, 1999) in an internet survey conducted between December of 1999 and January of 2005. Sample sizes were relatively large from each state, ranging from 1,536 in Wyoming to 71,873 in California. Rentfrow et al. showed that the sample was representative of the American population and drew respondents from each state in direct proportion to the 2000 census figures. In regard to the Big Five, they also reported that “the state-level factor structure was virtually identical to the factor structure commonly found at the individual level” (p. 349). The Big Five variables had high inter-item reliabilities with mean individual-level Cronbach alpha of .81 and state-level alpha of .89. For neuroticism, the mean r was .85 between three random subsamples and the r was .86 between two temporally based subsamples. Rentfrow et al. also demonstrated validity by showing that neuroticism was related to several state crime, health, and mortality variables according to their predictions.
SES
For each state in 2000 and 2005, the percent of the 25-and-above population with at least high school graduation, the percent of the 25-and-above population with at least an undergraduate degree, the personal income per capita in constant dollars, the percent of individuals living below the poverty line, and the unemployment rate were obtained from the Statistical Abstract of the United States (U.S. Census Bureau, 2001b, 2002, 2007, 2008). For the 50 states, the correlations between the 2000 and 2005 values were .88 for high school graduation, .90 for undergraduate education, .97 for personal income, .94 for below the poverty line, and .50 for unemployment. The mean of the values for 2000 and 2005 for each state for each of the variables, with the sign reversed for the poverty line and unemployment variables, were calculated. The five resulting variables then were converted to z scores, summed, and divided by 5 to yield an SES value for each state. The SES composite variable had a Cronbach’s alpha of .86.
White percent
For each state in 2000, the White population percent was taken from the Statistical Abstract of the United States (U.S. Census Bureau, 2002). For each state in 2005, the White population percent was not provided. Therefore, the population that was White (U.S. Census Bureau, 2007) was divided by the total population (U.S. Census Bureau, 2007) and multiplied by 100 to form the White percent variable. The White percents for 2000 and 2005 were highly correlated, r(48) = .95, p < .001, so they were summed and divided by 2 to form the White percent variable for the present study.
Urban percent
The percent of each state’s population that was urban in the 2000 census was taken from the Statistical Abstract of the United States (U.S. Census Bureau, 2007). Data for 2005 were unavailable. Therefore, an urban percent composite could not be produced and the present research relied on the 2000 values.
Female percent
Male to female ratios for each state in 2000 and in 2005 were obtained from the U.S. Census Bureau (2001a, 2005) as percentages. The 2000 and 2005 ratios correlated r(48) = .91, p < .001. A female percent variable for 2000 and then for 2005 was computed according to the following formula: 100 − ((male to female ratio / (male to female ratio + 100)) × 100). The mean of the two variables served as the female percent variable.
Obesity prevalence
The percent of the population in each state in each year from 2000 to 2005 with a body mass index (BMI) of 30.0 or greater was obtained from the prevalence and trends section of the Behavioral Risk Factor Surveillance System (2011). For the present study, the percents for each state over the 6 years were averaged to form the obesity prevalence variable. Cronbach’s alpha was .98.
Smoker prevalence
The percent of the population in each state who were current smokers in 2000, 2001, 2002, 2003, 2004, and 2005 also was provided by the prevalence and trends section of the Behavioral Risk Factor Surveillance System (2011). For each state, the percents over the 6 years were averaged to produce a smoker percent composite. Cronbach’s alpha was .97.
Alcohol consumption rates
The percent of the population in each state who were heavy drinkers, defined as men having more than two drinks daily and women having more than one drink daily, also was taken from the prevalence and trends section of the Behavioral Risk Factor Surveillance System (2011). Data were not available for 2000. Therefore, state percents were taken for each year from 2001 to 2005. The 2004 percent was not available for Hawaii so the mean of the 2003 and 2005 percents served as a substitute. The percents for each state over the 5 years were averaged to form the alcohol consumption variable. Cronbach’s alpha was .95.
Results
A preliminary examination of the distributions on each of the 13 variables to be included in the main analyses revealed that three variables each had one state with scores beyond −3 or +3 standard deviations. To preserve degrees of freedom in a relatively small sample, instead of excluding states as outliers, values were adjusted to fall at the three standard deviation level to eliminate their potential undue influence. For Utah, the cancer mortality rate increased from 133.8 to 135.8 and the smoker percent increased from 12.13 to 13.53. For Hawaii, the White percent rose from 25.56 to 43.40.
Table 1 shows the state means, standard deviations, and Pearson correlations for the variables in the main analyses. As expected, neuroticism was strongly associated with higher rates of cancer mortality, r(48) = .67, p < .001, and heart disease mortality, r(48) = .62, p < .001. Neuroticism also was correlated to a lower degree with total mortality rates, r(48) = .45, p < .001, a correlation significantly smaller than that between neuroticism and cancer mortality rates, Hotelling’s t(47) = 3.52, p < .01, and neuroticism and heart disease mortality rates, Hotelling’s t(47) = 2.73, p < .01. Neuroticism did not correlate significantly with other-disease or non-disease mortality rates.
Means, Standard Deviations, and Pearson Correlations for the 13 Variables for the 50 States.

Note. SES = socioeconomic status.
p < .05. **p < .01. ***p < .001.
Partial correlations were computed to determine the association between neuroticism and each of the five mortality variables with the four demographic variables controlled, and with both the four demographic variables and the three risk factors simultaneously controlled. The results are shown in Table 2. With adjustments for the two levels of control, neuroticism remained positively correlated with cancer mortality rates and heart disease mortality rates at statistically significant levels. The four significant partial correlations ranged from .31 to .41. In contrast, neuroticism did not correlate with total mortality rates, with other-disease mortality rates, or with non-disease mortality rates.
Partial Correlations of Neuroticism With the Five State Mortality Rate Variables Controlling for Four Demographic Variables, and for Four Demographic Variables and Three Risk Factors Combined.

p < .05. **p < .01. ***p < .001.
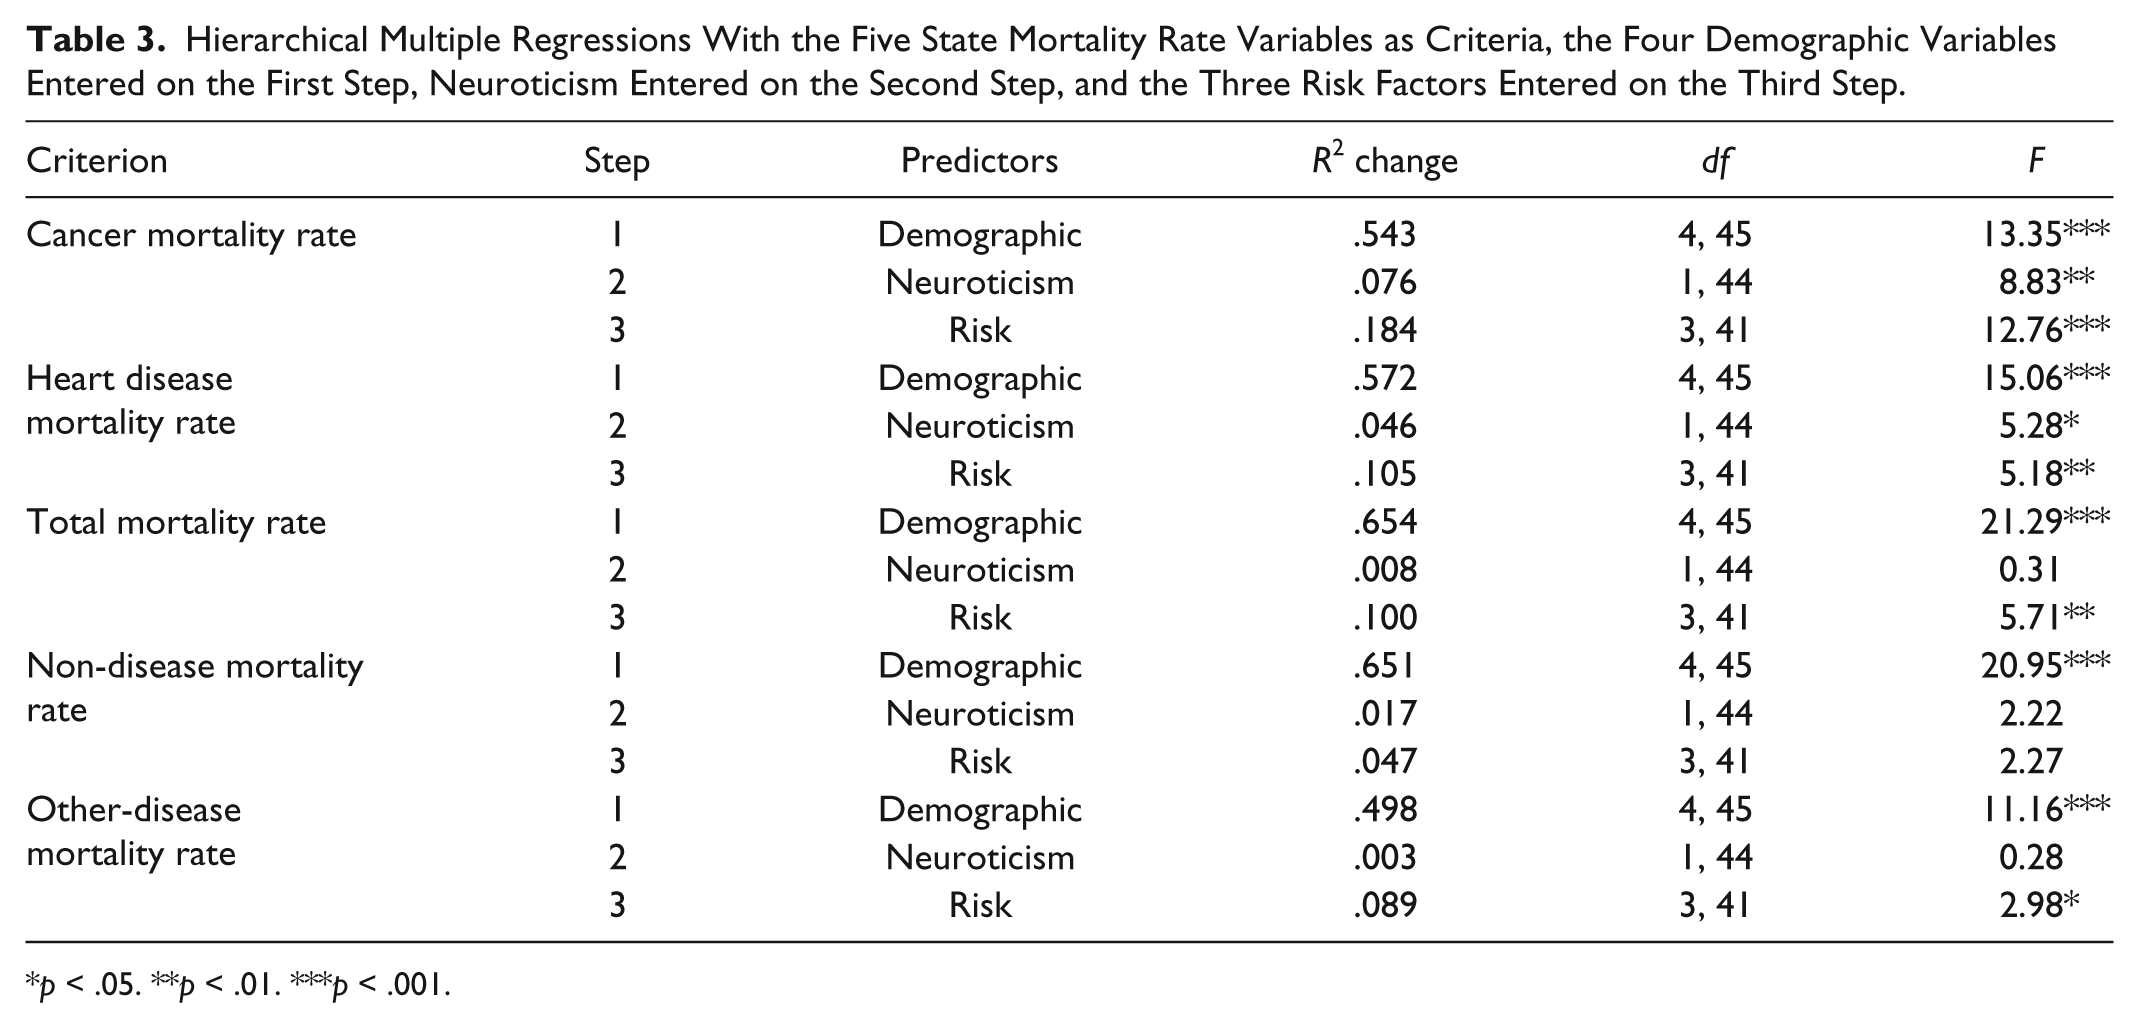
Hierarchical multiple regressions also were computed with the five state mortality rate variables as criteria. The four demographic variables were entered on the first step, neuroticism was entered on the second step, and the three risk factors were entered on the third step. Tables 3 and 4 display the results. As Table 3 shows, with the four demographic variables statistically controlled, neuroticism accounted for an additional 7.6% of the variance in cancer mortality rates and an additional 4.6% of the variance in heart disease mortality rates. However, neuroticism only accounted for non-significant increments of .8% in total mortality rates, 1.7% in non-disease mortality rates, and .3% in other-disease mortality rates. In addition, as the β weights in Table 4 show, with neuroticism effectively entered last in the equation, higher neuroticism was still significantly associated with higher cancer and heart disease mortality rates. However, neuroticism did not surface as an independent predictor of total mortality rates, non-disease mortality rates, or other-disease mortality rates.
Hierarchical Multiple Regressions With the Five State Mortality Rate Variables as Criteria, the Four Demographic Variables Entered on the First Step, Neuroticism Entered on the Second Step, and the Three Risk Factors Entered on the Third Step.
p < .05. **p < .01. ***p < .001.
Significant β Coefficients Stemming From the Multiple Regressions in Table 3.

Note. SES = socioeconomic status.
p < .05. **p < .01. ***p < .001.
Supplementary analyses showed no reliable evidence that neuroticism interacted with any of the four demographic variables or any of the three risk factors in relation to each of the five mortality criteria. 1 In addition, supplementary hierarchical multiple regression analyses provided evidence that none of the other Big Five personality variables could account uniquely for variance in state cancer and heart disease mortality rates or account for the relations found between neuroticism and cancer and heart disease mortality rates. 2 As well, supplementary analyses carried out to determine the impact of the three adjustments for outliers by repeating all of the previous analyses with the original state values rather than the adjusted values showed that virtually all discrepancies in the two sets of results were small and inconsequential. 3
A visual examination of maps of the contiguous 48 states containing the cancer and heart disease mortality rates for each state suggested that similar rates were somewhat clustered in certain areas, raising the possibility of spatial autocorrelation (e.g., Legendre, 1993). This led to the development of an adjacent-state cancer mortality rate variable and an adjacent-state heart disease mortality rate variable. For each state, the mean cancer mortality rates and the mean heart disease mortality rates of the states that border the state were calculated for comparison purposes. For New Mexico, Utah was considered adjacent; for Arizona, Colorado was considered adjacent; for Utah, New Mexico was considered adjacent; and for Colorado, Arizona was considered adjacent. Other researchers also have used such an approach (e.g., Musterd, Andersson, Galster, & Kauppinen, 2008). State cancer mortality rates correlated .74 (p < .001) with adjacent-state cancer mortality rates, and state heart disease mortality rates correlated .62 (p < .001) with adjacent-state heart disease mortality rates confirming spatial clustering. Such correlations between a variable and its “spatial lag” formed by calculating the mean values of the variable for its neighboring polygons can be interpreted as Moran’s I (e.g., Briggs, 2010). When the variable of interest and the lag variable are in standardized form, and the variable of interest is the predictor and the lag variable is the criterion, “the slope of this regression line is Moran’s I” (Briggs, 2010, p. 20). Of course, the slope is represented by the β coefficient, and with only one predictor, the correlation between the two variables is equal to the β coefficient. Therefore, in the present context, we can conclude that Moran’s I is .74 (p < .001) for state cancer mortality rates and .62 (p < .001) for state heart disease mortality rates when the distance weights for neighboring polygons are determined in this manner.
These spatial autocorrelations prompted further partial correlation and multiple regression analyses to explore and compare state and adjacent-state mortality rate relations with neuroticism. First, partial correlations were computed to determine relations between neuroticism and state cancer and heart disease mortality rates, and between neuroticism and adjacent-state cancer and heart disease mortality rates, with the four demographic variables controlled. The procedure also was repeated with both the demographic variables and the risk factors simultaneously controlled. The results appear in Table 5. Higher neuroticism was associated with higher cancer and heart disease mortality rates for the target states. The four significant correlations ranged from .33 to .44. However, in contrast, neuroticism was not significantly correlated with either the adjacent-state cancer mortality rates or the adjacent-state heart disease mortality rates. The four non-significant correlations ranged from .02 to .18.
Partial Correlations of Neuroticism With State and Adjacent-State Cancer Mortality Rates and State and Adjacent-State Heart Disease Mortality Rates Controlling for Four Demographic Variables, and for Four Demographic Variables and Three Risk Factors Combined (n = 48).

p < .05. **p < .01. ***p < .001.
Second, hierarchical multiple regressions were computed with state and adjacent-state cancer and heart disease mortality rates as the dependent variables. The four demographic variables were entered on the first step, neuroticism was entered on the second step, and the three risk factors were entered on the third step. The results are shown in Table 6. Neuroticism accounted for significant increments of 7.5% of the variance in state cancer mortality rates and 7.4% of the variance in state heart disease mortality rates. However, neuroticism only accounted for non-significant increments of 1.5% of the variance in adjacent-state cancer mortality rates and 0.1% of the variance in adjacent-state heart disease mortality rates. As well, with neuroticism effectively entering the equation last, neuroticism uniquely predicted state cancer mortality rates (β = .25, t = 2.159, p < .05) but not adjacent-state cancer mortality rates (β = .16, t = 1.149, p = .26), and neuroticism uniquely predicted state heart disease mortality rates (β = .36, t = 2.751, p < .01) but not adjacent-state heart disease mortality rates (β = .02, t = 0.091, p = .93).
Hierarchical Multiple Regressions With State and Adjacent-State Cancer Mortality Rates and State and Adjacent-State Heart Disease Mortality Rates as Criteria, the Four Demographic Variables Entered on the First Step, Neuroticism Entered on the Second Step, and the Three Risk Factors Entered on the Third Step (n = 48).

p < .05. **p < .01. ***p < .001.
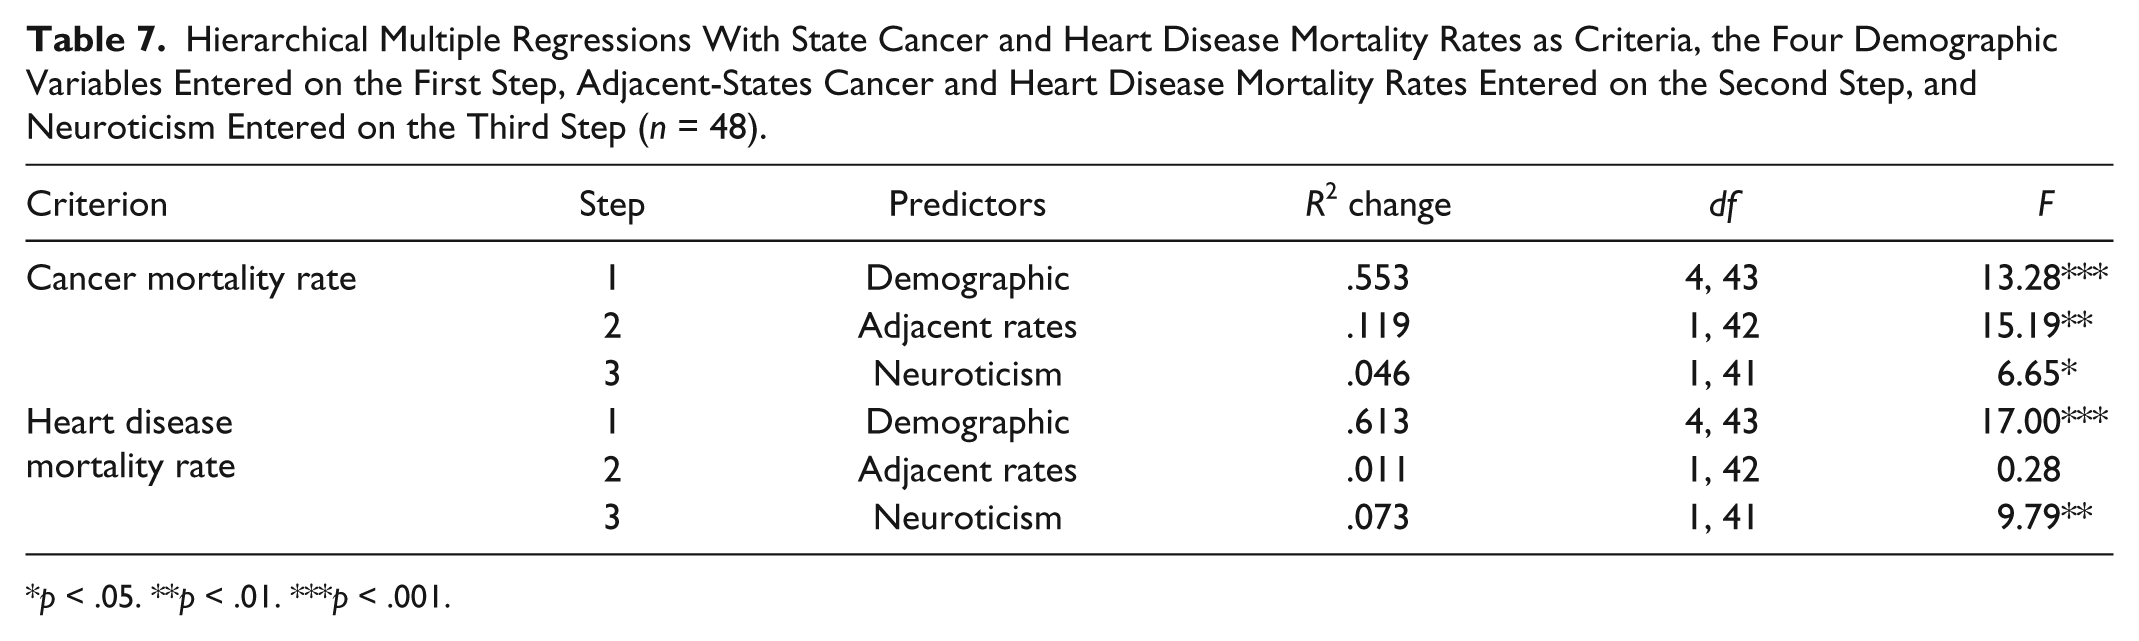
Third, hierarchical multiple regressions were computed with state cancer and heart disease mortality rates as the dependent variables, the four demographic variables entered on the first step, the corresponding adjacent-state mortality variable entered on the second step, and neuroticism entered on the third step. The results are presented in Table 7. With the demographic variables and the adjacent-state cancer mortality rates controlled, neuroticism still accounted for a further significant 4.6% of the variance in state cancer mortality rates. Similarly, with the demographic variables and the adjacent-state heart disease mortality rates controlled, neuroticism still accounted for another significant 7.3% of the variance in state heart disease mortality rates. Overall, the preceding three sets of results consistently showed that although state and mean adjacent-state cancer mortality rates, and state and mean adjacent-state heart disease mortality rates were positively correlated, the corresponding mortality variables were differentially related to neuroticism.
Hierarchical Multiple Regressions With State Cancer and Heart Disease Mortality Rates as Criteria, the Four Demographic Variables Entered on the First Step, Adjacent-States Cancer and Heart Disease Mortality Rates Entered on the Second Step, and Neuroticism Entered on the Third Step (n = 48).
p < .05. **p < .01. ***p < .001.
To further explore this issue, spatial autocorrelation between state and mean adjacent-state residuals was computed for residuals based on the full 8-predictor equations for state cancer mortality and heart disease mortality rates in the contiguous 48 states. Using the same approach as before for the state cancer and heart disease mortality rates, Moran’s I was a non-significant .17 (p = .255) for state cancer mortality rate residuals and a non-significant .09 (p = .529) for state heart disease mortality rate residuals. Therefore, despite the significant degree of spatial autocorrelation for state cancer mortality rates and state heart disease mortality rates, the respective multiple regression state residuals did not show spatial autocorrelation. This is a critical distinction because it is the independence of residuals rather than spatial independence of the dependent variable that ultimately is crucial for the assumption of independence in multiple regression analysis (e.g., Diniz-Filho, Bini, & Hawkins, 2003; Hassall & Sherratt, 2011; McKitrick & Nierenberg, 2010). 4 When “the dependent variable is spatially autocorrelated but the residuals are not, this provides evidence that the explanatory model is well-specified and autocorrelation does not bias the inferences” (McKitrick & Nierenberg, p. 5).
Discussion
What stands out most in the results of the present study is that states with populations higher on the neuroticism dimension of the Big Five personality factors have higher cancer and heart disease mortality rates, and that there is no significant association between neuroticism and state total mortality rates, other-disease mortality rates, or non-disease mortality rates when appropriate demographic and risk factor controls are in place. These results, as anticipated, confirm the relation between neuroticism and cancer and heart disease mortality reported by Rentfrow et al. (2008). However, the present relations were found using more recent mortality rates from 2005 to 2007, additional demographic and risk control variables, and different analytic procedures.
The results also provide empirical evidence that the association with higher neuroticism is specific to cancer and heart disease mortality data, a conclusion that could not have been drawn from the Rentfrow et al. (2008) study. The results show that neuroticism is related to cancer and heart disease mortality but not to the other three broad categories of causes of death. However, they do not preclude the possibility that neuroticism might be related to other specific disease and non-disease causes of death. The results also suggest that the size and even the existence of a relation between neuroticism and total mortality perhaps are more dependent on the inclusion of cancer and heart disease deaths than previously thought.
As well, the present results demonstrate that although neuroticism is related to state cancer and heart disease mortality rates, it is not related to cancer and heart disease mortality rates in adjacent states. This conclusion was reached with partial correlations in which the four demographic variables were controlled, and in which the four demographic and the three risk variables were controlled simultaneously. The same conclusion was reached when multiple regression controlled the four demographic variables and when the β weights for neuroticism were evaluated. Furthermore, when adjacent-state cancer mortality rates were controlled along with the demographic variables in hierarchical multiple regression equations, state cancer mortality rates remained significantly associated with neuroticism. Similarly, when adjacent-state heart disease mortality rates were controlled along with the demographic variables in hierarchical multiple regression equations, state heart disease mortality rates also remained significantly associated with neuroticism.
If cancer and heart disease mortality rates are higher in geographically defined areas in which residents tend to have higher levels of neuroticism, as found in the present study, then how might these aggregate associations be fostered and maintained? A primary assumption at this time is that the state-level relations found here are dependent on processes occurring at the individual level. As stated earlier, stress and lack of capacity to manage stress are thought to be involved in cancer and heart disease onset and mortality (e.g., Baum et al., 2011; Emery et al., 2013). Therefore, it seems most plausible that core aspects of neuroticism centered on stress and stress management may be involved in key ways in the onset of at least some lethal forms of cancer and heart disease. Such processes also are assumed to make it more likely that neuroticism will increase the chances that the disease will result in premature death, or at least that the disease ultimately will be the cause of death.
Substantial progress has been made in recent years in understanding the various complex pathways through which personality may have an impact on physical health, decline and mortality. After surveying such multiple pathways of influence, Kern and Friedman (2011) concluded that personality influences the habits we form, the behaviors we engage in, the relationships we develop, our appraisals and experience of stressful challenges, the situations we commonly choose, the reactions we invoke in others, and the lifelong pathways that we follow. (p. 84)
Neuroticism may have an impact on cancer and heart disease through all of the pathways suggested by Kern and Friedman (2011) that stem from personality. For example, in regard to how personality might influence our formation of habits, higher neuroticism is associated with smoking (McCann, 2010), excessive drinking (Rush et al., 2009), and obesity (McCann, 2011). In regard to how personality might influence behaviors that we engage in, higher neuroticism is associated with passive, ineffective coping (Watson & Hubbard, 1996) and with less healthy behaviors in high stress conditions (Korotkov, 2008). In regard to how personality might influence our relationships, higher neuroticism is associated with lower quality interpersonal relationships (Kendler, Gardner, & Prescott, 2003) and poorer marital adjustment (Bouchard, Lussier, & Sabourin, 1999). In regard to how personality might influence our perceptions and experience of stressors, higher neuroticism is associated with greater perceived stress (Ebstrup, Eplov, Pisinger, & Jorgensen, 2011), with elevated reactivity and distress in response to daily stressors (Bolger & Schilling, 1991), and with more problems and stronger emotional reactions to stressors (Suls & Martin, 2005). In regard to how personality might influence the situations we choose to put ourselves in, higher neuroticism is associated with the tendency to select situations that are more likely to result in distress and adversity (Ploubidis & Frangou, 2011). In regard to how personality might influence reactions we precipitate in others, higher neuroticism is associated with heightened exposure to interpersonal stress (Carver & Connor-Smith, 2010) and interpersonal conflicts (Bolger & Schilling). Finally, in regard to how personality might influence our lifelong pathways, higher neuroticism is associated with the occurrence of stressful life events (Kendler et al.), less successful careers (Judge, Higgins, Thoresen, & Barrick, 1999), and lower work satisfaction and financial security (Roberts, Caspi, & Moffitt, 2003). Reviews of relevant past research as well as new empirical studies concerning the different impacts of personality on health and mortality could help to cast light on the processes through which neuroticism has an impact on cancer and heart disease incidence, prevalence, and mortality.
Of course, as suggested by the “ecological fallacy” (Robinson, 1950) and the “compositional fallacy” (Pettigrew, 1997), due caution should be exercised in cross-level extrapolations in this context at this time. Aggregate-level relations indeed may stem from relations with individuals as the analytical units. However, we cannot know definitively whether state-level relations between neuroticism and cancer and heart disease mortality found here actually emanate from corresponding dynamics at the individual level. In fact, we have little evidence from individual-level analyses to demonstrate that there are corresponding parallel relations at the individual level. This is largely not because there are contrary findings but because almost no research has been conducted specifically pertaining to the relation between neuroticism and cancer and heart disease mortality. It appears that only Nakaya et al. (2006) have found that higher neuroticism is associated with a greater chance of death from cancer, whereas Nakaya et al. (2010) and Shipley et al. (2007) have reported no relation. In regard to heart disease, it appears that only Shipley et al. and Murberg et al. (2001) have found that higher neuroticism is associated with a greater chance of death, but other researchers have not made a test of the potential link.
The present research is based on correlations, and that means that there is no basis on which to infer causal relations from the data analyses. Nevertheless, it is generally assumed that personality differences have some impact on health and ultimately on longevity and mortality. Although this is the direction of influence that is commonly adopted, others have suggested that illness may foster changes in personality as well. However, this contention is somewhat controversial. For example, Costa and McCrae (1987) doubted the validity of this directional effect in regard to neuroticism primarily because, over the course of life, illness clearly increases whereas neuroticism does not: “Some studies have shown that acute illness or recent diagnoses can affect state measures of anxiety or depression . . . but most individuals adapt relatively quickly to medical conditions without marked changes in personality or adjustment” (p. 306). In contrast, Kern and Friedman (2011) reached a quite different conclusion: “It is important to keep in mind such potential bidirectional influences; although personality is typically considered a stable part of the person, it can and does change in response to disease or medication” (p. 83).
It should, however, be noted that such a potential illness-to-change directional influence might have more importance in a conventional individual-level longitudinal study examining the relation of personality to illness and mortality wherein the same individuals are assessed and tracked. Bidirectional influence, if accepted, could create interpretational difficulties in that context. In fact, the longitudinal relations between personality traits, health-maintenance practices, demographic characteristics, risk factors, and mortality criteria are likely to be rather complex and to involve several interpretational hurdles. However, in the present aggregate-level cross-sectional study, the personality assessment for neuroticism is based on different samples of individuals than those actually suffering and dying from the particular category of “causes,” but the two groups are geographically clustered within the same states. Consequently, assumptions such as bidirectional influence do not present the same potential interpretational problems in this research design as in an individual-level longitudinal approach.
It also is important to understand that not having the same persons in all of the samples from which data were obtained was not detrimental in this study because the goal was to obtain state-aggregated estimates for state-level analysis. In fact, such sample incongruence was only likely to reduce the chances of finding significant relations if individual-level relations indeed are the foundation of those state-level relations. That significant state-level relations were found with variables based on somewhat different segments of the state populations further attests to the apparent robustness of those assumed underlying associations.
The present research has several strengths. For example, all of the state-aggregated variables were based on high quality data from sufficiently large and representative state samples. State age-adjusted mortality rate, demographic, and risk variables were based on official federal statistics compiled and distributed under the auspices of the U.S. Census Bureau, the CDC, and the National Cancer Institute (NCI). State-aggregated Big Five personality scores were compiled from the responses of more than 600,000 Americans to the full 44-item Big Five Inventory of John and Srivastava (1999). In addition, variables demonstrating sound psychometric properties based on state high school and undergraduate education, personal income, unemployment, poverty line, White population percent, urban percent, and female percent data from official government sources served as statistical controls. As well, the smoking, obesity, and alcohol risk variables were based on data collected through the Behavioral Risk Factor Surveillance System of the CDC during interviews conducted with more than 350,000 Americans annually.
On the other hand, the present study also has apparent limitations. One has to do with the necessarily small sample size. For example, statistical wisdom suggests that the ratio of cases to predictors was not optimal for multiple regression. Generally, smaller samples make regression coefficients less stable and limit the number of predictors that can be used because of the rapid loss of the degrees of freedom for tests of statistical significance. However, such analytical strategies with comparable and even smaller samples have been used successfully in other research (e.g., McCann, 1992, 1997, 2008, 2014). Inferential statistics provide an estimate of the degree of confidence in generalizing from a representative sample to a population. However, the tools of inference are not so fundamentally important here because the sample and the population are isometric (n = 50) or almost isometric (n = 48).
A second limitation has to do with the personality assessment instrument. Although the 44-item Big Five Inventory (John & Srivastava, 1999) has proven to be a sound and useful measure of the five traits, it is relatively brief compared with some of the alternatives such as the 240-item Revised NEO Personality Inventory (Costa & McCrae, 1995). In addition, the Big Five Inventory does not provide facet scores for each of the personality dimensions as does the Costa and McCrae assessment instrument. This is an important difference because Big Five facet scores have been found to be related to mortality variables (e.g., Jonassaint et al., 2007; Weiss & Costa, 2005) and, according to Judge, Rodell, Klinger, Simon, and Crawford (2013), “broad traits assessed with omnibus measures obscure too many facet-level differences to provide optimal estimates of the criterion-related validity of personality” (p. 891). Others also point out that further studies at the facet level could determine which aspects of neuroticism increase or decrease mortality risk (e.g., Terracciano, Lockenhoff, Zonderman, Ferrucci, & Costa, 2008; Weiss et al., 2013).
A third limitation concerns the global nature of the state cancer and heart disease mortality variables. The present results pertain to total state cancer and total state heart disease mortality rates. However, there are numerous types of cancer largely depending on where they begin in the body. These various types of cancer in turn are usually grouped into the following broader categories: leukemia, central nervous system cancers, lymphoma and myeloma, sarcoma, and carcinoma. Heart disease also includes several varieties such as coronary, congenital, inflammatory, hypertensive, organic, and pulmonary. It is possible that only some types of cancer and heart disease mortality are elevated for more neurotic persons, but this cannot be determined from the present analyses.
A fourth limitation is that the present study only examined state cancer and heart disease mortality rates. State cancer and heart disease incidence and prevalence rates are also worthy of investigation in this context. Is neuroticism similarly related to incidence, prevalence, and mortality? Some types of cancer and heart disease have lower survival rates. Disentangling the web of relations involved in neuroticism levels and incidence, prevalence, and mortality rates may shed more light on the particular underlying processes that might be involved.
There are at least five main directions for further research. (a) Perhaps more state-level research in the same vein with the exploration of other controls for other demographic and risk factors will prove beneficial from an explanatory or interpretive standpoint. (b) Additional large-scale individual-level research may be able to more conclusively establish the degree of relation between neuroticism and cancer and heart disease mortality, and thereby further elucidate the relations between neuroticism and mortality at both analytical levels. (c) Relations of neuroticism facets to cancer and heart disease mortality should be examined in state-level research. (d) Relations of neuroticism to separate categories and specific types of cancer and heart disease and their mortality rates should be studied at both the state and individual levels. (e) More costly and complex large-scale contemporary multilevel modeling procedures (e.g., Hox & Roberts, 2010) using individual-level data compiled at the state level also could be used eventually to enable the sorting out of potential individual and state effects with regard to cancer and heart disease mortality. These five future investigative thrusts center on determining whether the association between neuroticism and cancer and heart disease mortality can be better explained by individual-level or state-level dynamics, whether specific facets of neuroticism and specific types of cancer and heart disease and their mortality rates are more involved in the relations reported here, and whether neuroticism is sufficiently linked to cancer and heart disease mortality rates ultimately to be of interest for potential applications and policy decisions at the state or individual level.
Given the importance of cancer and heart disease mortality, it is rather surprising that relatively little research has been conducted regarding potential links to neuroticism. This is especially unexpected given the widespread assumption that stress and deficiencies in the management of stress are implicated with regard to cancer and heart disease onset and mortality (e.g., Baum et al., 2011; Emery et al., 2013), coupled with the fact that stress and stress management deficiencies are at the core of what it means to be high on the neuroticism dimension (John & Srivastava, 1999). The present results along with future answers provided by empirical inquiry from the perspective of “personological epidemiology” (Deary, Weiss, & Batty, 2010, p. 53) have the potential to make important contributions to what Lahey (2009) referred to as the “growing evidence that neuroticism is a psychological trait of profound public health significance” (p. 241).
Footnotes
Declaration of Conflicting Interests
The author declared no potential conflicts of interest with respect to the research, authorship, and/or publication of this article.
Funding
The author received no financial support for the research and/or authorship of this article.