
Abstract
This article describes the landscape of Sustainability Curriculum being used across the Association of Advance Collegiate Schools of Business (AACSB)–accredited schools in the United States on the basis of a non-probabilistic sample (n = 119). Using hierarchical cluster analysis, four clusters were obtained based on sustainability-related courses in management, marketing, entrepreneurship, finance, accounting, information systems/information technology, strategy, globalization, communication, and miscellaneous. Cluster 1 had uniform dispersion on sustainability courses in all business courses except marketing. Clusters 2 and 4 were the largest ones with most sustainability courses in the management area, whereas, Cluster 3 had weak, but uniform, dispersion of sustainability courses in most business disciplines. Based on their characteristics and strength of dispersion among 10 business subject areas, these were labeled as Sustainability Prominent, Sustainability Moderate, Sustainability Meek, and Sustainability Quiescent.
Introduction
The contrast between shareholder, or profitability, and stakeholders has always been an interesting crisscross in the business education environment (Ghoshal, 2005; Giacalone & Thompson, 2006). This is particularly true when it comes to teaching students that stakeholders play a secondary role in comparison with profitability intent of the businesses in educational institutions. Indeed, this trend has affected the gap between the free market orientation of MBA curricula and sustainability dimension of the curriculum associated with the operations of free markets (Carrithers & Peterson, 2006; Stubbs & Cocklin, 2008). Very often, understanding of the “worldviews that underlie different interpretations of sustainability in the context of business, to avoid this educational disconnect” is of paramount importance (Stubbs & Cocklin, 2008, p. 207). According to Giacalone and Thompson (2006), the stakeholders of business education have to emphasize educational institutions do emphasize “worldview” in the curriculum, and that would be seen as a step forward by the educational community. However, current literature demonstrates that there is a limited interest by the business education systems in sustainability and related topics (Sener & Hazer, 2008; Vachon, 2010; Young, Hwang, McDonald, & Oates, 2010).
Therefore, through this research study, the author intends to profile the landscape of sustainability curriculum via a web-based data collection and content analysis of sustainability- related curricula from a premier accreditation institution of business schools. The author has strived to provide a review of the landscape of sustainability education in management schools in the United States using a sample from the Association of Advance Collegiate Schools of Business (AACSB)–accredited schools.
Review of Literature
Because sustainability issues vary according to the attributes of nations and cultures (Enderle, 1997; Matten & Moon, 2004), there are only few survey-based studies on sustainability education from prominent institutions such as the Aspen Institute (2012) and the Higher Education Academy (2008), and scholars (Christensen, Peirce, Hartman, Hoffman, & Carrier, 2007; Evans & Marcal, 2005; Matten & Moon, 2004). These studies are more focused on the units of comparison, thus constrained in their scope. Aspen Institute’s survey on social and environmental aspects of education, although comprehensive, did not include a sizable representation of accredited schools from the United States and Canada. However, it does provide insightful and analytical details about coursework, faculty research, and institutional support primarily relating to undergraduate curriculum and face-to-face MBA programs. Evans and Marcal (2005), based on the AACSB accreditation, have deciphered the differences between teaching sustainability at the undergraduate and graduate levels. Christensen et al. (2007) provide a limited-to-global-perspective analysis of the top 50 global business schools only. Thus, a common theme emerges in all survey-based studies that various constraints for one reason or the other trigger limited school representation. The questionnaire-based research methodology of the past studies has been an effective data-collection methodology through the deans in the sustainability-based studies. The data from this type of method could possibly be influenced by the subjective views of the survey respondents. The telephone interview is a potent technique that provides better interaction with interviewees, and through such a process, authors may acquire better insights into a school and its curriculum. However, the interview method is inherently costly and time ineffective for a large scale survey. In consideration of these issues, surveys such as the Beyond Grey Pinstripes (BGP) study selected schools to voluntarily participate in online questionnaires. Despite the efficiencies gained, however, online questionnaires are easily susceptible to respondent bias, as only schools with better performance have an incentive to participate. Therefore, we used a web-based data collection and content analysis as an indispensable alternative to mitigate the weakness of questionnaire research on one side and the resource constraints of interviews on the other, because the selection process is non-discriminatory and the information is available publicly. We thus decided a web-based data collection and content analysis as a method for the quantitative cluster analysis for profiling sustainability curriculum landscape.
Method and Research Design
Our research undertaking represents an attempt to compare curriculum between business schools from different sized schools and degree granting status. The author analyzed how these accredited business schools from various regions in the United States offered sustainability-related courses in their curricula as a reflection of these two attributes of schools.
Proposed Framework
A diagrammatic representation of the research framework pertaining to the landscape of sustainability in AACSB-accredited schools’ curricula is presented in Figure 1. Using course titles, various sustainability courses were classified into 10 categories as per their association to the academic discipline areas—management, marketing, entrepreneurship, finance, accounting, information systems/information technology, strategy, globalization, communication, and miscellaneous. Based on the patterns of number of sustainability courses, possibility of categorization into clusters was explored. The impact of the size, type, and mission of the institution relationship between clusters was studied.

Proposed framework.
Research Questions and Hypotheses
The following research questions were investigated in the study:
Research Question 2 is an extensive one and was not addressed by a literature review alone (as Research Question 1) but by a full-fledged empirical cycle. The cycle involved setting up research hypotheses and conducting a statistical analysis-based data collection from the AACSB International’s website.
Hypotheses
The difference between clusters with regard to the mission of the schools was studied based on qualitative in-depth analysis of the mission posted on schools’ websites.
Data Analysis
Two types of data were collected from the AACSB’s official website. The first types of data were demographic characteristics of business schools—name, type, and degree granting status (undergraduate, master, or doctoral). The second types of data were collected about the courses being offered in different academic business disciplines as well as business-related sustainability courses.
Data analysis was carried out in three parts: descriptive statistics, relevant hypotheses testing using non-parametric statistical tests, cluster analysis, and Kruskal–Wallis ANOVA. Sustainability-related courses within each cluster were analyzed and based on their numerical characteristics in each cluster; these were named as Sustainability Prominent, Sustainability Moderate, Sustainability Meek, and Sustainability Quiescent.
To compare the ranked mean scores on clusters and school size and degree granting status, Kruskal–Wallis Test was conducted. Hypotheses were tested to determine whether there was any difference in schools’ characteristics (size and degree granting status) among four Clusters: Sustainability Prominent, Sustainability Moderate, Sustainability Meek, and Sustainability Quiescent.
Results
Cluster Analysis
The hierarchical cluster analysis was carried out to identify homogeneous groups of cases based on sustainability-related courses being offered in the AACSB-accredited schools. In hierarchical clustering, the algorithm used starts with each case in a separate cluster and iteratively combines until all cases are in one cluster. The prevalent SPSS Ward Method was used for clustering. Cluster membership is assessed by calculating the total sum of squared deviations from the mean of a cluster. The criterion for fusion is that it should produce the smallest possible increase in the error sum of squares. The process continues until all cases are grouped into one large cluster. Each case is associated in a rescaled distance cluster combine. A single solution consisting of four clusters was obtained that included all 119 cases. The Dendrogram provided information about the magnitude of differences between clusters at each step of the process.
Clusters and Dispersion of Sustainability Courses
The scores were computed for each of the four clusters: Sustainability Prominent, Sustainability Moderate, Sustainability Meek, and Sustainability Quiescent. Table 1 and Figure 2 represent scores in a 4 by 10 table.
Distribution of Sustainability Courses.

Note. Based on the cluster dispersion for the clustering variables (sustainability courses), the clusters were labeled. Cluster 1, Sustainability Quiescent, has the second lowest total number sustainability courses. Cluster 2, Sustainability Prominent, has the highest total number sustainability courses whereas Cluster 3, Sustainability Meek, has the lowest total number sustainability courses. Cluster 4, Sustainability Moderate, has the second highest total number sustainability courses. IS/IT = Information System/Information Technology.

Sustainability cluster characteristics.
Additional Characteristics of Clusters
Cross-tabulation: Clusters and school size
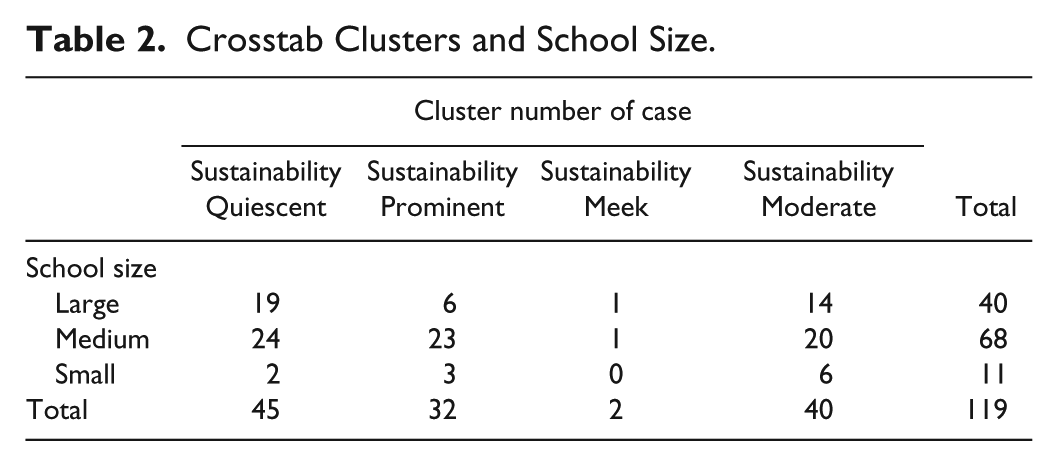
Cross-tabulation of clusters and school type (see Table 2) reveals that the medium size schools have the highest numbers followed by large and small size schools. In addition, Sustainability Quiescent is the largest cluster followed by Sustainability Moderate, Sustainability Prominent, and Sustainability Meek.
Crosstab Clusters and School Size.
Cross-tabulation: Clusters and school type
Cross-tabulation of clusters and school size (see Table 3) reveals that the master’s degree granting schools have the highest numbers followed by doctoral and undergraduate degree granting schools. In addition, Sustainability Quiescent is the largest cluster followed by Sustainability Moderate, Sustainability Prominent, and Sustainability Meek.
Crosstab Clusters and School Type.

Kruskal–Wallis ANOVA of Clusters and Sustainability-Related Courses
A Kruskal–Wallis Test was conducted to compare the ranked mean scores on clusters and sustainability-related courses in 10 categories. Four clusters were identified as the category variable and 10 sustainability course categories as dependent variable. The ranks are presented in Table 4. Statistics from the Kruskal–Wallis Test are presented for each of the sustainability-related courses in 10 categories and clusters in Table 5.
Mean Ranks of Sustainability Clusters.

Note. IS/IT = Information System/Information Technology.
Kruskal–Wallis Test Statistics.

Note. Grouping variable: cluster number of case.
Hypotheses
Clusters and sustainability-related courses H0
There is no difference in sustainability-related courses in management, marketing, entrepreneurship, finance, accounting, information systems/information technology, strategy, globalization, communication, and miscellaneous, and four clusters: Sustainability Prominent, Sustainability Moderate, Sustainability Meek, and Sustainability Quiescent.
The Kruskal–Wallis Test was used to test differences in mean preferences for the sustainability-related courses, resulting in higher significance level values .156 (finance), .990 (accounting), .755 (communication), and .120 (miscellaneous), which are greater than .05. Based on this test, the differences among clusters with regard to the rest of the sustainability-related courses are not statistically significant. Therefore, null hypothesis was not rejected for sustainability-related courses to management, marketing, entrepreneurship, information system/information technology, strategy, and globalization. The SPSS output is presented in Table 5.
Clusters and school’s characteristics—size and degree granting status
There is no difference in schools’ characteristics—size and degree granting status—among four Clusters: Sustainability Prominent, Sustainability Moderate, Sustainability Meek, and Sustainability Quiescent.
The Kruskal–Wallis Test revealed (Table 6) that there is a difference in the mean ranks in school types and nature of degree granting institutions with regard to the four clusters (Sustainability Prominent, Sustainability Moderate, Sustainability Meek, and Sustainability Quiescent).
Mean Rank and Kruskal–Wallis Test Statistics.

Note. Grouping variable: cluster number of case.
Discussion
Kruskal–Wallis ANOVA of Clusters and Sustainability-Related Courses
The Kruskal–Wallis ANOVA (see Table 5) shows that the differences in mean preferences for the sustainability-related courses resulting in higher significance level values .156 (finance), .990 (accounting), .755 (communication), and .120 (miscellaneous), which are greater than .05, could be due to the school’s characteristics, for example, size, degree grating status, and so on. Based on this test, the differences among clusters with regard to the rest of the sustainability-related courses are not statistically significant. According to Kruskal–Wallis ANOVA of clusters (see Table 6), there was a difference in school’s characteristics—size and degree granting status—among four Clusters: Sustainability Prominent, Sustainability Moderate, Sustainability Meek, and Sustainability Quiescent. It is possible that size and degree of granting status of AACSB schools influence the extent of sustainability course dispersion in the business curriculum. There is very limited literature to date to inform about the role of school characteristics in the design of sustainability curriculum. However, there could be more factors associated with the school’s characteristics such as vision and mission and leadership of the business school that influence curriculum and program design.
Conclusion
This research is one of the first studies profiling sustainability in AACSB business schools. The results of the study have suggested that there is, largely, a non-significant difference between sustainability-related courses in management, marketing, entrepreneurship, Information Systems/Information Technology, strategy, and globalization, and four clusters: Sustainability Prominent, Sustainability Moderate, Sustainability Meek, and Sustainability Quiescent. Perhaps findings indicate that there is no differentiation among a large number of courses with regard to sustainability clusters in the sample.
There are several opportunities for future research and limitations of the current research. Having a larger sample size in the study is important because using a significance test with small sample size makes it less likely to detect significant effect. Therefore, replication studies should be conducted with large number of AACSB schools with additional variables, such as vision and mission, to increase the power of results.
Footnotes
Declaration of Conflicting Interests
The author(s) declared no potential conflicts of interest with respect to the research, authorship, and/or publication of this article.
Funding
The author(s) received no financial support for the research and/or authorship of this article.