
Abstract
The purpose of this study is to comparatively investigate the science teaching curricula in Turkey, which have undergone changes four times since the millennium. For this purpose, we carried out a technical and taxonomic examination of the learning outcomes listed in the science curricula that were introduced in 2000, 2005, 2013, and 2017 concerning Revised Bloom Taxonomy (RBT). In this study, the document analysis method was used. We classified a total of 2,613 learning outcomes in our analyses, which were limited to those related to the cognitive domain. The reliability score of the classifications was .89 according to the equation proposed by Miles and Huberman. The analyses showed that the teaching curricula decreased the intensity of the focus on knowledge and cognitive skills rather than making fundamental changes. Moreover, there was significant parallelism among the examined curricula in terms of the dimensions of the taxonomy. Using national-level results in international exams such as PISA (Programme for International Student Assessment) and TIMSS (Trends in International Mathematics and Science Study), we concluded that Turkey had not been successful enough in developing the examined curricula.
Introduction
As a consequence of globalization, countries compete with one another to be able to provide better education and training to their citizens so that they do not fall behind in their cooperation and competition with other countries and they become more successful and possess the necessary technology (Ayas, 1995). Developed and developing countries along with the countries that are aware of this competition frequently review their education systems and make various arrangements accordingly. As a result, new teaching curricula as well as new methods and techniques, based on scientific studies, are being introduced. It is possible to argue that the science curricula of several countries are based on a dynamic process and have a dynamic structure, just like any other curricula. We can claim that the science curriculum in Turkey also has this kind of structure changing in accordance with the needs.
Turkey gained European Union (EU) candidate status in 1999 and initiated the negotiation process in 2005. The harmonization process between Turkey and the EU has been continuing to be conducted through negotiation chapters, the 26th of which is on “Education and Culture.” This chapter consists of the expectations from Turkey regarding the steps that need to be taken to achieve common objectives with other countries. In this sense, Turkey has primarily declared that it shares the educational and cultural objectives and priorities of the EU. In addition, the country has taken significant steps toward the goals of the union regarding Strategy and Education and Training 2020; the EU 2020 work program and actively participated in EU-level work platforms (Ministry for EU Affairs, 2017).
In this process, Turkey is expected to train individuals with higher level skills and qualifications and high employability and who are highly innovative and active, as it is also expected from other countries. From the moment it gained the status of a candidate country, Turkey has conducted more intensive studies. Although these studies under the heading of education and culture undoubtedly require the investigation of different phenomena and developments, this article has focussed on what was done in the field of science teaching on the basis of teaching curricula.
The EU countries plan their education and teaching policies at the national level. It is reported in the EU cooperation, specifically the education and training framework (ET 2020) (URL-1), that the objective is to urge member/candidate countries to work in cooperation with and learn from each other, to adapt to the information society through qualified education and teaching, and to contribute to the development of national economies. Also, following the call by the researchers for international studies to be conducted on different countries’ curriculum standards (Bümen, 2006; Edwards, 2010; Liang & Yuan, 2008), this article focused on the content related to cognitive learning outcomes listed in the science curricula in Turkey where the curricula were revised several times after the acquisition of candidate country status. Questioning the quality of the implemented teaching curricula in training, the qualification of individual mentioned above can provide significant gains first for the country and then for the EU in achieving their common goals.
This study is also significant as Turkey is in the process of membership of the EU with mismatches of educational attainment that learners throughout the educational system experience in terms of EU Standards. Assessing and mapping curriculum standards may provide a tool for identifying deficiencies, especially for Turkey, according to EU standards. Moreover, it may assess and be attribute to the grounds of Turkey’s poor results in international tests such as TIMSS.
The studies on standards of curricula measure the mapping between a state’s standards and objectives. Thus, these studies are important, and this will give the possibility of improvement by changing the standards. In this sense, examining the revisions made in science education in Turkey will not only provide information on the specific case of the country but also will contribute to the future experience of countries with similar features.
An Overview of the Education System in Turkey
The main authority in education in Turkey is the Ministry of National Education (MNE). The country is composed of provinces divided into counties for administrative purposes and the MNE has offices in all provinces and counties. The offices in provinces and counties carry out relevant work and procedures for the implementation of the MNE’s decisions taken in the capital. All the basic and strategic decisions (e.g., staff recruitment, curriculum issues, construction of new school buildings, etc.) are taken at the MNE’s headquarters in Ankara despite the efforts to delegate the central authority to provincial directorates.
Eight years of primary and secondary education and 4 years of high-school education are compulsory for all in the country and are provided for free in public schools. As the population of the country approached 80 million in 2017, according to the latest statistics, the number of children in primary school was 5,360,703 (net schooling ratio of 94.87%), the number of children in secondary school was 5,211,506 (net schooling ratio of 94.39%), and the number of children in high-school was 5,807,643 (net schooling ratio of 79.79%). Science teaching curricula, which are the focus of this study, are implemented in all primary (in Grades 3 and 4) and secondary schools (in Grades 5–8) in the country.
The history of the teaching curricula in Turkey indicates that studies have been conducted on subject areas since the proclamation of the Republic. Ünal et al. (2004) identified four stages of development in science teaching curricula: (a) the period until the Alphabet Reform (1923–1928); (b) the period until the 1960s (1928–1960); (c) the period of Modernization (1960–1984), and (d) Comprehensive Curriculum Development Period (1984– . . .). It is possible to claim that every stage is indeed related to the development of the country. However, this classification needs to be updated. The aim of the teaching curriculum introduced in 2000 was to catch up with the era emphasizing a transformation with the millennium. In our opinion, the fourth stage mentioned above should end in 1999 and the period covering the year 2000 and later should be considered as the Modern Curriculum Period (5th stage). This is because the curricula implemented during this period were developed after the Catching up with the Era in the 2000 education project conducted by the MNE and as part of the negotiations on the EU chapter on “Education and Culture.” During this period, curriculum changes were made four times in 2000, 2005, 2013, and 2017.
In Turkey, the overall assessment regarding the outcomes of the implemented science curricula in the fifth stage can be criticized due to the results of international examinations such as TIMMS (Trends in International Mathematics and Science Study) and PISA (Programme for International Student Assessment). This is also considered to be among the reasons for curriculum changes. Within the context of this study, we aimed at addressing the need for a comparative study of the curricula designed and implemented after 2000 to explore the qualifications of the science curricula. So, the focus of this study is to comparatively examine the type of cognitive learning dimensions and knowledge dimensions that are prioritized in the science curricula during the Modern Curriculum Period.
In his study, Edwards (2010) analyzed the core physics curriculum of South African and proposed to study the cognitive complexity in the field of knowledge in other curricula as another research area outside the scope of his study. Wagner (2008) puts forward that individuals need to have more depth of skills to give meaning to the global information economy that requires also higher order cognitive skills. In this manner, all curriculum should enable skills development. To determine this, for example, for a curriculum, Stanny (2016) suggested that Revised Bloom Taxonomy (here after RBT) is effective in classifying thinking skills in a hierarchy that ranges from lower level cognitive skills through higher order cognitive skills. Lee et al. (2015) examined the primary science curricula used in Korea and Singapore using RBT to find out the general features of the cognitive demands and levels of knowledge required from learners. In their article, the researchers provided useful insights into the complexities of the science curriculum with the results between two similar yet different educational systems. That means curriculum analysis results might be a bridge between different cultures as well. FitzPatrick and Schulz (2015) studied the cognitive levels of the curriculum outcomes and their cognitive alignment with the assessment activities that corresponded with these outcomes. They found out that the curriculum outcomes included a variety of higher and lower thinking skills, and highlighted that the top alignment between curriculum outcomes and assessment activities increases learners’ chance to learn and become well thinkers. It is, therefore, worthwhile to examine the cognitive features of science curriculum output that can be the basis for the applications such as evaluation and teaching activities of teachers. To achieve this, we adopted RBT, which is a widely used instrument for curriculum research (Ari, 2011; Porter, 2006). There has also been another significant tool in the related literature, namely the structure of observed learning outcomes (SOLO) taxonomy. However, it is mostly used to comprehend cognitive development among children (Biggs, 1995), and thus, using it to assess the outcomes of children’s cognitive development in class is more appropriate, rather than analyzing cognitive features of output in the curriculum (Brabrand & Dahl, 2009).
The Aim of the Study
When Turkey’s application for EU membership, Turkey’s economic development, and Turkey’s education standards are taken into consideration, there is a need to examine teaching programs in Turkey the comparatively. This research is noteworthy to determine the level of achieving the declared vision and missions of the standards in the curricula. The present study aimed at identifying which knowledge and cognitive learning areas were given priorities in revised science curricula after the millennium in Turkey. The findings will provide an opportunity to present the types of knowledge and cognitive levels that the whole programs offer to students, and to understand the developments in this issue. Thus, the strengths and weaknesses will be seen and an opportunity will be obtained for the necessary arrangements for the Modern Curriculum Period mentioned above.
Theoretical Framework
A learning outcome is a statement of an objective target of the curriculum. It portrays knowledge, skills, and values that learners should gain by the end of the further training. To understand what a learner may know and be able to demonstrate at the end of a school process, the outcomes of a curriculum may investigate. Bloom’s Taxonomy, proposed initially in 1956, constituted the basis of this study to investigate the curricula. The criticisms made on the taxonomy and the deficiencies determined according to the current teaching methods required some changes and updates. As a result, the taxonomy was revised by field-specialist psychologists, educational theorists, and instructional researchers led by Anderson & Krathwohl and renamed as “A taxonomy for learning, teaching and assessing: A revision of Bloom’s taxonomy of educational objectives” (Anderson & Krathwohl, 2001). Edwards (2010) argued that the revised Bloom’s taxonomy (RBT) moved away from the restrictive hierarchical structure of the old taxonomy. Thus, we believe that assessing and mapping curriculum standards by using RBT might also allow for increased cognitive complexity to improve teaching outcomes. In fact, this revision encouraged educators to focus on the taxonomy again (e.g., Amorim et al., 2014; Jideani & Jideani, 2012; Karaali, 2015; Kocakaya & Kotluk, 2016; Nkhoma et al., 2017; Upahi & Jimoh, 2016; Van Niekerk & Von Solms, 2009). Anderson and Krathwohl (2001) mentioned two reasons for the update in the study they published: (a) the refocusing of the attention of educators and (b) a lot of changes in knowledge and thinking. Unlike the first taxonomy, the revised taxonomy was made two-dimensional by adding “Knowledge Dimension” (Zimmerman & Schunk, 2003). In this sense, the noun phrase in the outcomes of the curriculum defines “Knowledge Dimension” and the verb phrase defines “Cognitive Process Dimension” (Anderson & Krathwohl, 2001; Krathwohl, 2002). The new taxonomy, which is thus created in two dimensions, examines the outcome statements in the curriculum in two dimensions. In other words, according to RBT, an outcome should address the knowledge and cognitive process dimensions. Each dimension also has subdimensions. The stages of the taxonomy for both dimensions are presented in the appendix.
Methodology of Research
This study adopts document analysis as an analytical research method as it comprises a systematic and critical investigation, rather than a pure description, of the curricula introduced by MNE in 2000, 2005, 2013, and 2017. Document analysis is the process of collecting information and documents related to the research topic and examining them using codes that represent specific rules or systems, and it is used in qualitative research as an analytical method to gain an understanding of the trends emerging from the data (Çepni, 2014; Cohen et al., 2007). Document analysis is the analysis of written, visual, and other similar materials that include knowledge relevant to the phenomenon under study. Creswell and Plano Clark (2007) have highlighted that the researcher has to ascertain the source of data that will best respond to the research question by taking into account what types of data are potential. Analyses made through document analysis have potentiality in terms of time, convenience, and cost-effectiveness; therefore, it enables researchers to classify and gain all the works in the related area according to certain qualities (Cohen et al., 2007). No new knowledge or discovery is expected as a result of the document analysis. However, it can help the orientations, different viewpoints, and opinions related to the subject become clearer. Thus, the qualities that are not directly visible to users/readers can be observed/reviewed.
In this study, to analyze the core knowledge and cognitive levels of the curriculum by employing the revised Bloom’s taxonomy (RBT) which includes the cognitive level categories, namely “remember, understand, apply, analyse, evaluate and create.” Similar studies concerning the RBT and document analysis have been carried out by various researchers (e.g., Bümen, 2006; Edwards, 2010; Kocakaya & Kotluk, 2016; Liang & Yuan, 2008). The documents reviewed in this study were the Science Teaching Curricula published by the MNE in 2000, 2005, 2013, and 2017. The curriculum in 2000 covers Grades 4 to 8, 2005 covers Grades 4 to 8, 2013 covers Grades 3 to 8, and 2017 covers Grades 3 to 8.
Data Analysis
This study focuses on identifying and comparing the types of cognitive learning dimensions and knowledge dimensions of the curricula. It is not considered to determine the adequacy of the cognitive learning dimensions and the proportions of knowledge dimensions. Because the adequacy of the dimensions may change with the specific seasonal expectations of the country. So, it may not be right to talk about a standard for the ratio of cognitive learning dimensions and knowledge dimensions of the learning outcomes. Rather, the adequacy of curriculum acquisition to reflect the curriculum’s own vision and mission and in terms of the standards set for 21st-century learners (see American Association of School Librarians [AASL], 2009; Darling-Hammond, 2006; Dweck, 2009) can be explored and considered in this study. Therefore, the analysis in this article is limited to identifying and comparing the types of cognitive learning dimensions and knowledge dimensions of the curricula for the Modern Curriculum Period in Turkey.
For the analysis, first, as the RBT classification relates only to the cognitive and knowledge processes, the outcomes related to the “Affective Area” in the curricula were identified and left out of the evaluation based on the views of two field experts. The outcomes in the curriculum consisted mainly of the name of a particular subject area and a noun and a verb that expressed what could be done with this content. The verb phrases in the outcomes were examined in terms of the six dimensions of cognitive processes (remembering, understanding, applying, analyzing, evaluating, and creating) and their subdimensions (see the appendix). When the learning outcomes were examined, it was seen that some outcome statements included expressions (acts) that indicated more than one activity/process/action. For this reason, the analyses were carried out by considering all the statements that expressed activity/process/action in the outcomes. The noun phrase in the outcomes was examined in terms of four dimensions (factual, conceptual, procedural, meta-cognitive) of the knowledge dimension and its subdimensions.
It is clear that the classification of specific outcomes under a given cognitive subdomain may be subjective, and there is a considerable possibility of misclassification. Therefore, expert views by two researchers in the faculty of education and criteria/methods of similar studies (e.g., Bümen, 2006; Edwards, 2010; Kocakaya & Kotluk, 2016) were used to classify the outcomes into the different cognitive levels to facilitate the coding process. Final classifications were determined by discussions between the authors.
The expert opinions were referred to on controversial issues to ensure the reliability of the analyses. The analysis of this study was compared with the analysis of the expert based on the reliability formula proposed by Miles and Huberman (1994). The formula is given below.

To this end, the experts examined 40 randomly selected outcomes from each curriculum (160 outcomes in total). Accordingly, the correspondence between the codes of the experts and the researchers was determined as 89%. This procedure is similar to approaches used in other studies (Bümen, 2006; FitzPatrick & Schulz, 2015; Martone & Sireci, 2009). According to Miles and Huberman (1994), a score of over 70% indicates that the findings are reliable. That is, the agreement between the researchers and the expert is in the acceptable range of proportions. Moreover, since this study was produced from the first author’s PhD thesis, the results were also checked and approved by the members of the progress review panel by two different researchers working in a different education faculty. So, the reliability of the results can be claimed to be high.
Analysis Examples
An outcome in the eighth-grade curriculum in 2013 says “Solves problems related to heat exchange.” The noun phrase that covers the knowledge dimension in this outcome and the verb phrase that covers the cognitive process dimension were identified as follows.
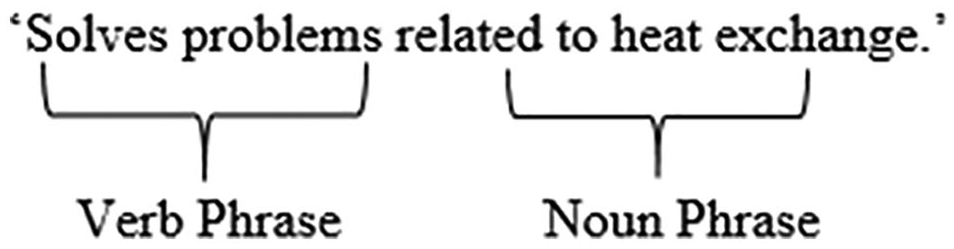
Since the statement of “Problems related to heat exchange” require a formulaic procedure, it falls under “knowledge of the specific skills and algorithms of the subject,” a subdimension of procedural knowledge. The verb phrase of “solves” in the outcome also requires a formulaic procedure, which corresponds to the subdimension of “executing” that falls into an apply dimension in the cognitive process dimensions.
As another example, we may examine the outcome of “Makes an electromagnet and finds the poles looking at the direction of current flow” in the eight-grade teaching curriculum in 2005, which includes more than one noun and verb phrase. This outcome should be read as “Makes an electromagnet” and “Finds the poles of the electromagnet looking at the direction of current flow.” Therefore, it is clear that this outcome has more than one goal.

It is understood that, based on its definition that says “an electromagnet is a solenoid coil with an iron bar,” which requires electric current, wire, and a conductor to create this simple structure, pupils must fall into “knowledge of theories, models, and structures,” a subdimension of conceptual knowledge. The verb phrase consists of “makes,” which corresponds to “executing,” a subdimension of applying in the cognitive process. The second target, which is separated in the outcome, is “the poles of the electromagnet,” the noun phrase in “Finds the poles of the electromagnet looking at the direction of current flow.” It is obvious that as this statement includes “looking at the direction of current flow,” which is a specific technique in terms of knowledge accumulation, it corresponds to the “knowledge of subject-specific techniques and methods,” a subdimension of procedural knowledge. The verb phrase is “finds” and is associated with “implementing,” a subdimension of “apply” in cognitive process dimensions.
Findings
Within the scope of this study, we identified 737 outcomes in the teaching curriculum introduced in 2000, 1,057 outcomes in 2005 one, 481 outcomes in 2013 one, and 338 outcomes in 2017 one, and made the analyses accordingly.
The Comparison of the Outcomes in Terms of Cognitive Process Dimensions
The distribution of the outcomes in the curricula examined according to the cognitive process dimension is as follows: The distribution of outcomes in the 2000 curriculum was 0.14% for remember, 76.66% for understand, 16.69% for apply, 3.12% for analyze, 3.12% for evaluate, and 0.27% for create. In the 2005 curriculum, this was 3.88% for remember, 58.09% for understand, 17.69% for apply, 10.97% for analyze, 1.89% for evaluate, and 7.47% for create. The 2013 curriculum outcomes were found to be 7.48% for remember, 39.92% for understand, 22.04% for apply, 14.35% for analyze, 9.98% for evaluate, and 6.24% for create. In the 2017 curriculum, it was 4.44% for remember, 50% for understand, 19.53% for apply, 8.88% for analyze, 6.8% for evaluate, and 10.36% for create. The overall distributions of the outcomes according to the cognitive process dimension are presented in Figure 1.
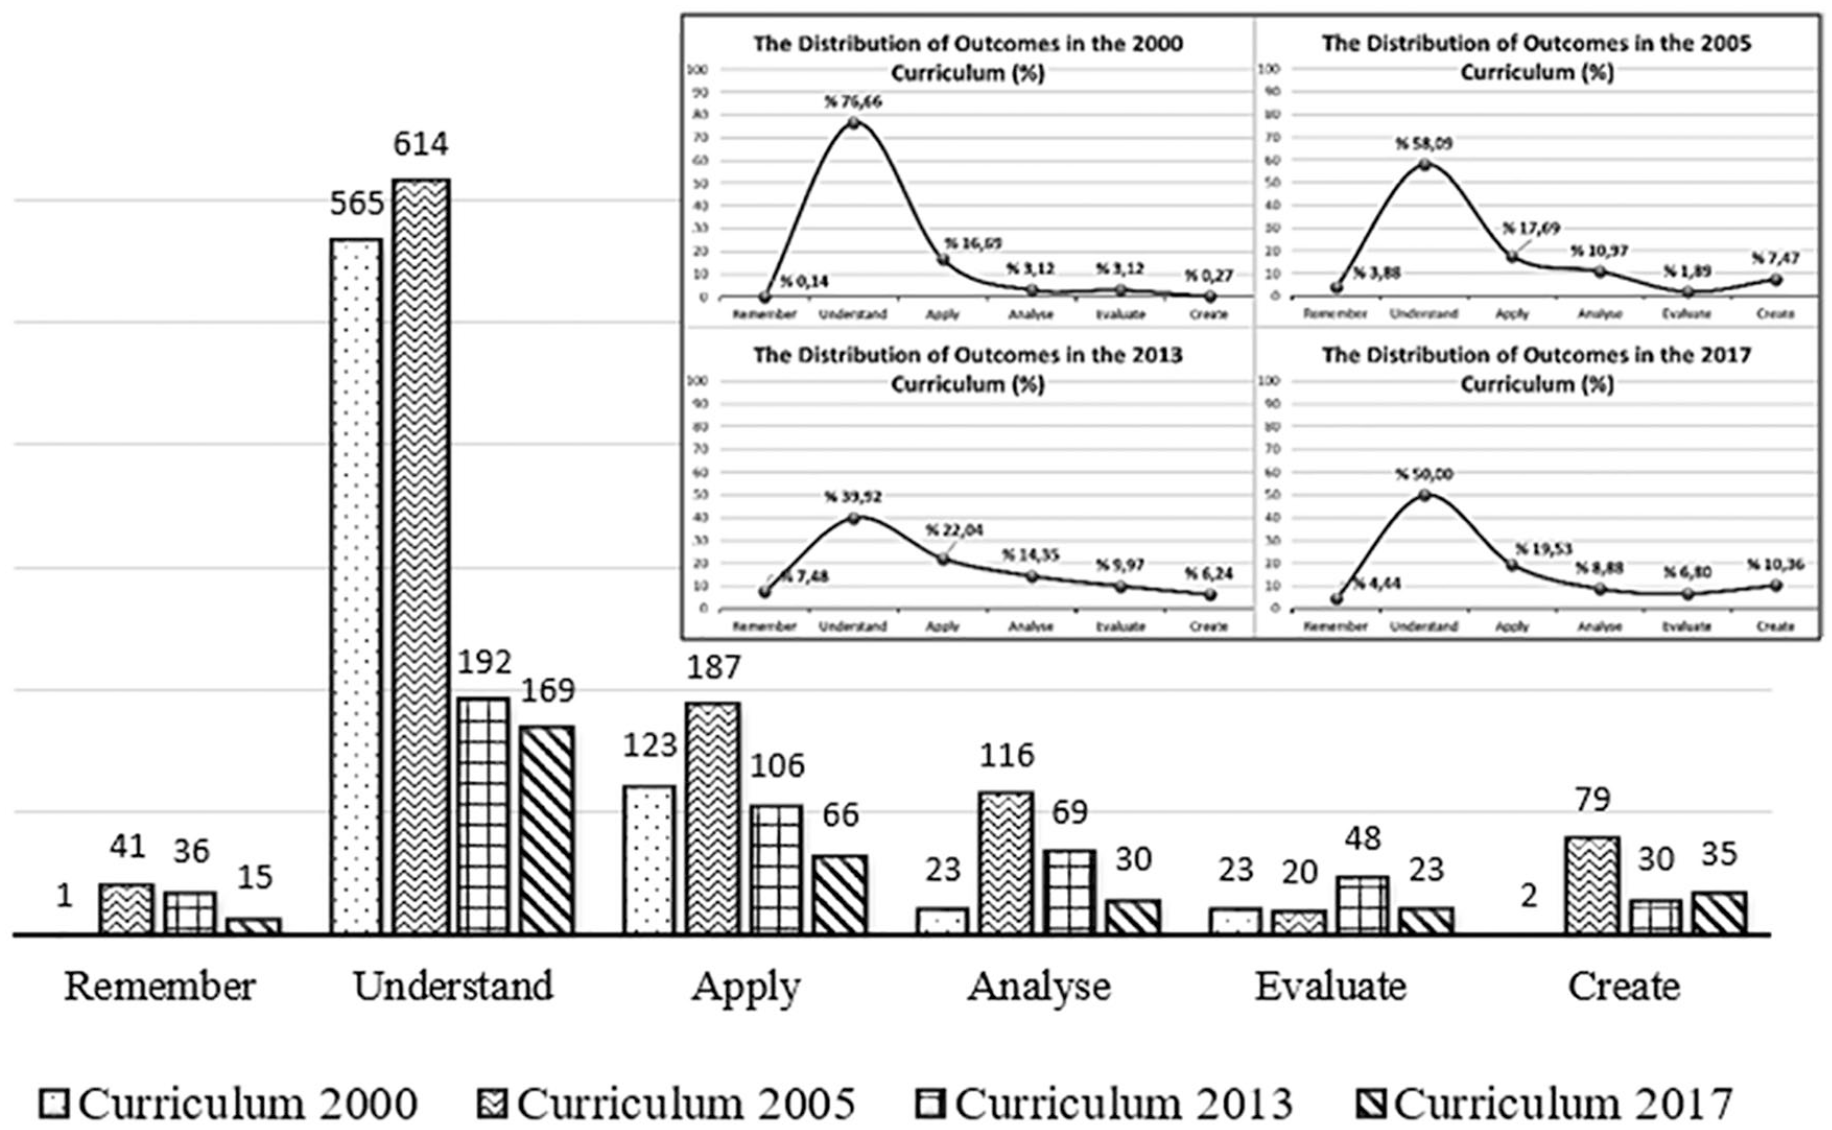
The frequency (f) and percentage (%) distribution of cognitive process dimensions according to the teaching curricula.
When the cognitive dimensions of the outcomes of the Science Curricula in 2000, 2005, 2013, and 2017 were examined (see Figure 1), there was approximate parallelism between the 2005 curriculum and the 2013 curriculum in the remember dimension. The weight of cognitive processes in the 2000 curriculum was lower than in other curricula. The reduction in the number of outcomes in this dimension was also striking in the 2017 curriculum. Looking at the understand dimension, the number of outcomes in 2000 and 2005 curricula and the number of the outcomes in 2013 and 2017 curricula were close to each other. Starting with the 2013 curriculum, it was clear that the difference in the number of outcomes was too large to be ignored. It is noteworthy that the 2005 curriculum gave more weight in the apply dimension than the other curricula and the number of outcomes decreased toward the 2017 curriculum. Considering the dimension of analyze, it is seen that the 2005 curriculum had the greatest number of outcomes, followed by the curricula in 2013, 2017, and 2000, respectively. In the dimension of evaluate, the number of outcomes in the 2013 curriculum was significantly higher than the other curricula, and the curricula in 2000, 2005, and 2017 were parallel to each other. Looking at the dimension of create, it is seen that the number of outcomes in the 2005 curriculum was significantly higher than that of other curricula whereas the number of outcomes in the 2000 curriculum was considerably low. The 2013 curriculum and the 2017 curriculum were similar in terms of the number of outcomes.
The distribution of the outcomes in the curricula examined according to the subdimensions of the taxonomy is presented in Figure 2.

The frequency (f) distribution of cognitive process dimensions and subdimensions according to the teaching curricula.
According to Figure 2, in the 2000 curriculum, the rate of recognizing was 0% whereas the rate of recalling was 0.14%. Both recognize and recall are subdimensions of remember dimension. In the subdimensions of understand dimension, this rate was 0.41% for interpreting, 17.64% for exemplifying, 2.99% for classifying, 0% for summarizing, 10.31% for inferring, 3.53% for comparing, and 41.79% for explaining. In the subdimensions of apply dimension, there was a rate of 11.8% for executing and 4.88% for implementing. Looking at the subdimensions of analyze dimension, there is a rate of 2.44% for differentiating, 0.41% for organizing, and 0.27% for attributing. In the subdimensions of evaluate dimension, the rate is 1.63% for checking and 1.49% for critiquing. In the subdimensions of create dimension, the rate of generating was 0.14%, planning was 0.14%, and producing was 0%. In the remember dimension in the 2005 curriculum, the rate was 2.93% for recognizing and 0.95% for recalling. In the subdimensions of understand dimension, this rate was 1.80% for interpreting, 7.38% for exemplifying, 3.41% for classifying, 0.47% for summarizing, 17.31% for inferring, 5.11% for comparing, and 22.61% for explaining. In the subdimensions of apply dimension, there was a rate of 6.53% for executing and 11.16% for implementing. Looking at the subdimensions of analyze dimension, there was a rate of 7.57% for differentiating, 1.89% for organizing and 1.51% for attributing. In the subdimensions of evaluate dimension, the rate was 1.14% for checking and 0.76% for critiquing. In the subdimensions of create dimension, the rate of generating was 3.69%, planning was 2.65% and producing was 1.14%. In the remember dimension in the 2013 curriculum, the rate was 5.82% for recognizing and 1.66% for recalling. In the subdimensions of understand dimension, this rate was 1.25% for interpreting, 6.24% for exemplifying, 3.95% for classifying, 0.21% for summarizing, 7.90% for inferring, 4.99% for comparing, and 15.38% for explaining. In the subdimensions of apply dimension, there was a rate of 5.82% for executing and 16.22% for implementing. Looking at the subdimensions of analyze dimension, there is a rate of 8.52% for differentiating, 3.74% for organizing, and 2.08% for attributing. In the subdimensions of evaluation dimension, the rate is 6.86% for checking and 3.12% for critiquing. In the subdimensions of create dimension, the rate of generating was 3.12%, planning was 1.46% and producing was 1.66%. In the remember dimension in the 2017 curriculum, the rate was 4.14% for recognizing and 0.3% for recalling. In the subdimensions of understand dimension, this rate was 1.18% for interpreting, 5.03% for exemplifying, 4.73% for classifying, 0.3% for summarizing, 9.17% for inferring, 6.51% for comparing, and 23.08% for explaining. In the subdimensions of apply dimension, there was a rate of 11.54% for executing and 7.99% for implementing. Looking at the subdimensions of analyze dimension, there was a rate of 5.03% for differentiating, 3.55% for organizing, and 0.3% for attributing. In the subdimensions of create dimension, the rate of generating was 8.88%, planning was 1.48%, and producing was 0%. In the subdimensions of create dimension, the rate of generating was 8.88%, planning was 1.48%, and producing was 0%.
As can be seen in Figure 2, 2005, 2013, and 2017 curricula had parallels with each other for remember dimension and they showed a significant increase in comparison with the 2000 curriculum. This increase was particularly obvious in recognizing subdimension. Although there was a decrease in understand dimension starting from the 2000 curriculum, its rate increased again with the 2017 curriculum. Inferring subdimension remarkably increased in the 2005 curriculum. The 2013 curriculum and the 2017 curriculum were similar in this dimension. The increase in the 2005 curriculum in comparing, classifying, and interpreting subdimensions was striking. There was an overall parallelism in apply dimension. Considering the subdimensions, there was a decrease in executing and an increase in implementing. Compared with the 2000 curriculum, analyze dimension increased in the 2005 and 2013 curricula and decreased in the 2017 curriculum. In the evaluate dimension, while there was a similarity between the outcomes of the 2000 and 2005 curricula, there were a greater number of outcomes in the 2013 and 2017 curricula for both subdimensions. The 2017 curriculum was clearly on the forefront for create dimension, and the 2013 and 2005 curricula were parallel to each other with a greater proportion of outcomes compared with the 2000 curriculum.
The Comparison of the Outcomes in Terms of the Knowledge Accumulation Dimension
The distribution of the outcomes of the curricula examined according to the knowledge accumulation dimensions is as follows: The rates of the outcomes in the 2000 curriculum were 24.97% for Factual Knowledge, 66.08% for Conceptual Knowledge, 8.82% for Procedural Knowledge, and 0.14% for Meta-Cognitive Knowledge. In the 2005 curriculum, this rate was 11.54% for Factual Knowledge, 61.12% for Conceptual Knowledge, 26.68% for Procedural Knowledge, and 0.66% for Meta-Cognitive Knowledge. In the 2013 curriculum, the rate of Factual Information was 18.09%, Conceptual Knowledge was 63.41%, Procedural Information was 15.80%, and Meta-Cognitive Information was 2.70%. In the 2017 curriculum, the rate Factual Knowledge was found as 13.61%, Conceptual Knowledge as 53.55%, Procedural Knowledge as 20.41%, and Meta-Cognitive Knowledge as 12.43%. A comparative analysis of the distribution of outcomes according to their knowledge accumulation dimensions is given in Figure 3.

The frequency (f) and percentage (%) distribution of knowledge dimensions according to the teaching curricula.
According to Figure 3, in terms of the knowledge dimensions, the factual information dimension had a declining trend over the years. In terms of conceptual knowledge, the 2005 curriculum had a significant surplus compared with other curricula, followed by the curricula in 2000, 2013, and 2017 respectively. When the procedural dimension was taken into consideration, the 2005 curriculum stood out with a considerable number of outcomes and 2017, 2013, and 2000 curricula were parallel to each other. Regarding the dimension of meta-cognitive knowledge, the number of outcomes increased year by year. The increase in the outcomes regarding meta-cognitive knowledge in the 2017 curriculum was noteworthy. The comparative distribution of the outcomes in the curricula examined according to the subdimensions of knowledge accumulation taxonomy is given in Figure 4.

The frequency (f) distribution of the knowledge dimension according to the teaching curricula.
According to Figure 4, the following ratios were found when the distribution of the outcomes regarding knowledge accumulation to its subdimensions was examined: In the 2000 curriculum, the distribution to the subdimensions of Factual Knowledge was 6.11% for knowledge of terminology (KT) and 18.8% for knowledge of specific details and elements (KSDE). The distribution in the Conceptual Knowledge subdimension was 18.72% for knowledge of classifications and categories (KCC), 6.65% for knowledge of principles and generalizations (KPG), and 40.71% for knowledge of theories, models, and structures (KTMS). In Procedural Information subdimensions, the rate was 4.61% for knowledge of subject-specific skills and algorithms (KSSSA), 4.07% for knowledge of subject-specific techniques and methods (KSSTM), and 0.14% for knowledge of criteria for determining when to use appropriate procedures (KAP). In the subdimensions constituting Meta-Cognitive Knowledge, there was only strategic knowledge (SK) with a rate of 0.14%. In the 2005 curriculum, the distribution of the subdimensions of Factual Knowledge was 2.84% for KT and 8.70% for KSDE. The distribution in the Conceptual Knowledge subdimension was 24.79% for KCC, 7.85% for KPG, and 28.48% for KTMS. In Procedural Information subdimensions, the rate was 5.20% for KSSSA, 17.03% for KSSTM, and 4.45% for KAP. In the subdimensions constituting Meta-Cognitive Knowledge, the rate of SK was 0.14% and 0.09% for knowledge about cognitive tasks, including appropriate contextual and conditional knowledge (KACT). In the 2005 curriculum, the distribution of the subdimensions of Factual Knowledge was 8.52% for KT and 9.56% for KSDE. The distribution in the subdimensions of Conceptual Knowledge was 21.41% for KCC, 14.97% for KPG, and 27.03% for KTMS. In Procedural Knowledge subdimensions, the rate was 2.49% for KSSSA, 9.77% for KSSTM, and 3.53% for KAP. In the subdimensions constituting Meta-Cognitive Knowledge, the rate of SK was 2.29%, and it was 0.42% for KACT.
In Figure 4, it is seen that in the factual knowledge dimension, KSDE subdimension had a decrease starting from the 2000 curriculum although it was still higher than KT subdimension. It was observed that the number of KT-related outcomes was parallel in the three curricula (2000, 2005, and 2013). It was seen that in the conceptual knowledge dimension, the biggest rate belonged to KTMS in the 2005 curriculum. In procedural knowledge dimension, KSSTM gained intensity and the curricula in 2000, 2013, and 2017 were parallel to each other in this regard. A similar increase in the 2005 curriculum was worth attention. In the meta-cognitive knowledge dimension, an increase was observed in the number of outcomes related to strategic knowledge, despite being in a limited number.
Discussion
When the findings were reviewed, the numbers of outcomes in the four examined curricula differed, but it is possible to say that the distributions of cognitive dimensions in the taxonomy generally showed a similarity. It should be noted that the line graphs presented in Figure 1 formed a similar polynomial curve. According to Figure 2, the skills that came to the fore in the cognitive processes of understanding and applying were explaining, inferring, exemplifying, and implementing. The outstanding cognitive skills in the curricula might not be enough to reflect the vision and mission of the curricula due to its own highlighted statements. In all of the curricula, it was seen that there was a greater focus on cognitive skills such as research, critical thinking, gaining knowledge, making conclusions, generating new knowledge, and making informed decisions. Rather, as mentioned above, the focus in the curricula was on understanding and applying cognitive processes. That is, in terms of the RBT, the curricula were organized with lower level cognitive skills in general. The standards set for 21st-century learners include the ability of individuals to “(i) research, think critically and acquire information; (ii) draw conclusions, make informed decisions, apply knowledge to new situations and produce new information, (iii) share knowledge and (iv) have the competence to work to achieve personal and aesthetic development” (AASL, 2009; Darling-Hammond, 2006; Dweck, 2009). The ostensible cognitive skills in the curricula of the Modern Curriculum Period and the standards set for 21st-century learners do not coincide. It may be stated that there is a need for outcomes that serve higher cognitive skills.
Regarding the distribution of the knowledge dimension in the taxonomy, there was a general similarity between factual and conceptual knowledge in terms of the distribution ratios. On the other hand, it can be said that conceptual knowledge was more prominent in the 2005 and 2017 curricula. Meta-cognitive knowledge appeared to be more prevalent in the 2017 curriculum than in the other curricula. It is also noteworthy that in recent curricula there has been a tendency to reduce the number of outcomes related to factual and conceptual knowledge. It is considered that there is a need for generations that can make evaluations in the context of more commonly encountered contexts and conditions and act strategically, and, in this sense, we suggest that meta-cognitive knowledge should be prioritized in curricula. Similarly, Bağcı Kılıç et al. (2008) emphasized the inadequacy of the dimension of science as a way of knowing in the 2005 curriculum and suggested that the outcomes that teach the ways of accessing information should have a bigger part. Gömleksiz and Bulut (2007) stated that the 2005 curriculum had a lot of outcomes and that the curriculum should give teachers the opportunity to reflect current developments in their teaching. Karatay et al. (2013) emphasized that the 2013 curriculum included fewer outcomes than the 2005 curriculum, which would increase the number of teaching hours per outcome and thus allow teachers to gain an advantage for more effective teaching. Considering similar criticism, the MNE (2018) reported that the number of outcomes was further reduced in the 2017 science curriculum.
The extent to which the science curriculum in Turkey is adequate to provide learners with skills that are expected of 21st-century individuals is still under question. That is because the proportion of cognitive skills in the outcomes is notably low. This case is an indication that there is a vicious debate, in other words, an attempt to change, in this area in Turkey. When the distribution ratios of the cognitive dimensions in the curricula are reviewed, the fact that there is no notable change and the change often remains at the frequency level appears as a condition that needs to be critiqued. The ideal solution would be to place more focus on the cognitive outcomes that will enable future generations to develop the skills of analysis, synthesis, evaluation, and creation—higher cognitive skills—reflecting the qualities expected of them.
Among the knowledge subdimensions, the curricula focus more on “knowledge of Classifications and Categories” and “knowledge of Theories, Models and Structures.” These findings overlap with those found for the cognitive process dimensions in the taxonomy. Accordingly, the science curriculum in Turkey aims to provide the new generations primarily with the skill of understanding and applying the knowledge related to classifications, categories, and theories, models, and structure. So, it was realized in Turkey that “science” has a higher position than “knowing about science,” which is in line with findings of the European Commission (Eurydice) report for the year 2011. This is a trend and this trend of science teaching curricula can be meaningful considering the age group addressed. However, considering the pace of production and increase of knowledge in the 21st century, it can be claimed that the lifespan of knowledge related to classifications, categories, and theories, models, and structure is short for individuals. In other words, within the scope of these analyses, there were four attempts aimed at changing the science teaching curricula in post-millennium Turkey, but this resulted in the reduction of the intensity of focus on knowledge and cognitive skills. This situation is also depicted in different studies conducted in Turkey (e.g., Karatay et al., 2013; Yücel & Özkan, 2013).
The adequacy of the curriculum in Turkey, as mentioned above, is discussed in concert with the results of international tests such as PISA and TIMSS (MNE, 2018). TIMSS is an international exam, held every 4 years, students in Grades 4 and 8 and evaluates their scientific knowledge and skills. TIMSS, in a broad sense, aims to compare the student performances in participating countries and evaluate the differences between education systems. The IEA (International Association for the Evaluation of Educational Achievement) report on the TIMSS administrations in 2007, 2011, and 2015 indicate that Turkey’s grade point average in science is under the TIMSS average in all administrations (MNE, 2011, 2014a, 2014b, 2015, 2017, 2018). The results were similar in the PISA exam scores. PISA examinations assess skills such as reasoning, using knowledge and skills in situations that may be encountered in real life and whether the students are aware of the opportunities that the scientific competencies acquired at school can create (Anıl, 2009). Although this exam does not question the extent to which the subjects covered in the school curriculum are learned, the knowledge and skills gained at school are the determinants of the results of this exam. The results of Turkey, which has participated in PISA since 2003, on the science literacy test and their comparison with the average of all participating countries and the average of Organisation for Economic Co-Operation and Development (OECD) countries are given in Figure 5.
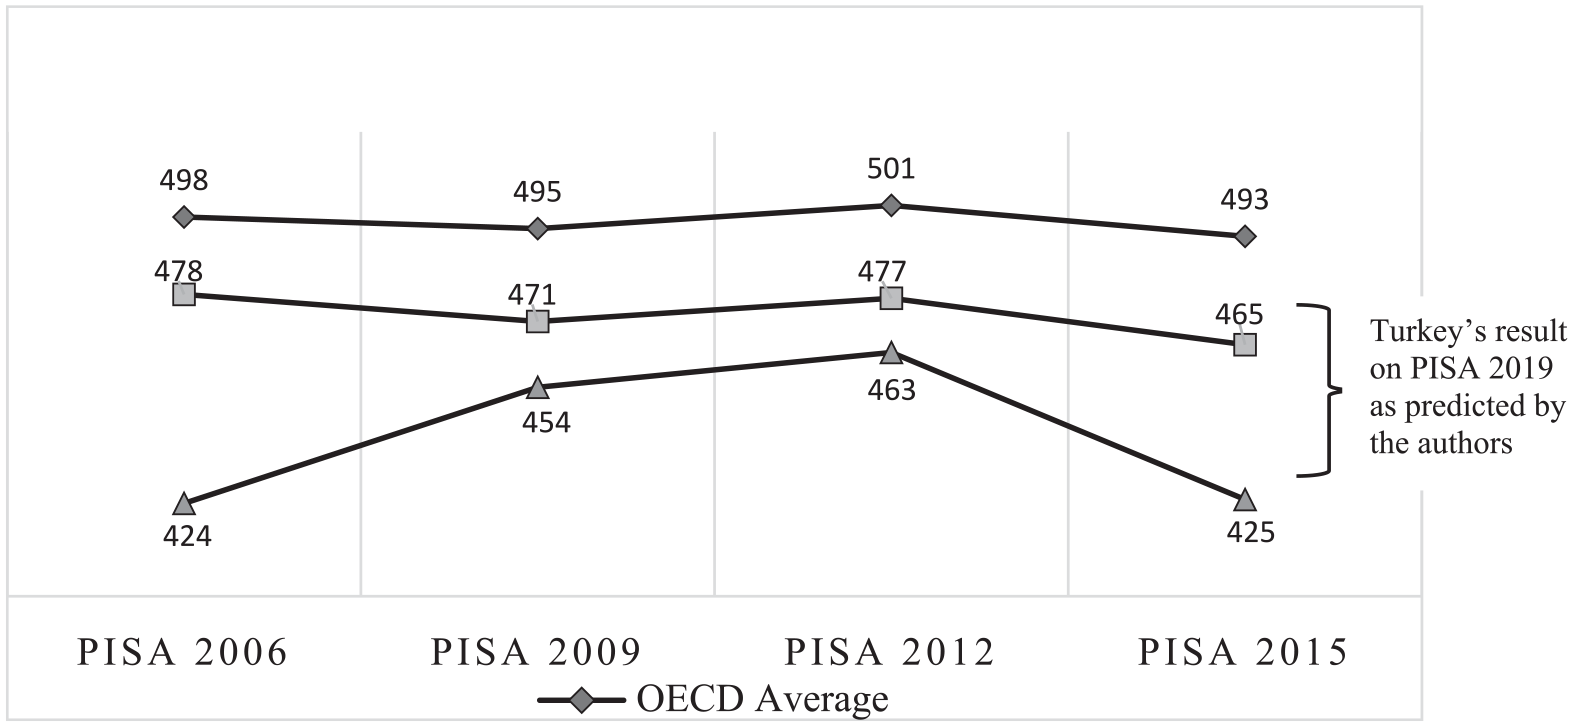
PISA average scores in science literacy by years.
Based on the data in Figure 5, when the reflections of the curricula implemented in Turkey are compared with the results from other countries, it is possible to argue that none of the four curricula were adequate. The reason for this may be that there was not a real reform in the curriculum changes. The predicted range and the current situation in Turkey are below the currents results of countries such as Belgium, the Czech Republic, Denmark, Poland, and Hungary. The Council of the EU aims to reduce the low achievement rate of 15-year-olds in science to less than 15% by 2020 (Eurydice, 2017). The extent to which the science teaching curricula in Turkey changed and the results of those changes should be fundamentally examined. Of course, the critiques in this study regarding Turkey are limited to the analysis included in the study. It should be noted that these comparison studies have performed a grand role in stating critical factors, and have been a potential to some extent to reorganize the current standards-based science education in the United States and many other countries (Liu et al., 2009).
The current state of Turkey regarding science curriculum must be considered within the context that requires countries that are a member/candidate of EU Cooperation in Education and Training to learn from each other (ET 2020) (Ministry for EU Affairs, 2017) and the necessary lessons should be taken by other countries, particularly the EU countries with PISA results similar to Turkey in science education such as Bulgaria, Greece, Malta, and Romania. It is proposed that education policymakers should consider the studies related to curriculum evaluation, comparison, and development in the literature in the regulation and renewal of education and training.
There are huge gaps inherent in the cognitive and knowledge dimensions in terms of the 21st-century standards in the four curricula. The cognitive and knowledge dimensions in the curriculum themselves should be clear and have a balanced weighting across cognitive levels. If this situation obtains, then we can have a reasonable expectation from learners to get good results in (international) exams, and we can talk about the high potential of the curriculum to train the learners in terms of the 21st century. Considering that there were no significant differences in terms of cognitive dimensions in the curricula examined, it will not be surprising that the students who will learn with the updated curriculum in 2017 will have a PISA score again below the average of other countries. Due to similar characteristics among the teaching curricula, our prediction range for Turkey’s result on PISA 2019 is below the average of all participant countries, as can be seen in Figure 5.
Conclusion
The purpose of this study was to make a comparative analysis of the science curricula implemented in the Modern Curriculum Period (fifth stage) of Turkey. In this sense, the outcomes in the curriculum were analyzed according to the cognitive and knowledge dimensions, on the basis of the RBT. In all curricula, understand and apply dimensions were prominent. Based on this, it is possible to argue that the priority in science teaching curricula in Turkey is for individuals to understand and apply knowledge.
Finally, as a result of the analyses made according to the RBT, there is a right-skewed distribution in Figures 1 to 4, which was obtained in terms of cognitive and knowledge dimensions of the taxonomy. We concluded that, regarding the cognitive and knowledge dimensions of the taxonomy, results that are more skewed to the left side of the figure would be more useful for Turkey, seeking membership in the EU, in achieving the qualifications required in the 21st-century individuals. In this way, it will be possible to acquire the opportunity to raise more qualified individuals in terms of having multiple viewpoints and prioritizing critical and creative thinking.
Footnotes
Appendix
Revised Bloom’s Taxonomy Table.

| The knowledge dimension |
||||||||||||
|---|---|---|---|---|---|---|---|---|---|---|---|---|
| The cognitive process dimension | Factual knowledge |
Conceptual knowledge |
Procedural knowledge |
Meta-cognitive knowledge |
||||||||
| KT | KSDE | KCC | KPG | KTMS | KSSSA | KSSTM | KAP | SK | KACT | SEK | ||
| Remember | Recognizing | |||||||||||
| Recalling | ||||||||||||
| Understand | Interpreting | |||||||||||
| Exemplifying | ||||||||||||
| Classifying | ||||||||||||
| Summarizing | ||||||||||||
| Inferring | ||||||||||||
| Comparing | ||||||||||||
| Explaining | ||||||||||||
| Apply | Executing | |||||||||||
| Implementing | ||||||||||||
| Analyze | Differentiating | |||||||||||
| Organizing | ||||||||||||
| Attributing | ||||||||||||
| Evaluate | Checking | |||||||||||
| Critiquing | ||||||||||||
| Create | Generating | |||||||||||
| Planning | ||||||||||||
| Producing | ||||||||||||
Note. KT = knowledge of terminology; KSDE = knowledge of specific details and elements; KCC = knowledge of classifications and categories; KPG = knowledge of principles and generalizations; KTMS = knowledge of theories, models, and structures; KSSSA = knowledge of subject-specific skills and algorithms; KSSTM = knowledge of subject-specific techniques and methods; KAP = knowledge of criteria for determining when to use appropriate procedures; SK = strategic knowledge; KACT = knowledge about cognitive tasks, including appropriate contextual and conditional knowledge; SEK = self-knowledge.
Declaration of Conflicting Interests
The author(s) declared no potential conflicts of interest with respect to the research, authorship, and/or publication of this article.
Funding
The author(s) received no financial support for the research, authorship, and/or publication of this article.