
Abstract
A key change agent role is to help clients understand the systems to which they belong to improve performance. A major challenge is how to facilitate this understanding. Typically, the change agent collects the data and provides an interpretation about its significance for the client organization. This approach, however, often meets with resistance. What is needed is an approach that engages the author of the data in its interpretation and this article introduces just such an approach—PathMAP®. A case study is used to introduce PathMAP® and show how it can be used to engage system agents in a rigorous process of data interpretation leading to an increased understanding of the variables that influence system dynamics and of how to engage the system in change. This article will demonstrate how PathMAP® enables change agents to get an accurate picture of the current state of an organization by identifying the key issues facing the organization and their interrelationship, and using this knowledge to create meaningful action plans that make deep and intuitive sense to organization’s members.
Keywords
Introduction
Business as Usual
A key change agent role is to help clients understand the systems to which they belong to help them improve some aspects of individual, process, and/or organizational performance. A major challenge is how to facilitate this understanding. A typical strategy is to collect data and then provide some kind of interpretation as to its meaning and significance for the client organization. Every change agent knows that while it is easy to interpret data, it is much more difficult to get the client to own the interpretation and to act on it. This is due, in part, because the author of the data (system agents) and the reader (the change agent) live in different worlds and come to different conclusions about the underlying meaning of a set of data.
A Better Way
This is where PathMAP® comes into play. PathMAP® is an interpretation strategy by which the authors of the data and the reader of the data share a common language about what the data mean because they are both members of the same system for a brief time. PathMAP® is a process for engaging agents within a system in the process of data interpretation. What follows is a case study describing how this was done. The purposes of the case study are to
Introduce readers to PathMAP®.
Show how it can be used to engage diverse groups in interpreting survey data.
Demonstrate that the results of a PathMAP® are an increased understanding of the variables that influence system dynamics, an increased appreciation of how they interact, and an increased understanding of how to change the system.
PathMAP® enables the change agent to get an accurate picture of the current state of an organization, as seen by system agents, by identifying the key issues facing the organization, understanding their interrelationship, and using this knowledge to create meaningful action plans, plans that make deep and intuitive sense to the organization’s members. The system influence mapping process of PathMAP® is
Fast—It enables you to rapidly identify and address the actual root cause of an issue and create a sustainable action plan in less time than traditional methods.
Flexible—It can be used to examine a plethora of issues in a highly interactive process that engages the system.
Effective—It’s a powerful and cost-effective tool that can be tailored to the needs of the system.
Context of the Case Study
Background
The system depicted in this study is a large organization that had been relatively unchanged for decades. Following a series of financial setbacks, there was a mandate for creating a more effective transparent, employee-oriented organizational culture. This mandate led to large-scale changes in the organization and its leadership. A number of initiatives were undertaken to transform the organization including one to realign the organization around a new set of values. Senior leadership team felt it was appropriate to survey the organization to find out what employees felt and to gather their opinions on how things were working.
To accomplish this, a census survey was undertaken to benchmark the current organization and identify indicators to track goal-oriented progress. To design the employee survey, a series of employee interviews were conducted, the analysis of which enabled the research team to identify a number of variables for assessment, including confidence in senior leadership, degree of transparency, valuing employees, empowerment and participation, relationship with supervisor, teamwork, and measures of satisfaction and commitment. Items to assess each of these variables were developed and the resulting survey was then administered to employees via the Internet. Two weeks after data were collected, a preliminary report was provided to senior management and following this presentation, interactive feedback sessions were commenced.
Findings of the Survey
Quantitative analysis of the survey data revealed a number of interesting yet contradictory findings. First, employees indicated they were highly committed to the organization, were proud to be a part of it, and wanted to remain employees for the foreseeable future. However, survey results also indicated a number of potentially threatening issues held by employees:
There was little confidence in senior management.
There was little trust for those in leadership roles.
It was perceived the organization did not genuinely care for or value its employees.
There was very little openness.
HR systems were rated unfavorably, especially related to pay and compensation, performance management, and due process.
While employees reported they were highly committed to the organization, they also felt as if they were not valued by the organization. In short, employees felt victimized and underappreciated. Because the data were so unfavorable in most respects, the research team used PathMAP® as a means of engaging employees in a nonthreatening, open environment for the purpose of interpreting the data. To better understand why PathMAP® was used as it serves as a great tool for clarifying the underlying causes of these issues. Following is a brief discussion of the theories underlying PathMAP®.
Organizations as Phenomenological Systems
PathMAP® is a systems approach to a kind of qualitative research called “grounded theory” which has three major characteristics:
It is a phenomenological approach, meaning that it represents a phenomenon from the perspective of those experiencing the phenomenon (the emic viewpoint), rather than from some external or imposed perspective (the etic viewpoint). In this particular case, the employees of the organization were asked to become active participants in the interpretation of their own survey data, in contrast to the more traditional approach of the external observer or researcher who conducted the survey determining the meaning of the data.
PathMAP® representation is based on systems theory, which means that phenomena as perceived by a particular constituency are represented as systems. These phenomenological systems, like all systems, have two components: Elements: a group of closely related constructs that can be given a single name. Relationships Among Elements: the perceived patterns of influence or causation.
Consequently, the phenomenon can be represented as a system map that shows how the various elements of the system are connected, in the minds of a constituency, in a pattern of influence. This representation creates a number of different interpretive possibilities, the most important of which are as follows: An understanding of the relative “importance” of the system elements, depending on their placement within the system map and how they are interconnected to other elements. An opportunity to ask “what if” questions that can lead directly to implications and suggestions for improvement. These questions are of four kinds:
Prospective: We can describe the existing states of the drivers of the system (elements that determine the states of all or most of the other elements of the system) and determine the likely effects on the outcomes (elements whose states are largely determined by other elements within the system).
Retrospective: We can describe a hypothetical desirable set of outcomes and “work backwards” through the system map to determine what set of preconditions the system must obtain to reach the desirable state.
Internal dynamics: We can examine the internal dynamics of the system, typically in terms of the effects of feedback loops (recursive cycles of influence among a set of elements in which a change in the state of one element creates a cycle, usually self-reinforcing), to better understand, for example, how changes in one element may “rebound” throughout the entire system in often surprising ways.
External dynamics: We can examine the effects of hypothetical elements external to the system; for example, “At what juncture in the system or what would be the resulting internal dynamics if a class-action lawsuit were filed by the customers of the organization?”
Furthermore, PathMAP® is a process by which a constituency (a group of people who are similar in distance from and power over a situation and therefore may be presumed to have a relatively homogeneous understanding of the situation) defines their own collective understanding of a phenomenon as a system consisting of clusters of meaning and relationships among those clusters.
Four major theoretical streams of thought inform the PathMAP® research process (Northcutt & McCoy, 2004):
Grounded Theory. The purpose of grounded theory (Glaser & Strauss, 1967) is essentially the classical empirical task of inferring patterns or regularities (a theory) from a mass of observations. The theory thus induced is not a grand metanarrative that makes claims about how humans make meaning regardless of context, but is more modest in its goals in that it is fairly highly constrained by the contextual limits of the observations themselves.
Phenomenology. Phenomenology is usually attributed to Edmund Husserl (1859-1938), but also has a significant intellectual provenance going back to Emmanual Kant (1724-1804), who first argued that the structure of the mind (consciousness) determined to a significant degree the nature of reality itself. Husserl, following Kant’s lead, advocated that the proper focus of philosophy ought to be phenomenological in the Kantian sense, which led to a major movement in psychology that emphasizes the subjective experience, rather than the experience as interpreted or understood by an external observer.
Systems Theory. The “father” of systems theory is generally recognized to be Karl Ludwig von Bertalanffy (1969). PathMAP®, while not subscribing to many of the implications of von Bertalanffy’s theorizing about biological systems, is certainly one example of many applications of his ideas to social systems in that PathMAP® represents social phenomena as systems consisting of elements and relationships among these elements; furthermore, these relationships are neither random nor willy-nilly, but are systemic, meaning that they follow a consistent internal logic or structure.
Hermeneutics. The classical hermeneutical model that was refined into its highest form by the Scholastics of the high Middle Ages provides the intellectual foundation for the entire PathMAP® research process (Dietz, 2010). The tripartite hermeneutical model of author–text–reader is used as a metaphor and a guide for the research process itself.
PathMAP® and Hermeneutics
While the concepts implied by systems theory and phenomenology are widely familiar, the appearance of “hermeneutics,” traditionally reserved for religious texts, may be a surprise. We use the term in its wider sense of interpreting any text at all, whether the “text” be a book, an interview, or a set of observations. In other words, all human activity that involves symbolic exchange is grist for the hermeneutic mill.
How does this hermeneutical process apply to PathMAP®? Taking the word text literally, the hermeneutical model, which is a three element system consisting of the text, the author, and the reader, raises the following issues or questions.
What is the intent of the author; or alternatively, is the intent of the author even a legitimate concern?
Does the text “speak for itself”?
What, if anything, does the reader bring to the hermeneutical task? Is the reader simply a mechanical “recorder” of the text, in which case all readers would be expected to derive the same meaning from the same text? Or is the meaning of the text entirely dependent on the reader’s subjective reaction to it? Furthermore, as the reader has no immediate access to the writer’s consciousness or intent, what part does authorial intent play in the model?
These questions have been debated for decades and no doubt will continue to be points of contention. Different “schools” of literary criticism and of social “science” inquiry clearly tend to privilege one apex of the hermeneutical triangle over another (Figure 1). This article is not the place for a detailed examination of how different disciplines of social inquiry privilege either the author, the text, or the reader, but it is important to understand how PathMAP® uses the hermeneutical model as a metaphor, and how PathMAP® recognizes that each of the three apexes should be emphasized or privileged, depending on the stage of development of the research study.

The hermeneutical arc and PathMAP®.
First, the “author” is not the researcher; rather, the author is the person or group that the researcher is “studying”; that is, the researcher’s job is to understand the meaning of a phenomenon in the terms of the “subjects” of the study. As the researcher has no direct access to the consciousness of the subjects, she or he must depend on some kind of “text,” whether the text comprises interviews, focus groups, surveys, or any of the variety of ways that social researchers “gather data.”
The researcher is the hermeneutical reader; the “subjects of the study” are the authors, and the text is whatever means the researcher uses to make inferences about the meaning of the phenomenon to the subjects. Once understood in this way, a conclusion seems to emerge quickly: It is not a matter of choosing which of the three apexes to privilege; rather, an effective research methodology must privilege the appropriate element at the appropriate stage of the research project in such a way as to achieve some kind of balance. PathMAP® achieves this balance in the following way:
Research Design. The earliest phase of research, that of deciding just what will be the subject of inquiry, must of necessity privilege the “reader” (the researcher). It is the researcher who decides to conduct the project and process being used in the first place.
Data “Collection” or Observation. This phase, if the purpose of the study is to represent the emic dimension of a phenomenon, must of necessity privilege the author (the subjects).
Analysis or Data Aggregation. This stage should privilege the “text” (the data). This objective accomplished by making a clear distinction between analysis and interpretation, a distinction that is made clear by ensuring that, to the greatest extent possible, analysis is deductive and rule- or algorithm-driven.
Interpretation privileges first the reader—after all, it is the obligation of the researcher to tell an audience what she or he thinks the study means—and then the “author,” in that the subjects can and should be brought back into the study to help create and interpret what their own mind map means—a participatory praxis.
PathMAP® is structured to recursively privilege each of the three apexes of the hermeneutical triangle in a systematic way under the assumption that doing so will provide the most credible and robust description and interpretation of the phenomenon. Indeed, the application of PathMAP® methodology to the organization is an example of how robust the methodology is.
Overview of the PathMAP® Process
Figure 2 shows the structure of a typical PathMAP® study. A short discussion of the steps in this diagram is given, followed by a description of how the process was adapted for the present study.

PathMAP® research system.
PathMAP® studies begin with a focus group in which the group brainstorms their reactions to an issue statement or some general stimulus (in the case of the organization, this was the results of the employee survey). The results of the brainstorming session are invariably a large number of thoughts. Members of the group, with the researchers acting as neutral facilitators, engage in three kinds of “coding” or synthesis/analysis of the data represented by the cards:
“Open” coding which results in a categorization of the author’s thoughts. The major point here is that the authors are creating their own categories, rather than a set of categories being imposed by a third party.
“Axial” coding (Glaser & Strauss, 1967), the purpose of which is to clarify and to define the range of meaning for each of the elements.
“Theoretical” coding, after all affinities are identified, the facilitator queries the author group about their perception of the influences among all affinities. This is worthy of note because (a) this level of coding is typically missing from many qualitative studies, (b) theoretical codes are the source material for transforming a simple laundry list of affinities into a true system, and (c) once again, the judgments of relationships are made by the authors, not the reader.
In a more robust PathMAP® study, the list of system elements provides the structure for an interview protocol in which individual members of the constituency are interviewed to provide more in-depth understanding of the phenomenon (represented in the right-hand track of Figure 2). The present study used only the focus group track. After the focus group has completed the element production and an analysis of relationships among all possible pairwise elements, PathMAP® provides a formal set of protocols or algorithms that are used to analyze the system relationships. These protocols are strictly deductive and the implication is that once a set of theoretical codes has been produced, different researchers will produce the same system. By separating analysis from interpretation, IQA eliminates a common source of confusion in qualitative studies. The final product of a PathMAP® study is a system map. The map represents the elements and their relationships as a coherent system, starting with drivers and ending with outcomes from which conclusions and implications are drawn.
Using the PathMAP® Approach
Feedback sessions were designed such that the participants in each group were relatively homogeneous with respect to status.
Process
Data presentation
The data presented below reflect the output from eight PathMAP® group sessions. Each group had 12 to 15 participants and each session was run according to a prearranged script. First, the facilitator welcomed participants and discussed the aims and ground rules for the session. The rules included, confidentiality of the discussion, no talking during brainstorming and clustering, and freedom to move the cards at will. These rules were strictly reinforced during the feedback sessions. Second, a summary of the group and the overall survey data were presented. This presentation highlighted the 10 most and least favorably rated items for the location as well as the scores for each factor measured by the survey. If a given location had any score that was significantly higher or lower than the overall score for that factor and/or item, these scores were highlighted and discussed. This was done to show that some of the results were specific to a given location and some were more systemic in nature.
Issue identification
After answering any questions about the data, participants were asked to silently think about the following question: “What are the issues that produced the survey results we have just presented?” The group then engaged in a silent brainstorming process during which they wrote their thoughts and feelings on post-it note cards, one thought/feeling per card. These cards were collected and posted by the facilitator on a large white board. Each group generated an average of 15 cards per participant. For this study, these cards provided the narrative for understanding the meaning and effectiveness of each element.
Clustering and naming
Following the brainstorm, participants silently clustered the issue cards into affinities, groups of cards believed to have the same underlying meaning. Participants could move cards about ad libitum until there was agreement regarding the particular group into which a given card was placed. Once all the cards were clustered, each cluster was discussed. This discussion was led by a volunteer from the group. The result of this discussion provided each group of cards (an element) with a unique label. The label captured the underlying meaning of each element.
Establishing the relationships among elements
After the naming was done (Table 1) the facilitator led the group in a pairwise assessment of the relationship among the elements during which participants had to decide which element caused the other.
Elements of the Organizational System as Perceived by Constituents.

Note. The numbering of affinities is strictly nominal. No ranking is implied. The importance of affinities will be discussed in the context of the system as a whole.
Valencing
After the naming exercise, participants were asked to evaluate the quality of each element of the system as positive, neutral, or negative.
Analysis of Data
Step 1: Construction of the interrelationship table (IRT)
To facilitate construction of the system map, the judgments of the relationships among system elements are summarized in an Interrelationship Table (IRT) as shown in Table 2. This table has been sorted horizontally in descending order from drivers to outcomes. Each of the elements is listed in column 1, its relative rank is shown in column 2, and the column labeled Δ reflects the difference between the number of “in” arrows subtracted from the number of “out” arrows (no. of outs − no. of ins = Δ). The element with the greatest number of “outs” is called the primary driver, the one with the next most a secondary driver, and so on. The box with the greatest number of “ins” is called the primary outcome and the box with the next most number of ins is called a secondary outcome, and so on. A given element can be a driver, an outcome, or both. Drivers and outcomes can further be deconstructed into primary, secondary, tertiary, and so on depending on their relative position in the chain of influence.
Sorted IRT for the Eight Focus Groups.

Note. IRT = Interrelationship Table.
Step 2: Construction of the system map
The data from the IRT were used to construct the system map as shown in Figure 3.

Systems Influence Diagram representing interpreted survey data.
Using the rules of simplification, the pattern of relationships is reduced in complexity so that it is more easily interpreted. This process produces a system map that is
entirely consistent with the data; that is, there is no link in the IRT that is not represented, either directly or indirectly, in the system map likewise, there is no link in the system map that is not in the IRT.
the simplest possible representation of the IRT consistent with Criterion Number 1; that is, it meets the requirement for parsimony.
In short, this simplification process is entirely consistent with the two basic criteria of any good theory.
Step 3: Interpretation of the system map. There are three main outputs from a PathMAP®:
The elements identified by participants,
The underlying name of constructs which explain the meanings of the element to participants, and
The interrelationships among the elements, that is, the system map.
The system map reflects the shared understandings and meanings attached to the observations and experiences of employees working for the organization. People in this organization understood this influence map to be the “truth” about the reality of the current organizational culture. In other words, the data correspond to the facts as experienced by the participants, thus they were empirically true. Second, the data were in agreement with the “rules of conduct” as agreed on by the participants, that is, they were coherent with the values espoused by the participants. Finally, the data were true from a pragmatic perspective in that the participants were in almost 100% agreement the data portrayed the inner dynamics of the organization.
What this means is that the system map reflects the categories and linkages that belong to the individuals who created them. Likewise, all the relationships perceived by the constituents are included in the structure of the system map. In other words, the system map contains nothing that is not the data. The system map thus represents a coherent theory from which hypotheses can be derived and tested. With this in mind, let’s consider the meanings inherent in the system map and their relationship to existing theories and data related to organizational effectiveness.
The final system map shown in Figure 3 reflects the relationships among the issues identified by employees. The boxes are the elements of the system, and the meaning attributed to each (i.e., the element’s name) is derived from the cards generated by participants. The arrows show the direction of the influence, from cause to effect. The amber color reflects the fact that each element was evaluated as having a negative valence. The names of the affinities have been changed to reflect this evaluation. The system map is interpreted from left to right.
In the broadest sense, this system map tells us that employees of the organization believe a vicious cycle of ineffective leadership (Vicious Cycle 1) causes a cycle of distrust (Vicious Cycle 2). In fact, the perceived lack of leadership competence was seen to be the cause of a host of related problems, including unfair pay, a lack of leadership direction, unclear or ineffective policies, and lack of growth opportunities. These problems interact with one another and create an arc of distortion or certainty gap between what is said and what is delivered. It is this arc of distortion that causes the cycle of mistrust and suspicion to evolve. McDonald, Kessel, and Fuller (1972) found there are three components to trust: self-disclosure, competency, and respect. He found that trust evolves in an atmosphere of transparency but only when leaders can effectively carry out their message and only when their execution enables people to meet their work needs for autonomy, purpose, mastery, and belonging. Clearly, in this organization, senior leadership was perceived not to be transparent, competent, or caring.
This cycle of suspicion and mistrust “caused” or led to what employees referred to as the Loss of Leadership Integrity. No one in a position of power was believed to be willing or able to look out for the best interests of employee and, over time, this caused or led to Feelings of Powerlessness. Finally, these feelings of powerlessness created the final outcome of a Climate Apathy.
With these general comments in mind, let’s take a more detailed look at the system map. The first thing that stands out in the map is its structure, which has three distinct segments. The first segment reflects a closed loop feedback involving four drivers: board management, a lack of leadership skills, ineffective human resource policies, and poor communications. These four affinities form a closed feedback loop that reflects a vicious cycle—the cycle of leadership incompetence. Vicious means that the loop produces a range of negative and unintended consequences, the overarching effect was the belief that leaders, especially senior leadership, were believed to be incompetent.
The influencers comprising the first segment produced or caused a second closed feedback vicious cycle—the cycle of distrust—which also comprised four affinities: a lack of confidence in leaders, ineffective policies and procedures, lack of career development opportunities, and unfair promotions and raises. The cycle of distrust led to or caused the final segment of the map—the belief in this organization that leadership lacked integrity which led to the development of feelings of powerlessness. This perceived powerlessness resulted in the development of feelings of apathy and resignation.
Now let’s interpret each segment of the map and discuss the implications of each for the effectiveness of then organization.
Segment 1: The Cycle of Leadership Incompetence
Figure 4 shows that the Cycle of Leadership Incompetence comprised four affinities: the perceived ineffectiveness of the board of directors and its policy making, the lack of leadership skills, ineffective human resources systems (HR) and processes, and poor communications. These four affinities interacted to create a closed feedback loop that eventually led to the perception that the organization was essentially leaderless. The hiring of a new CEO was created with the expectation that the work environment would show significant improvement in openness and transparency and in the way employees were treated; instead, just the opposite occurred. The day to day experiences generated by the new leadership team were perceived to be at variance with the values espoused by them and not to be in the best interest of employees.

Relationship between Vicious Cycle 1 and Vicious Cycle 2.
Ineffective board management drove lack of leadership skills
Figure 5 shows the relationship between board management and lack of leadership skills. The board had replaced the previous CEO, who had been very dictatorial, a person who gave orders and expected them to be obeyed without debate, with a CEO believed to be very employee centric. On the surface, the new GM appeared to be a good fit with the organization, but his practices turned out to be aloof, uncommunicative, and most problematic, indecisive. In addition, rather than getting rid of the old guard leadership, the new GM decided to retain many of them. This led to the perception of a lack of leadership skills, and, in the minds of employees, it was ineffective board management that resulted in a failure to hire a GM who had the competencies required to lead the organization out of the turmoil in which it was mired.

Ineffective board management caused lack of leadership skills.
Lack of leadership skills drove ineffective HR policies
One of the manifestations of ineffective leadership was ineffective HR policies (see Figure 6). By HR policies, we refer to the decisions related to getting people into the organization, developing, promoting, empowering, recognizing and rewarding them, and providing them due process. Policies are only effective if they are designed, implemented, and carried out properly, which was not believed to be the case. In fact, there was no policy regarding career development nor was there a policy regarding salary advancement. In addition to this, the HR staff was believed to represent senior management and not employees.

Lack of leadership skills was the perceived cause of ineffective HR processes.
Ineffective HR policies drove perception of poor communications
It is not likely a function that is perceived to be ineffective would be perceived to communicate openly; thus, it was not surprising that HR was believed to be misleading in its communications. With regard to their role implementing and enforcing relevant HR policies and procedures, HR was believed to be very ineffective (Figure 7). The organization was rife with miscommunication about what the policies and procedures were and they were believed to be unevenly and unfairly implemented across the organization.

Ineffective HR was the perceived cause of poor communications.
Poor communications drove the perceived ineffective board management
Finally, poor communications between HR and the employees as well as between leaders and employees further exacerbated the general belief that the Board was ineffective (Figure 8). Uniformly, employees felt they had no input into the formulation of board policy nor any access or channel to voice their concerns to the board. This led to the belief the Board was not the least bit interested in looking out for employees’ interests and were thus unwilling to help them resolve major issues they had with members of the leadership team.

Poor communications reinforced perception of board mismanagement.
A study by Owen, Culbertson and Mink (2004) provided a view of the cycle of leadership incompetence. In this study, the aim was to examine the relationship between employee outcomes and leadership practices. Figure 9 (adapted from Owen et al., 2004; Wiley & Brooks, 2000) shows the relationship model that was the outcome of this study. The main point is that when leaders are perceived to be competent, the result is that employees are enthusiastic about their jobs and the organization; when not, employees are apathetic and lack energy—and this is what we observed in the current organization.

The leadership influence model.
The four elements described above interacted in a vicious cycle to cause a related vicious cycle, the cycle of distrust (Figure 10). The means by which this seems to have happened was the frequent breaking of agreements, the lack of transparency, and the lack of alignment between words and deeds.

Leadership incompetence caused the cycle of distrust.
Segment 2: The Cycle of Distrust
The cycle of distrust (Figure 11) was created by the interaction of four affinities: lack of confidence in leaders, ineffective policies and procedures, lack of career development opportunities, and unfair rewards and recognitions. These factors are in a constant state of interaction and this creates a self-reinforcing cycle that consistently communicated the message that leaders were not able and/or willing to provide employees fair rewards and recognition, which thus reinforced the lack of confidence in leadership.

The cycle of distrust caused the loss of integrity.
This interpretation is supported by the work of McDonald et al. (1972) who found that at the behavioral level, trust is determined by the degree to which leaders are transparent, keep their commitments, and ensure employees’ health and safety. Underlying these behavioral manifestations of trust are leaders’ intentions and competence. When leaders consistently go back on their word and consistently fail to deliver on their promises, employees start to question their true intentions and/or their ability to execute their intentions. Winter, Owen, Read, and Ritchie (2010) showed that an important determinant of safety excellence was the degree to which employees had confidence in leaders to execute the safety strategy. In other words, safety results were influenced by the degree to which employees perceived their leaders to be competent and to genuinely care about their safety.
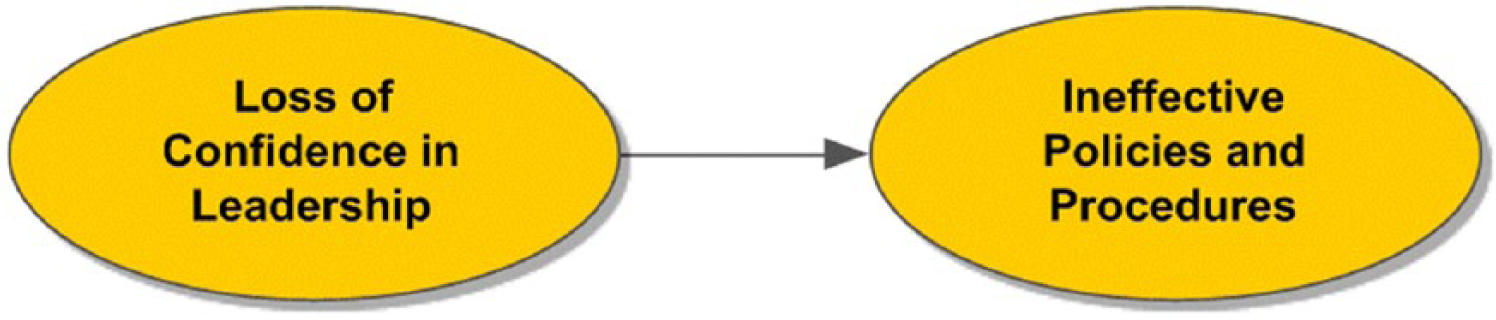
Lack of confidence in leaders drove ineffective policies and procedures
Lack of confidence in leadership and the lack of clear policies and procedures concerning promotions and salaries both had the same number of ins and outs (see Table 2). This underscores the fact that in an organization, management is responsible for developing policies and procedures that take care of employees’ needs, especially with respect to developing, rewarding, and treating employees equitably. These three concepts are central to employees being able to meet their needs at work. This was not taking place in the current organization. Policies and procedures were hopelessly obsolete and were seen to be unfair to employees. More importantly, they were seen to be at variance with the promises of the new management team. Instead leaders regularly said one thing and did another. For example, employees were promised a cost of living raise; however, this decision was suddenly reversed without explanation. This decision violated the espoused value of transparency. Employees came to believe the values were no more than a publicity gimmick of the new leadership team (Figure 12).

Lack of confidence in leaders drove perception that policies and procedures were ineffective.
Ineffective policies and procedures drove lack of career development opportunities
There was a total lack of policies and procedures regarding career growth in the organization. This was in part due to the history of the organization—the organization was very stable for many years. In any case, no clear policies regarding career development existed, nor was there a career ladder for any position. As a result, employees felt trapped into a completely arbitrary process that was controlled by a manager, whom they typically did not trust to have their best interest at heart (Figure 13). This lack of a career path meant that employees perceived themselves as locked into a pay grade indefinitely.
Lack of effective policies drove the lack of career development opportunities.
Lack of career development opportunities led to unfair promotions and pay raises
The fact that there were no adequate or meaningful policies and procedures regarding career growth meant that there was no rational basis for giving employees promotions or pay raises. In the past, this had not been a problem, for every year each employee got a cost-of-living adjustment and this seemed to have sufficed; however, in the midst of the current financial crisis caused by the outgoing CEO, the cost-of-living adjustment was eliminated and promised raises were delayed. The effect of this was an intense feeling among employees they were not being treated fairly or equitably. Research by Sirota, Mischkind, and Meltzer (2005) showed that equitable treatment is the single most important determinant of satisfaction with an organization. When employees perceive a lack of equity, they become intensely dissatisfied with their organization and many, if given the opportunity, will leave the organization. Unfortunately, for the employees of this organization, leaving was not a generally viable option and this led to the further erosion of confidence in leaders (Figure 14).

Lack of career development opportunities drove unfair pay and raises.
Lack of promotions and pay raises eroded confidence in leaders’ competence
Figure 15 shows the relationship between the lack of promotions and raises and the loss of confidence in leaders. There was more than 90% agreement among the rank and file employees that senior and middle-level management in this organization could not be counted on to do what was right for employees. Research shows that when employees do not feel as if they are valued by their organization, they develop feelings of hostility and/or despair. Furthermore, they begin to feel trapped. Ironically, at this organization, employees felt an intense loyalty to their customers and this loyalty amplified the already intense level of anxiety and anger toward the organization and its leaders.

Unfair pay and raises further eroded confidence in leaders.
The cycle of distrust produced what employees referred to as a loss of perceived integrity. In effect, senior leaders (and the board) were perceived to have betrayed the covenant that had long defined the relationship between employees and the organization (Figure 16). Dictionary.com defines integrity as “adherence to moral and ethical principles; soundness of moral character.” Leadership was perceived to lack this moral character. It was not that they were believed to lack character per se but that they lacked the ability to fulfill their promises. As a result, each day, employees would come to work and expect to be treated with indifference.

The cycle of distrust led to the perceived loss of integrity.
Segment 3: The Perceived Loss of Integrity Created a Sense of Powerlessness and Eventually Apathy
Leadership incompetence was believed to produce a cycle of distrust which was perceived to result in a loss of organizational integrity and eventually feelings of powerlessness and apathy. This set of relationships represents the third segment of the system map.
Self-fulfilling prophecies
The first element in Figure 17 represents a generalized expectation. An expectation is a psychological prediction that something will occur. The effects of such expectations have been widely researched. For one thing, it is known that expectations tend to be self-fulfilling (Bandura, 1997). If I believe that leaders have little integrity, and if I believe there is nothing I can do about it, then I tend to act in accordance with this set of beliefs. Furthermore, I tend to see only those features of the environment that reinforce this belief (this is referred to as belief bias).
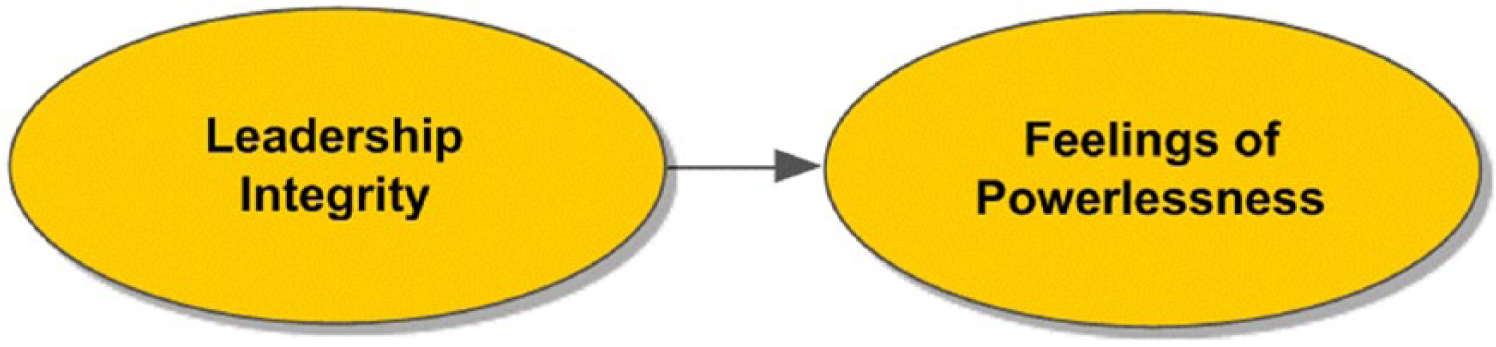
Relationship between leadership integrity and congruence.
Let’s look at this phenomenon from the perspective of motivation theory. A widely accepted theory is that people bring to work each day three basic needs: achievement, belonging, and respect (Pink, 2009; Schwartz, 2009; Sirota et al., 2005). Each day, the organization and its leaders create a range of experiences, some of which provide an opportunity to meet these needs, through the job, through relationships with others, through the character of the organization, and so forth, and some of which do not. At our subject organization, employees found it impossible to meet these needs. This state of affairs leads to the predictable effects of learned powerlessness. Learned powerlessness has three components. Cognitively, it is the belief that there is nothing in one’s power that can be done to meet one’s needs; emotionally, it is the expectation of failure; and behaviorally, it is acting in a manner that is consistent with the belief.
Figure 18, adapted from Mink, Owen, and Mink (1993), illustrates the self-fulfilling nature of beliefs and the expectations and actions that are created as a result.
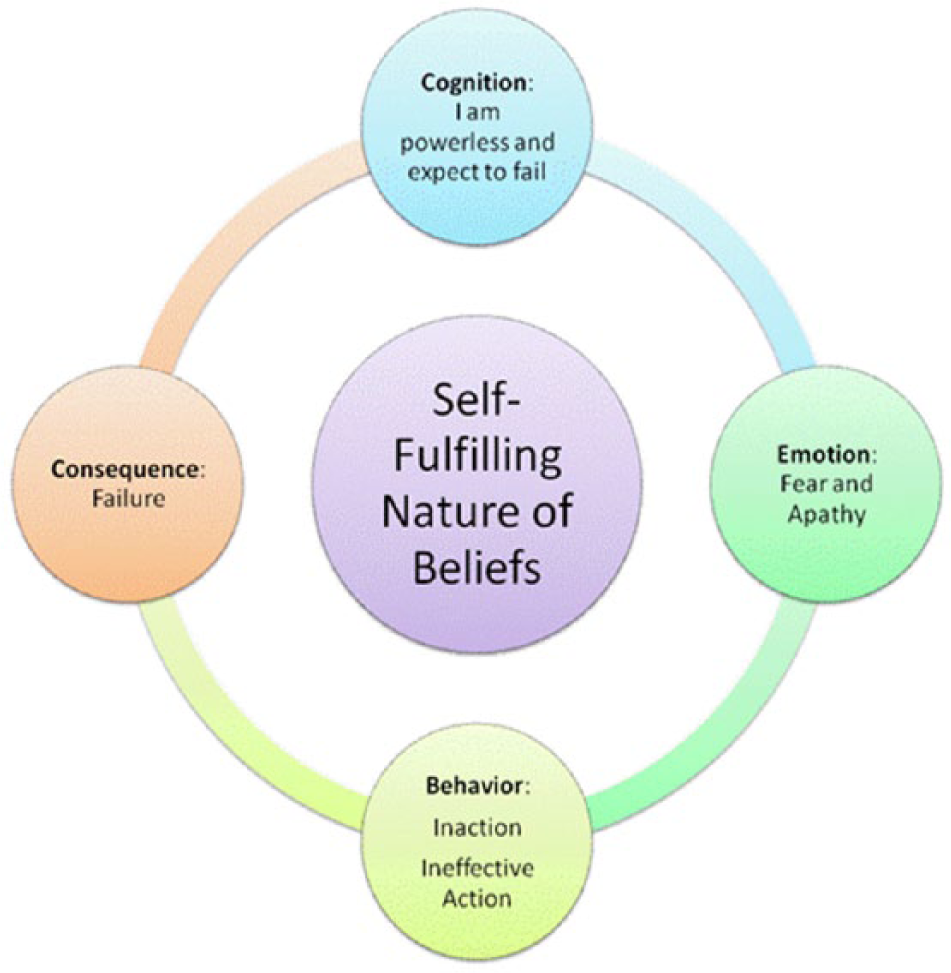
Beliefs become self-fulfilling prophecies.
Feelings of powerlessness lead to apathy and resignation
There was 100% agreement among our PathMAP® groups that the current climate of the organization was characterized by low trust and high fear. This emotional state was the experience of a majority of employees who worked for this organization (Figure 19). Bandura (1997), in his pioneering research on the determinants of self-esteem, found that three conditions activate expectations: self-efficacy (I can), response efficacy (I’ll be successful), and outcome expectation (I’ll get something I value). In the organization, the latter of the three conditions was lacking. No matter how hard one worked or how well one performed, there was no commensurate reward or recognition. In fact, many believed wages were kept deliberately low.
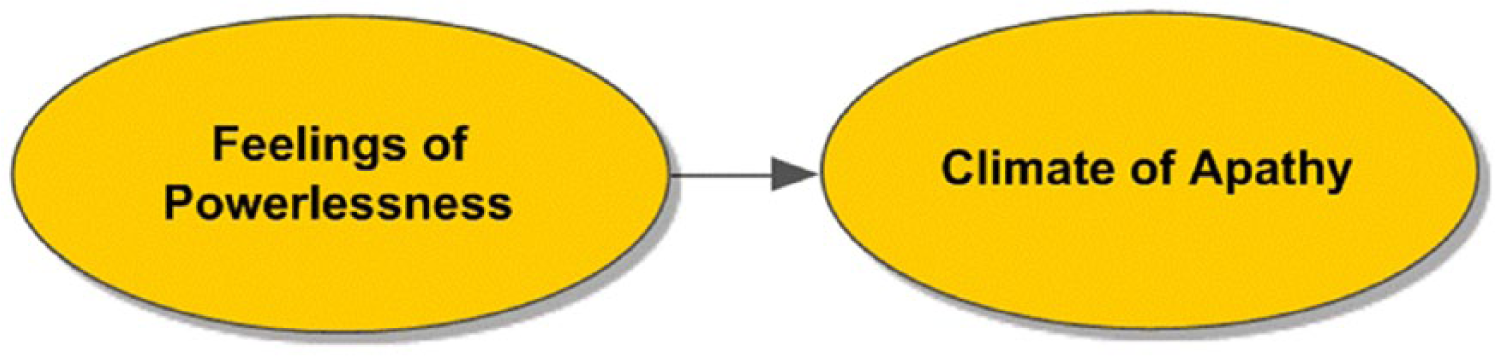
Feelings of powerlessness result in a climate of apathy.
A Disconnect Between Effort and Outcome
Seidman (2007) showed that when people fail to see a relationship between effort and outcome, a generalized expectation of powerlessness and learned helplessness develops (the response is elicited by a wide array of situational cues that bear some degree of similarity to the original cue). For example, when my effort consistently fails to produce an increase in pay, I come to doubt all my interactions with an organization.
Much has been written about the vicious cycle of distrust in organizations as opposed to a virtuous cycle of trust. The research by Gibb (1978) and his students sheds the most revealing light on the root causes and effects of the cycle of trust versus mistrust. According to Gibb, there are two primary processes available to any human interaction: an opening and a defending process. Which of these becomes part of an organization’s culture depends on the level of trust and transparency perceived to characterize the organization (Table 3). In a trusting environment, opening is the normative process and a positive inner work life the outcome. In a distrusting environment, defending is the normative process and a negative work life the outcome. Clearly, in our “subject” organization, defending was the norm.
Opening and Defending Processes in Organizations.

What are the effects of this climate? We can think of effects in terms of the short term and the long term. In the short run, employees feel betrayed by the company’s leadership. The implicit covenant between employees and the organization was one based on the belief the organization would look out for its employees; this covenant was broken when employees were consistently treated as if they were not valued.
In the long run, the betrayal employees experienced was a violation of what McDonald et al. (1972) called contract trust (unilaterally breaking an agreement). From the victim’s point of view, a betrayal of trust produces shock, disappointment, and eventually a reevaluation of one’s belief system. This is because every betrayal makes the victim look back over their past to try to determine what caused it. This reflection almost inevitably leads to self-blame and guilt. Although employees may express anger and indignation at not being treated well, underneath this anger, there is a loss of self-worth, of feelings of efficacy and the ability to control one’s environments and produce outcomes that will enable people to meet their needs. This path between betrayal and unworthiness is how deception causes so much damage. Because betrayal causes the victims to feel bad about themselves, they are hit twice—first, the social contract has been broken and second, they think poorly of themselves.
Betrayal, then leads to and reinforces feelings of powerlessness as the victims come to believe there is no way they can fix the situation. Such powerlessness leads to what Harvey (1988) referred to as anaclitic depression—the loss of the sense of self at work that is caused by a separation or loss. Sometimes the loss of power leads to fantasies of revenge. The movie “Inglorious Bastards” demonstrates this fantasy. As Daniel Mendelsohn (2009) said, “Tarantino indulges this taste for vengeful violence by—well, by turning Jews into Nazis.” Being passive is so painful that we often want to turn passive into active. The victim becomes the perpetrator. More often than not, in the workplace, the loss of power leads to apathy and resignation.
What Can Change?
Clearly, there is a need for change in this organization. The question is what should be changed. When answering this question, two issues must be analyzed. First, while it might be tempting to focus on Low Integrity, by designing a feedback system and holding those in leadership roles accountable for how they are perceived, doing this might turn out to be akin to treating the symptom and not the disease. It may produce a short-term relief from the pain, but it may not eliminate the root cause of it. One could expect the disease to worsen over time, even though its symptoms may not be as obvious. The fact is this element is the predictable outcome of other more pernicious issues at work in this system. The best strategy, all else equal, is to focus on drivers as close to the primary driver as possible.
The decision as to which driver to focus on is, in part, determined by the driver’s malleability. Dictionary.com defines this concept as adaptable or tractable such as the malleable mind of a child. Malleability, then, refers to which of the primary drivers are most susceptible to change. Based on this concept, we propose the most obvious intervention is to strengthen the leadership capability of the system. Figure 20 shows a system of leadership development that bridges the gap between the lack of confidence in leadership and the cycle of distrust. This system is based on a study of best practices in leadership development conducted by the Research Board of the Corporate Leadership Council (2004). As can be seen, the process starts with the development of behaviorally based leadership descriptions. By focusing on what leaders are expected to do as opposed to focusing on some abstract trait or style, it is possible to create expectations and standards that are actually observable and measurable. This, then makes it possible to formatively evaluate current role occupants and provide them coaching and mentoring prior to holding them accountable for their practices.
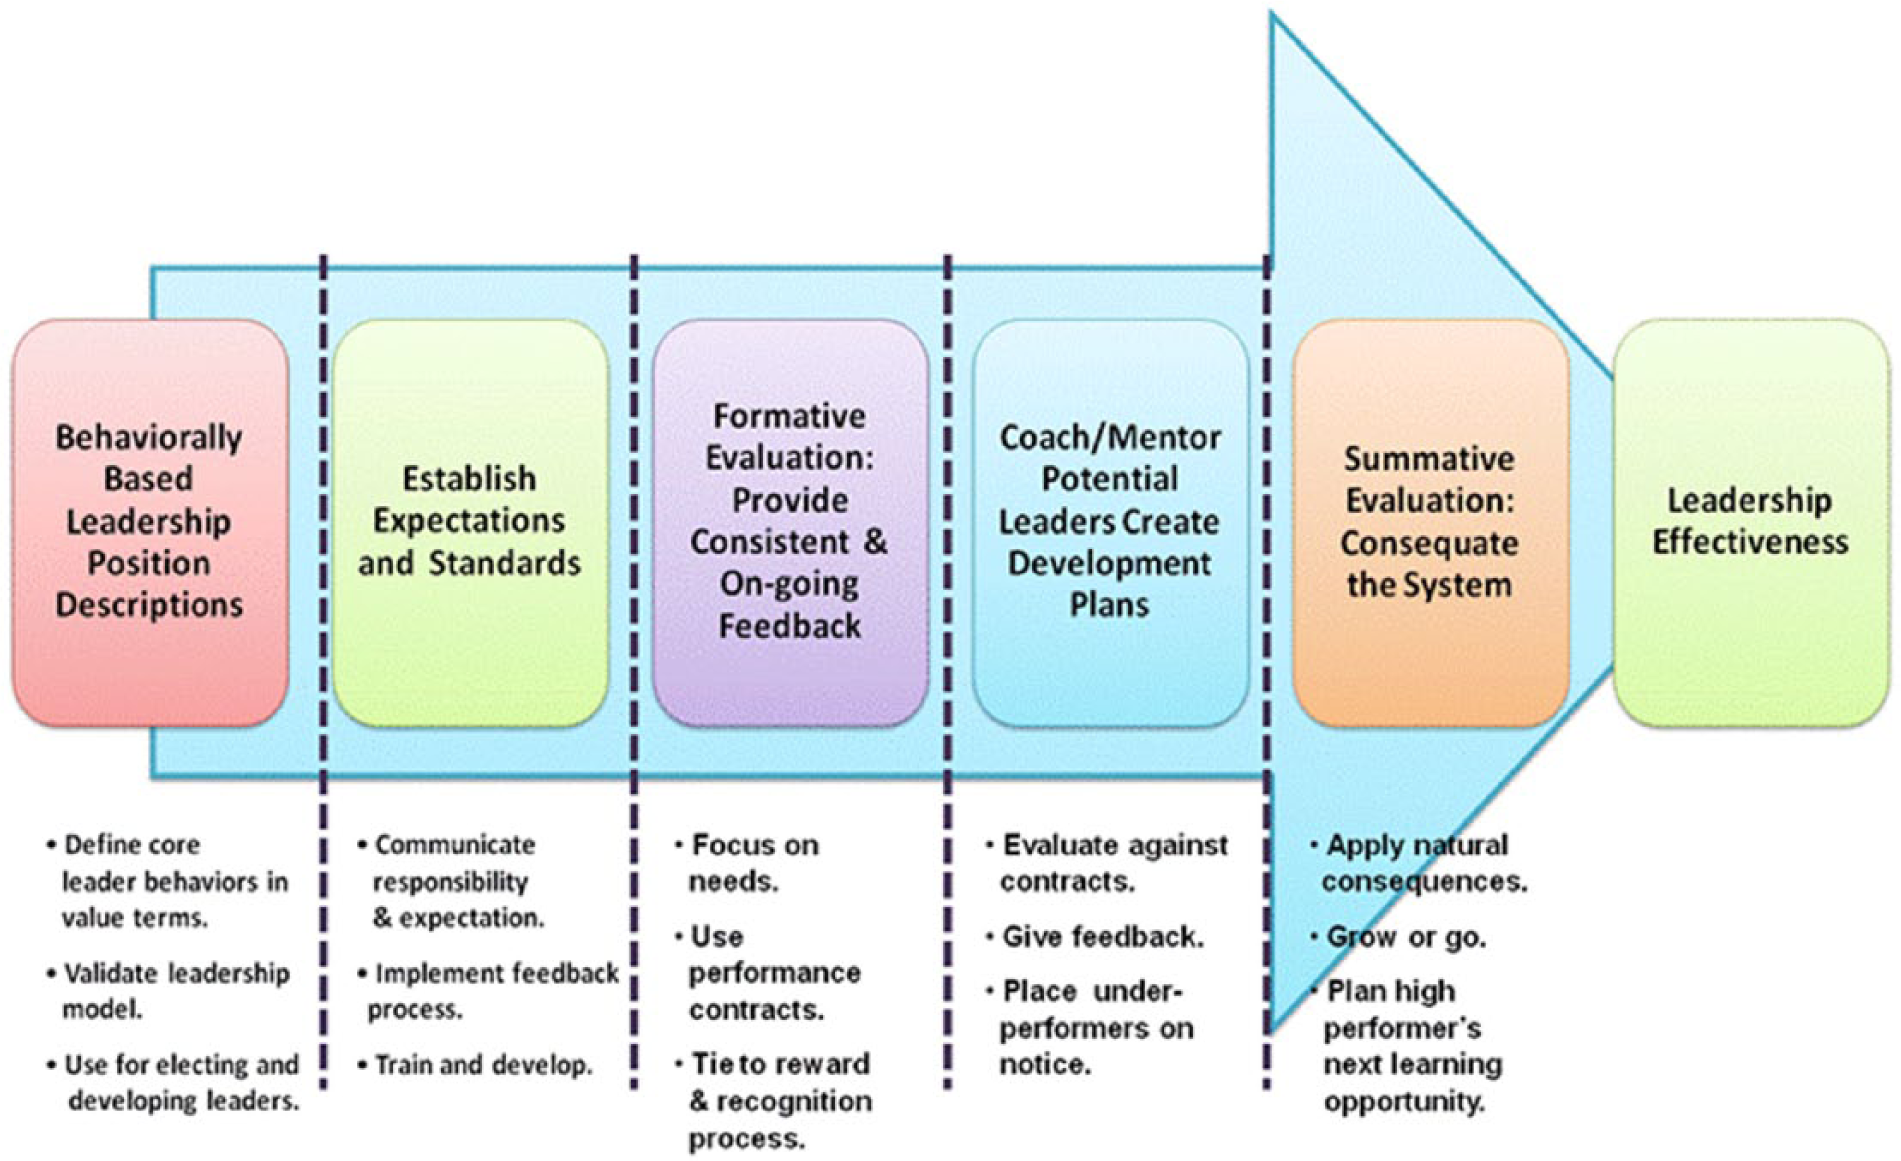
A model for developing confidence in leaders.
Conclusion
This article presents an in-depth look at an organization with deep systemic issues that need to be addressed in order for the organization to move forward in a healthy manner. PathMAP® was used, in conjunction with a quantitative employee survey, to take this deep look into the inner dynamics of this organization. While the organization has a unique context and culture, it is not alone in having problems; PathMAP® can be fruitfully used in other organizations to create a shared understanding of organizational reality and how to make significant improvements in organizational functioning. PathMAP® can be used to identify the malleable elements that can be manipulated to improve the organization and to generate heuristic validity for the solution.
PathMAP® reflects a recent evolution of organizational assessment tools that have a heritage in the work of Deming and others (for a representative list of such tools, see Cambridge University Institute for Manufacturing, n.d.). This heritage is important. Organizations today are inherently more complex than the manufacturing environment of 1950s Japan. The tools used by organizational experts must keep pace with the complexity of the organizations they are trying to assist. PathMAP® provides a stable systemic picture of influencers in the organization and provides a picture of empirical truth (correspondent truth) as perceived by those living it day to day. It provides a picture that allows practitioners (both internal and external) to compare the “truths” from the population of authors and come to a shared sense of validity for the organization.
In the preceding pages, we have described how PathMAP® was used to accomplish three important aims from the perspective of the change agent:
Involving stakeholders in interpreting the data they authored.
Deepening understanding of the system of which the participants are a part.
Facilitating the design and execution of change and transformation.
What makes PathMAP® so useful and powerful in accomplishing these three aims? There are a variety of reasons, both pragmatic and theoretical.
It gets the people who wrote the text engaged in the process of telling the reader what she or he really meant (heuristic validity or shared meaning).
It builds commitment.
It provides a picture of system influences and effects and thus provides a qualitative estimate of concurrent validity (in comparison with survey multivariate analysis).
It provides a picture of empirical truth (correspondent truth).
It provides a picture of the coherent truth as it allows us to compare the “truth statements” from the population of authors.
The case study is an important initial step in exploring PathMAP® as a tool for better understanding the systemic influences that affect an organization; however, there are two cautions to take away from this study. First, the PathMAP®, like any other point in time assessment, is just that—a point in time. It is obvious that the organization continues to move in dynamic ways that are unpredictable to some extent. That being said, after a first series of interventions are conducted, it would be important to conduct a subsequent PathMAP® to determine the effectiveness of the interventions. Second, there is clearly need for more focused research to be conducted on PathMAP® process, results, and the effectiveness of organizational interventions that come from an interpretation of the results.
Footnotes
Declaration of Conflicting Interests
The author(s) declared no potential conflicts of interest with respect to the research, authorship, and/or publication of this article.
Funding
The author(s) received no financial support for the research and/or authorship of this article.