
Abstract
One of the most contentious urban education policy issues in the United States today is the expansion of charter schools and its repercussions. Does the expansion of charter schools affect the racial and socioeconomic composition of traditional public schools in the United States? This study provides empirical evidence on this question by relying on a panel design that uses school-level data from two states that have experimented with charter schools for more than 15 years: Ohio and Texas. Using county-level, spatial, and enrollment-based measures of charter exposure, the changes from pre- to post-charter-legislation stages in the student compositions of public schools that do and do not face competition from charters are examined. The results suggest that charter school presence contributes to aggregate-level changes in the share of non-Hispanic White and free-lunch-eligible students in traditional public schools in both states in different ways.
Policymakers seeking to enhance educational outcomes have adopted numerous choice policies designed to increase competition in public education. Market-based theories of school choice favoring competition in education argue that increased parental choice will enhance the efficiency of not only choice schools but also nonchoice schools by stimulating improvement in the entire system (Chubb & Moe, 1990; Hoxby, 2000). Critics of choice policies, however, are concerned about the unintended consequences of adopting market-based policies in education. One persistent concern is the potential increase in racial and socioeconomic segregation in public schools (Frankenberg, Siegel-Hawley, & Wang, 2011; Henig, 1994; Levin, 1998; Lubienski, 2005; Smith & Meier, 1995). Charter schools have had strong bipartisan support for more than 15 years now from both sides of the aisle in Congress. Race to the Top program that began in 2009 requires states to prepare plans that are in line with the education-reform criteria, which include the growth of charter schools. As we move into the new phase of charter school growth, it is important to keep tracking the improvements and changes in nonchoice schools, as well as choice schools, and whether and the degree to which the improvements are accompanied by stratification along race or socioeconomic status.
Most states have adopted charter school legislation and support the school founders to increase the quality and efficiency of schooling not only in the charter schools themselves but also in the entire public education system. Many educational reformers find competition indispensable for public schools improvement (Lubienski, 2006). An early report by U.S. Department of Education showed that the charter school authorizers interviewed cited creating competition in the public school system as the primary reason they awarded charters (Policy and Program Studies Services [PPSS], 2004). Those who support charters see these alternative schools as a promising policy option to lift urban education. Scholars have argued that charter schools might reduce existing stratification, particularly in locations where traditional public schools are highly segregated, by either reducing middle-class parents’ willingness to move to the suburbs or to send their children to private schools or by empowering disadvantaged parents to choose schools without residential limitations (Greene, 2000; Hassel, 1999). Overall, the movement has been enjoying wide support from politicians from both sides of the partisan line, a large group of educators, and parents, and consequently the number of charter schools has grown rapidly. An ever-increasing number of studies on various aspects of charter schools are published. In addition to their effect on their own students’ achievement, studies continue to investigate their influence on the racial and socioeconomic compositions of traditional public schools (Frankenberg et al., 2011; Garcia, 2008; Ni, 2010). The variation in charter school laws across different states contributes to the difficulties of understanding with any single study or method the full range of impacts created by such policies. Therefore, examining experiences in different states is crucial for acquiring a more complete picture of the influence of charter schools.
This study takes advantage of the rapid increase in the number of charter schools in two states, Ohio and Texas, to investigate whether the expansion of charter schools contributes to the changes in the racial and socioeconomic composition of the public schools in these states. Both states had no charter schools in 1995 but had more than 300 operational charter schools in the 2009-2010 school year. 1 By using two-period school-level panel data and several county-level, spatial, and enrollment-based measures of charter exposure, this study explores the systemic effects of charter schools on student distributions by addressing the following questions: (a) Does the presence of charter schools contribute to the aggregate changes in the racial and socioeconomic distributions of students in traditional public schools? (b) How do the sizes and scopes of changes vary according to different measures of exposure?
Background
While the average changes in the composition of students served by public schools cannot capture the full extent of segregation or integration in schools, this study focuses on composition of student body as a first step in beginning to understand whether the charter school movement contributes to how student groups are sorted across schools. Empirical studies focusing on racial patterns of enrollment in public schools show that most public schools in the United States are already highly segregated and that demographics of the public school system in many areas represent an unbalanced distribution of students by race and socioeconomic status (Clotfelter, 1999; Frankenberg et al., 2011; Ni, 2010). Evidence from other countries, which have experienced wide-ranging school choice reforms, shows that the schools have become significantly more polarized along ethnic and socioeconomic lines than before in some instances (Ladd & Fiske, 2001) and indicates that unfettered choice could potentially increase stratification (Schneider, Elacqua, & Buckley, 2006). The conclusions from research on charter schools and their effects on student distributions are mixed. The following two sections focus on the theoretical arguments and the empirical studies, respectively.
Theoretical Arguments
Scholars suggest a variety of reasons why student distributions might change (Fiske & Ladd, 2000; Frankenberg et al., 2011; Schneider et al., 2006; Smith & Meier, 1995; Wells, Holme, Lopez, & Cooper, 2000). First is the influence of several aspects of parental demand, which is a key element in the success of any school choice policy. Parents may choose schools not only for their academic reputation but also for a variety of other reasons, including peer group preferences and geographical proximity. If parents value certain peer group characteristics and sort their children into schools along racial and class lines, existing stratification may deepen (Smith & Meier, 1995). Although most surveys of parents show that all parents value academic quality and that few refer to the composition of the student bodies in schools, studies based on the actual behavior of parents found that parental decisions do appear to be influenced by factors such as demographics (Henig, 1990; Schneider & Buckley, 2002; Schneider et al., 2006; Weiher & Tedin, 2002). Another aspect regarding parental demand is the ability of parents to make well-informed decisions. Research on other forms of public school choice has clearly demonstrated that there are significant information disparities between different groups of parents and that the average parent does not have very accurate information about the conditions in schools (Schneider, Teske, & Marschall, 2000; Schneider, Teske, Marschall, & Roch, 1998).
Second, despite the racial/ethnic balance enrollment guidelines some states set for their charter schools (Frankenberg & Lee, 2003a), schools can influence their student distributions through a variety of mechanisms (Wamba & Ascher, 2003), such as recruitment and admission policies, marketing mechanisms, and transportation to the school. Wamba and Ascher (2003) described several examples from different states, such as schools tailored to specific populations by adopting specific curriculum content to cater to minority parents or private to charter conversion schools, which take advantage of the new laws to gain access to government funds without necessarily changing enrollment. Some of these strategies may lead to concentrations of certain types of students. In addition, the viability of a charter school depends on its financial resources and thus its capacity to attract students. When students transfer from public schools to charter schools, the funding follows the student. 2 Critics worry that the new schools will drain the already limited funding of traditional schools. They also worry that financial and academic pressures may compel schools to avoid high-cost students (Miron & Nelson, 2002) or that recruitment and admission policies or marketing mechanisms may affect the profile of applicants (Wamba & Ascher, 2003; Wells, 2002). Furthermore, whether transportation of charter students is required or left as a parental responsibility may seriously affect the pool of applicants (Wells et al., 2000). Keeping these concerns in mind, researchers warn that existing stratification and segregation may deepen as choice increases if the necessary institutional arrangements and regulations, such as well-designed and enforced equity provisions, are not created (Cobb & Glass, 1999; Schneider et al., 2006; Smith & Meier, 1995; Wells et al., 2000).
In contrast, charter school supporters value and welcome the competition created by charter schools and perceive these schools as part of the solution to the persistent segregation and stratification problems. While charter schools are still public schools, policy allows them to be free of bureaucratic constraints that affect other public schools and to develop creative, innovative curricula or to use new teaching methods in hopes of attracting parents and students and becoming “public education’s ‘R&D’ arm.” 3 Charter schools are presented as laboratories that can test and find better approaches to education that can transform the larger public education system (U.S. Department of Education, 2004). Besides creating opportunities for innovation and incentives for other public schools, as charter schools do not use established attendance zones, they may weaken racial isolation by expanding choice to families in poor neighborhood schools (Greene, 2000; Hassel, 1999; Viteritti, 1999). The theoretical arguments outlined above suggest primarily three ways for charter schools to induce change in public schools. First, flexible and innovative charter schools may act as incubators of new ideas and approaches, which traditional public schools can adopt. Second, if losing students has direct financial effects, public schools have an extra incentive to adopt better programs and increase performance. Third, public schools may also change if charter schools influence the student composition of public schools by absorbing more disadvantaged or problematic students or by attracting the best and brightest students.
Empirical Findings
The empirical research on effects of competition from charter schools is growing (Carnoy, Jacobsen, Mishel, & Rothstein, 2005; Frankenberg et al., 2011). Much of the earlier research regarding this issue is cross-sectional comparisons of whom the schools are serving (see, for example, Finn, Manno, & Vanourek, 2000; Frankenberg & Lee, 2003a; Nelson et al., 2000). Earlier National Study of Charter Schools sponsored by the U.S. Department of Education concludes that the proportion of White students in charter and public schools is about the same, providing no evidence of increased segregation (Nelson et al., 2000). During the same period, in the Charter Schools and Race study sponsored by the Harvard Civil Rights Project, Frankenberg and Lee (2003b, 2006) compared racial composition and segregation of charter schools by state and concluded that charter schools are largely more segregated than public schools.
Other studies, primarily focusing on academic performance, examined whether charter schools absorb more advantaged students from public schools and worsen school systems for troubled students, which is sometimes referred to as the academic skimming problem. Hoxby (2003) found that on average students with lower grades transferred to charter schools in Chicago, suggesting no skimming on an academic basis. Hanushek, Kain, and Rivkin (2002) in Texas; Booker, Zimmer, and Buddin (2005) in California and Texas; and Bifulco and Ladd (2004, 2006) in North Carolina used student-level data that enabled them to track the moves of students from traditional public schools to charter schools or back over time. All three studies found that the charters might lead to additional racial and ethnic concentrations, primarily because of black charter school students selecting into more racially isolated schools. More recent studies examining data from Michigan (Ni, 2007, 2010) and Arizona have reached similar conclusions of charter school intensifying the isolation of disadvantaged or minority students in especially some urban schools and for some grade levels more than others. Petrilli (2009) found promising effects toward integration in D.C. schools that use specific and carefully designed diversity policies such as a lottery system to recruit student that takes into account the already segregated neighborhood patterns.
Three studies used variations of the difference-in-differences estimates, also utilized in this article, to study the effects of charter schools on student composition of public schools. The basic idea behind the difference-in-differences estimator is to model the treatment effect by estimating the difference between outcome measures at two time points for the treated and the control observations and then comparing the difference between the groups (Buckley & Shang, 2003; Card & Krueger, 1994). Hoxby (2001), in a study of the effects of charter schools on the achievement of public school students in Arizona and Michigan, defined treatment school districts as those where charter schools account for more than 6% of district enrollment, based on average annual enrollment change in a Michigan school (which was 5.1% prior to 1994). The findings reveal that the Michigan and Arizona public schools raised achievement in the face of competition from charter schools and that the increased achievement was not a result of cream-skimming of students. Dee and Fu (2004) compared changes in the student−teacher ratio and racial segregation in Arizona, which introduced charter schools, and New Mexico, which did not. They found that charter schools drew White non-Hispanic students from traditional public schools and caused a reduction of resources in Arizona. In a district-level analysis, Ross (2005) estimated the effects of charter school presence on the segregation of traditional public schools within districts in Michigan. The analysis measured charter presence first with dichotomous variables indicating existence of a single- or multiple-charter schools within a district then with dichotomous variables indicating that the charter schools account for below or above 7% of district enrollment (the median enrollment rate in Michigan in 1999). The results show that several forms of public school segregation have been exacerbated in Michigan districts with high levels of charter school enrollment.
Data and Method
Regression models relying on the difference-in-differences estimation method are used to model the charter school exposure effect by estimating the difference between outcome measures at two time points for charter-exposed schools and the control schools and then comparing the difference between the groups. Both states had no charter schools in 1995, but by 2009, both had more than 300 charter schools. Using the 2009 data, schools are categorized as those that face competition and those that do not, and then the differences in the outcome measure between these groups of schools are compared—First, the differences between the schools are compared in 2009, and then the same difference between the same schools are compared in 1995 to control for potential disparities between the two before charter schools existed. Then, the difference between the differences is compared, hence the name difference-in-differences.
The data used in this study come from multiple sources. The main school-level data are drawn from the National Center of Education Statistics (NCES) Common Core Data (CCD) for the 1995-1996 and 2009-2010 school years to create two-period panel data of traditional public schools in Texas and Ohio. The CCD is a comprehensive, annual, national statistical database on all public elementary and secondary schools in the United States. The school-level data include information on the racial and ethnic composition of students and on the number of students on free or reduced-price lunches. The first period represents the last year before any charter schools were established and the second period includes the data from the recent post-charter-legislation environment that can be matched with current county-level data from the U.S. Census Bureau. Table 1 shows the number of charter and traditional public schools and students in these states based on U.S. Department of Education data. Both states had no charter schools in 1995, then by the 2009-2010 school year, 323 charter schools were operational in Ohio and 536 in Texas. A higher percentage of public schools are charter schools in both states in comparison with national averages. About 4.7% of public schools are charter schools in the nation, compared with 8.5% of Ohio schools and 6.2% of Texas schools.
Number and Percentage of Public Schools by School Type and State, School Year 2009-2010.

Source: Chen (2011).
After data on all schools from each state for pre- and postlegislation periods were extracted from the CCD, charter, special, vocational, and other alternative schools were removed. 4 Then, the schools that were not operational for both periods were taken out, as they cannot be used for panel estimates. This reduced the sample size to 2,884 schools operational in both periods in Ohio and 5,456 traditional public schools operational in both periods in Texas. Data on charter schools were used to create a series of independent variables, which are described in detail in the following section.
Dependent Variables
The two main dependent variables for this analysis are the percentage of students who are non-Hispanic White and the percentage of students who are eligible for free or reduced-price lunches. The first outcome variable was used to track the changes in the concentrations of minority and non-Hispanic White students. Proportion of non-Hispanic White students is a commonly used and reported education indicator, also featured in the Department of Education’s publications as an important indicator of the condition of education in the United States. The second outcome variable provides a proxy measure of low-income family status. Previous research has found an association between higher percentages of students who are eligible for free or reduced-price lunches and lower average academic scores in schools.
Competition Measures
To categorize schools into those that are heavily exposed to charters and those that are not, three criteria (specifications) have been used. First, traditional public schools that have one or more charter schools in the same county are compared with other schools that do not have any charter schools in the same county. Second, the traditional public schools that have one or more charter schools within a 5-mile radius is compared with other schools that do not have charter schools nearby. Third, the percentage of public school students that are enrolled in charter schools in each county for school year 2009 is calculated. Traditional public schools that operate in counties with above-median charter school enrollment were compared with other traditional schools located in counties with less than median charter enrollment. 5 Special and vocational charter schools were also removed similar to the main public school data set. This means that the analyses do not include those charters opened to serve students with specific disabilities exclusively. 6
Following the literature that points out the importance of location in school choice and the studies focusing on competition effects, the first two of these measures are spatial in nature. Location is an important determinant of charter school selection by parents, especially for minority and low-income households, because although charter schools are open to students from outside the school district, the transportation costs of switching to distant schools would be higher for them (Henig & MacDonald, 2002; Kleitz, Weiher, Tedin, & Matland, 2000). In creating the groupings, public schools that have at least one, five, or more, or nine or more charter schools in the same county are compared with other public schools. As all these three specifications produced similar results, comparisons are reported using the first measure. Because counties vary widely in size, the number of schools per county may not reflect the actual competitive pressure some schools face. Geographic variables based on spatial proximity may provide a better measure to group schools. Therefore, a spatial equation was used to convert latitude and longitude differences between traditional public and charter schools into actual distances in miles on the surface of the earth. 7 Then, these distances were used to count the number of charter schools within 5 and within 10 miles of each traditional public school. These two spatial specifications produced similar results. Thus, the second measure on which the schools are grouped and the results are reported is whether the traditional public school has at least one charter school within a 5-mile radius. The third charter exposure measure was based on enrollment. The share of public school population enrolled in charter schools still represents a minor portion of the total enrollments in these states, so schools that are located in counties with heavy charter attendance may feel more competitive pressures to maintain their student populations.
Control Variables
Many social and demographic characteristics are likely to influence the student composition of schools, such as the racial composition of the local population and levels of poverty. For example, if there is a general increase in the poverty levels of the school-aged population in the area over the time period of this study, we would expect to see an increase in the share of free-lunch-eligible students in the schools. Charter schools are not confined to students living in the district where the school is located; in fact, the point of choice schools is to enable families to choose schools outside of the traditional school district if they want to. Therefore, to control for other factors that may cause changes in the dependent variables from 1995 to 2009, the models include county-level economic and demographic indicators. These controls show the changes between the pre- and postlegislation years in the percentage of 5- to 17-year olds in poverty, the percentage of the 5- to 19-year-old county population who are White non-Hispanics, logarithmic transformation of total county population, and the real median household income. The data for these control variables come from Small Area Income and Poverty Estimates of the U.S. Census Bureau (2010). 8 Charter schools are alternatives to not just traditional public schools but also to private schools. Changes in the size of the private school population may also affect outcome measures; therefore, the proportion of private school enrollment per county was also included as a control. 9 To calculate what percentage of students attends private schools within a county, the Private School Survey (PSS) data from 1995 and 2009 school years were used.
Statistical Analysis
First, the changes in the mean values for the two outcome measures for the groups of schools were investigated. To test whether the observed effects were driven by changes across counties during that period, a school fixed effects regression model, which allowed inclusion of controls for other possible factors for the change, was used. The model takes on the following form 10 :

where Yit
is the dependent variable for school i in year t,
Endogeneity is a common problem in this type of educational policy and program evaluations that use observational data. The main problem stems from the fact that the units of observation may not be randomly assigned to participate in the policy or program in question. In the context of this study, it is possible that the observed effects of charter school presence on the proportion of non-Hispanic White and free-lunch-eligible students in the nearby traditional public schools actually represents preexisting trends that are also driving the location of the charter schools. Although the difference-in-differences estimation method provides a simple yet powerful technique for estimating treatment effects with observational data (Buckley & Shang, 2003), it is impossible to control for everything completely, especially in an open policy area such as school choice. In using this estimation technique, the models compare the differences between groups of schools as well as the differences of pre- and post-charter-legislation measures so that time-invariant factors that may have affected the student composition and charter school location were differenced out.
Previous research utilizing variants of the estimator has generally used observations from some other control state that did not experience the policy intervention, for example, a neighboring state that did not have charter schools. The selection of the control state is very important and often turns out to be grounds for critique, as the model is based on the assumption that the contemporaneous changes in the control state reflect the similar unobserved and time-varying determinants of the treatment state. As there are many variations in the charter laws and educational histories, as well as regional demographic trends in different states, in this article, multiple competition criteria within the same state were used to assign schools to treatment and control groups. This ensured that the treatment and the control schools are affected similarly by other unmeasured factors such as other statewide policies. It should be noted that in states with charter laws, all schools, including those that do not have any charters in their county, can be affected by the charter schools. They may not be directly exposed to the risk of losing students who transfer to charters close by, but the possibility of new charter schools opening in the area may be enough to stir change. In other words, there is no pure control group. If this is true, then the results from these analyses will underestimate the true charter school effect.
Results
Table 2 shows the racial composition and the percentage of students eligible for free lunches in traditional and charter public schools in the two states based on the sample in comparison with national figures. The charter laws vary from state to state, reflecting the varying educational histories and the power of different political and civil groups supporting or opposing charter schools. Some of the provisions in state laws may have direct implications for charter schools’ impact on the public education system. In Ohio, racial/ethnic balance provisions simply indicate that the racial and ethnic balance of the schools should not differ from the composition in the community, whereas Texas charter law contains no specific discrimination provisions (Frankenberg & Lee, 2003a; U.S. Charter Schools Website, 2006). Despite the racial and ethnic balance guidelines, both states have racially imbalanced enrollments. In both states, the percentage of black students in charter schools is exceptionally higher than that in public schools. In Ohio 38.7% and in Texas 20.1% of public charter school students are non-Hispanic White (compared with 37.3% of charter school students and 54.8% of public school students nationwide). Charter schools also serve slightly higher proportions of free lunch eligible students in both states.
Racial Composition and Free-Lunch-Eligible Students by School Type and State, School Year 2009-2010.
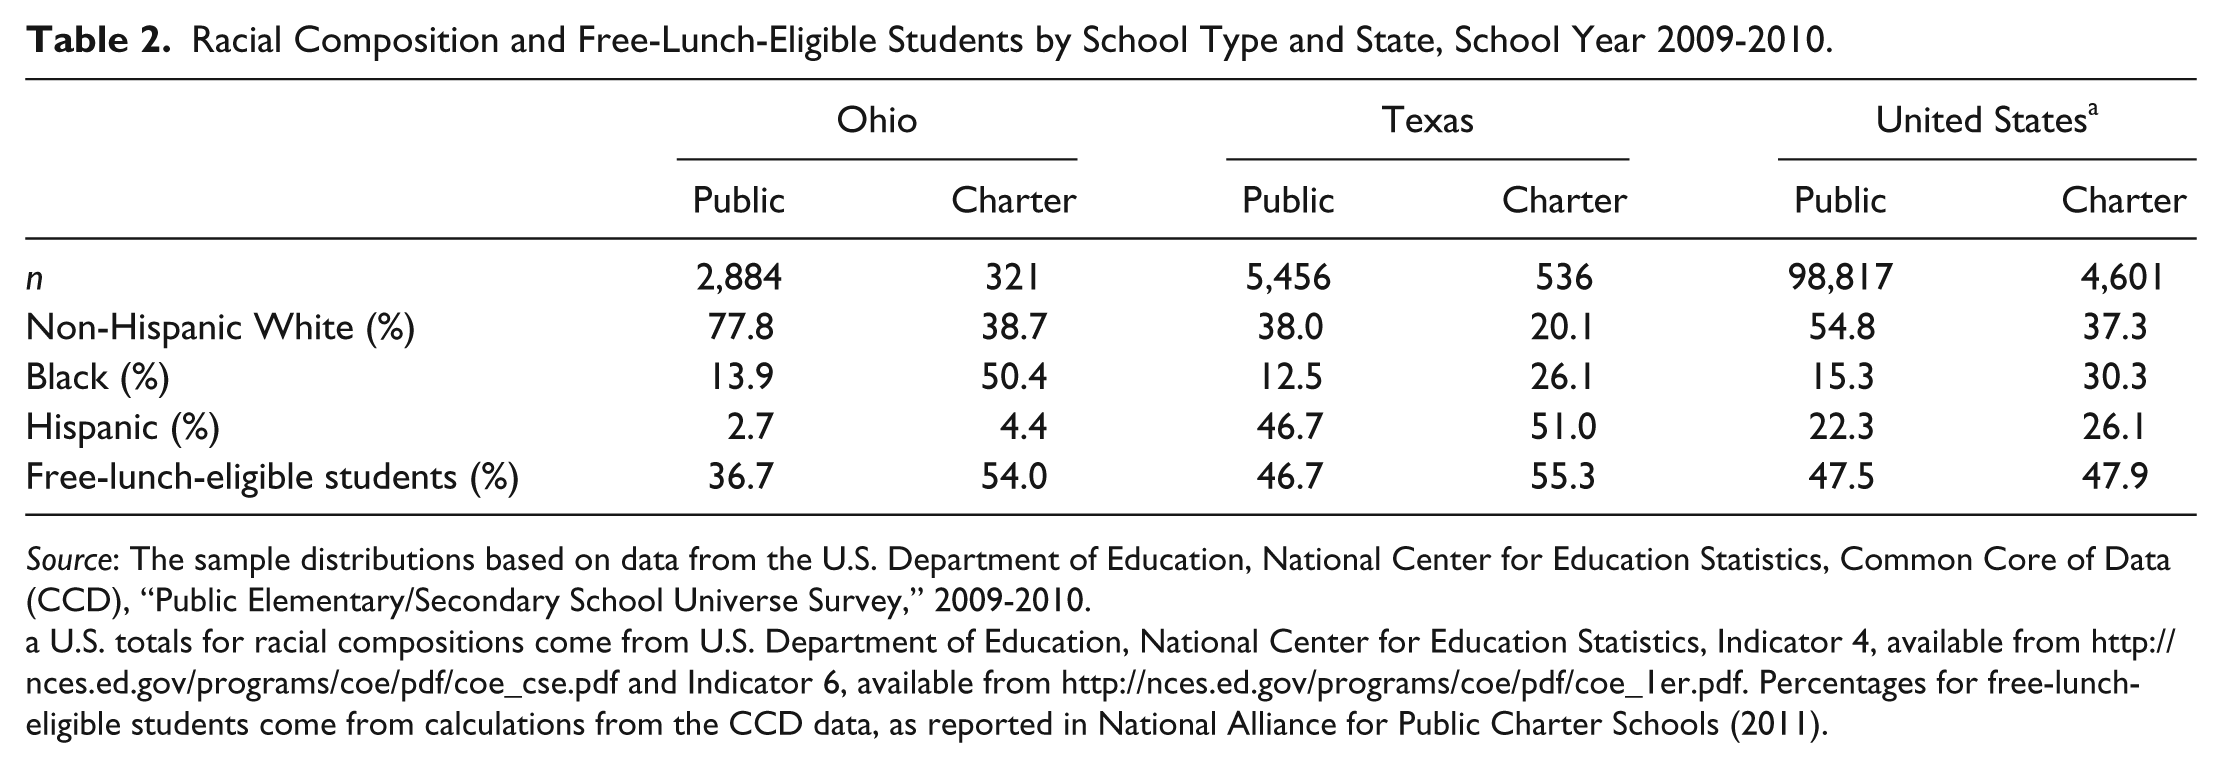
Source: The sample distributions based on data from the U.S. Department of Education, National Center for Education Statistics, Common Core of Data (CCD), “Public Elementary/Secondary School Universe Survey,” 2009-2010.
U.S. totals for racial compositions come from U.S. Department of Education, National Center for Education Statistics, Indicator 4, available from http://nces.ed.gov/programs/coe/pdf/coe_cse.pdf and Indicator 6, available from http://nces.ed.gov/programs/coe/pdf/coe_1er.pdf. Percentages for free-lunch-eligible students come from calculations from the CCD data, as reported in National Alliance for Public Charter Schools (2011).
Results from the three criteria used to measure charter school presence are reported in Table 3. As discussed previously, the first treatment group includes traditional public schools that have one or more charter schools in the same county (3,904 schools in Texas and 2,074 schools in Ohio). The second treatment group includes traditional public schools that have at least one charter school within a 5-mile radius (2,865 schools in Texas and 1,442 schools in Ohio). The third treatment group includes traditional public schools that are located in counties where charter schools enroll more than the median percentage of public school students (2,738 schools in Texas and 1,449 schools in Ohio). Basic means estimates in Table 3 show that the average share of non-Hispanic White students fell more in traditional public schools that faced competition from charter schools in both states from the 1995-1996 school year to the 2009-2010 school year. There is also a decrease in the share of non-Hispanic White students in other control schools, although the size of the change is considerably smaller. This implies that the introduction of charter schools may have caused this reduction. However, charter schools may be located in counties with different racial compositions in the first place. If the location choice is nonrandom, the observed effects can be biased. The difference-in-differences approach deals with part of this issue by looking at the contemporaneous changes in the control schools, which have no charters in their county or within their spatial proximity. This is because the estimates control the differences between the two groups before the implementation of the policy.
Mean Differences in the Share of Non-Hispanic White Students and Free-Lunch-Eligible Students for Traditional Public Schools in Ohio and Texas.
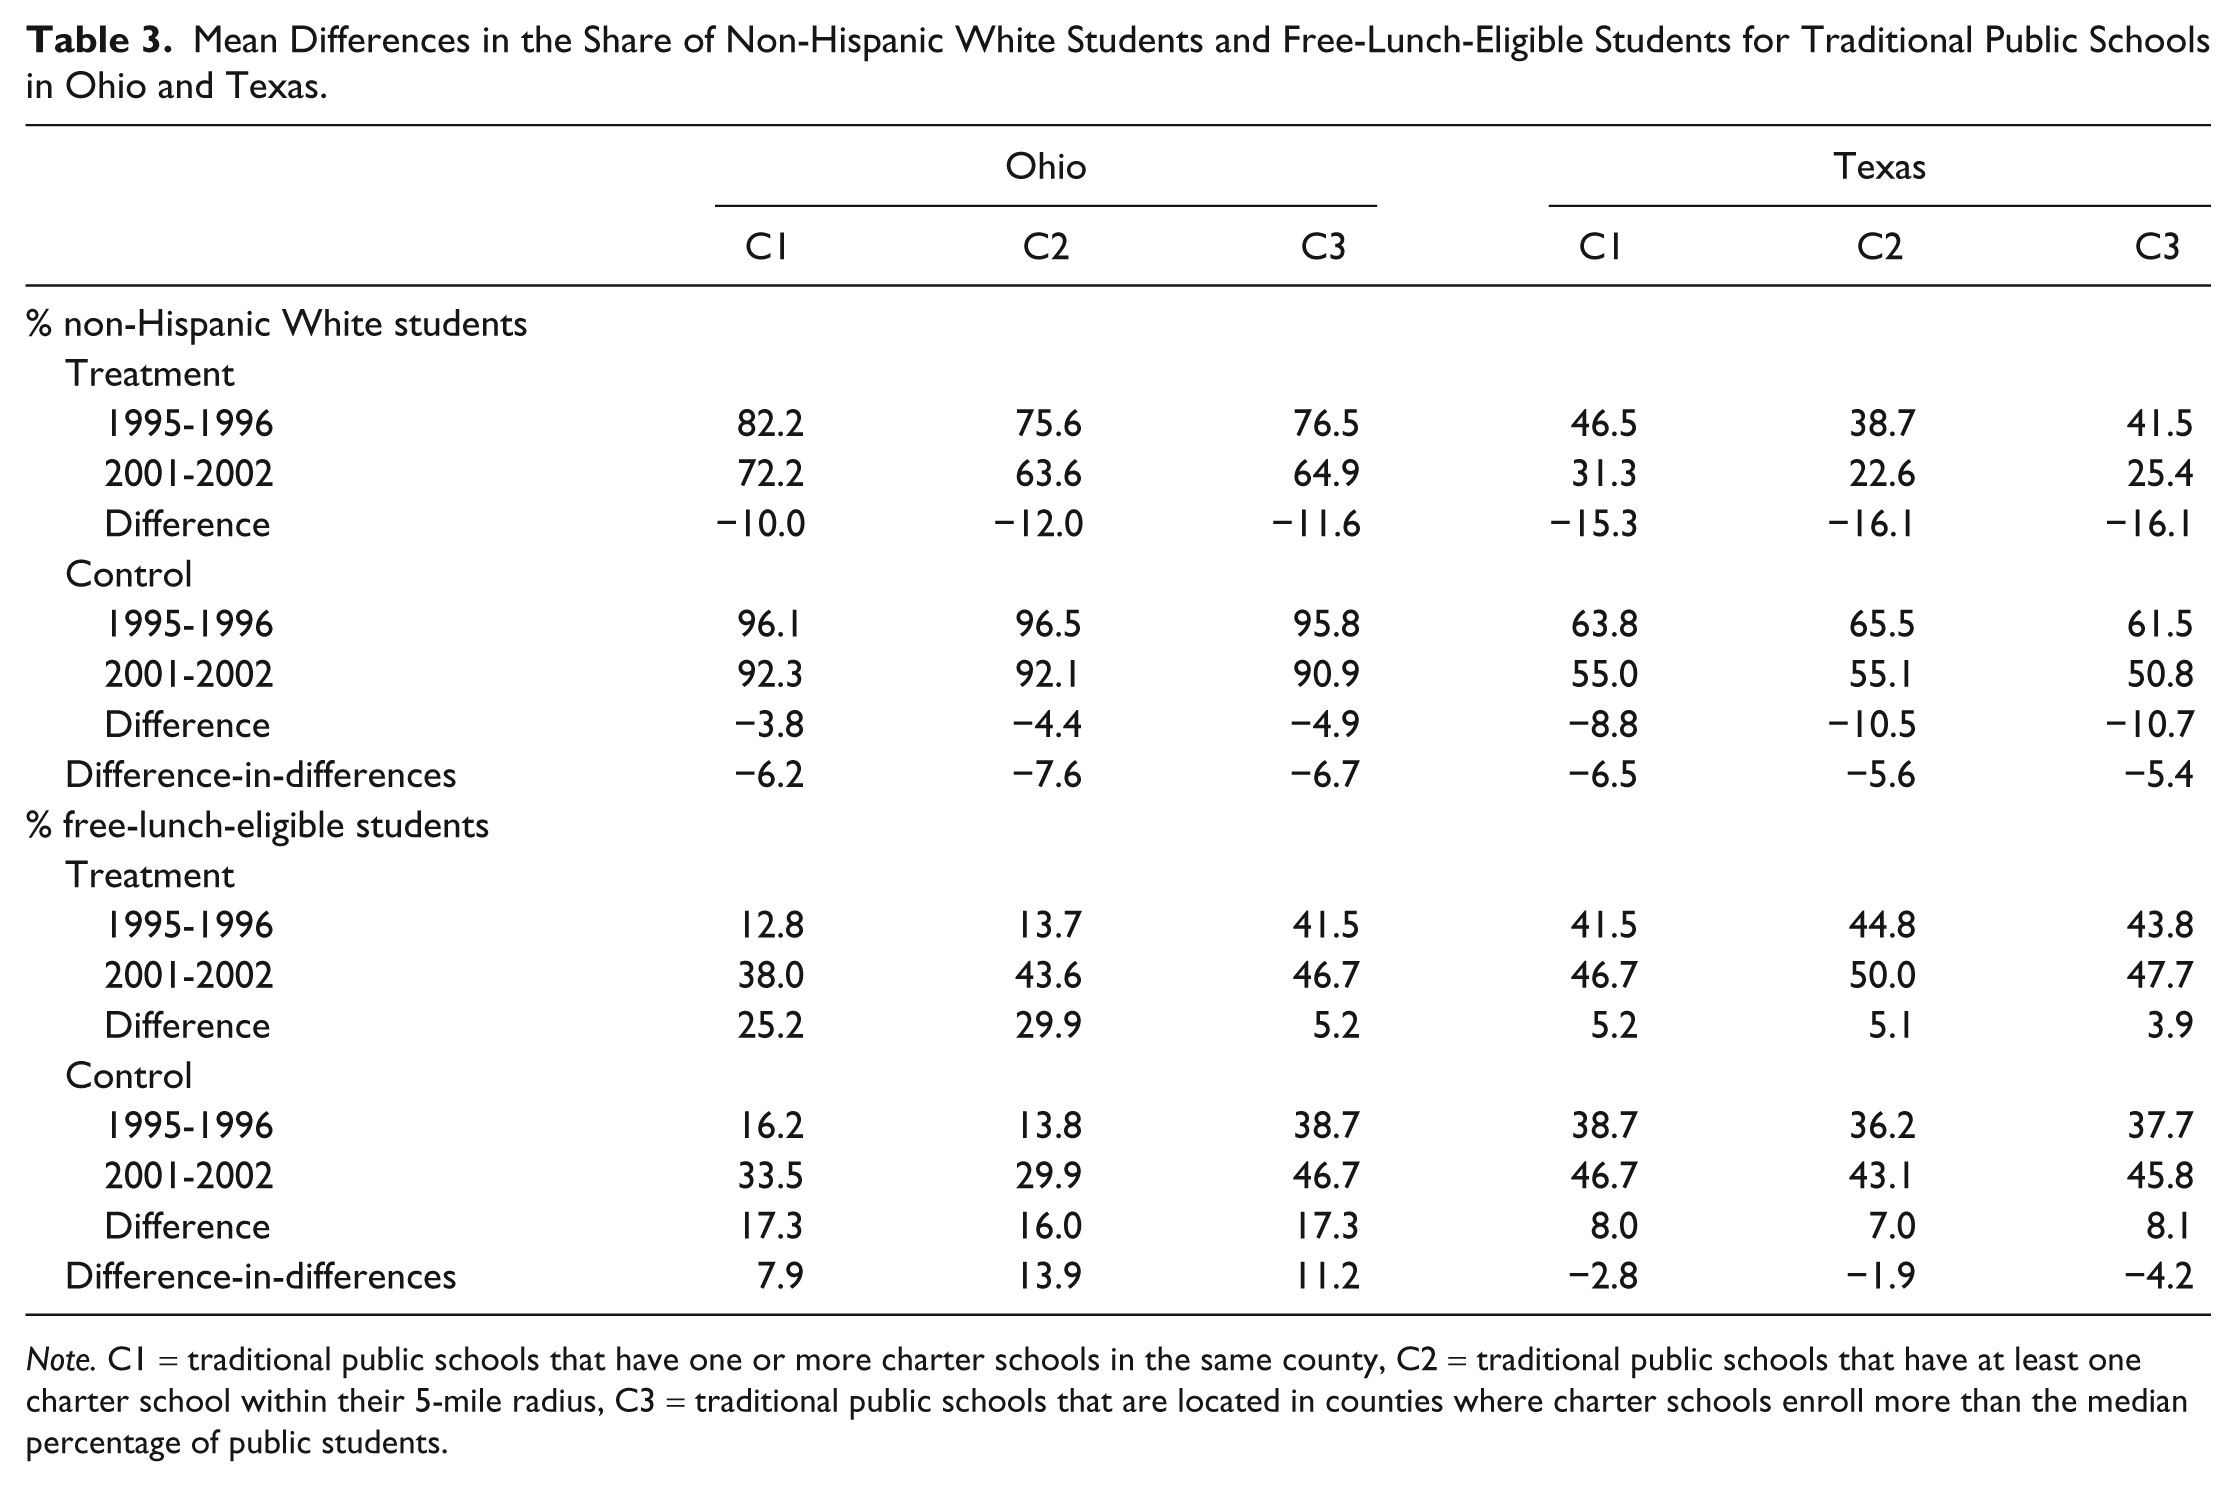
Note. C1 = traditional public schools that have one or more charter schools in the same county, C2 = traditional public schools that have at least one charter school within their 5-mile radius, C3 = traditional public schools that are located in counties where charter schools enroll more than the median percentage of public students.
When the difference of the differences between the two groups are calculated (for example, −10.0 to −3.8) in Ohio to separate the impact of charter schools, the initial results show that the introduction of charter schools leads to a 6.2 percentage-point decrease in the share of non-Hispanic White students in Ohio traditional public schools that face charter competition in their county. The spatial and enrollment-based measures show similar but overall slightly larger results.
In the models for free- and reduced-price-lunch-eligible students, the basic estimates show effects in different directions across states. The estimates show that the average share of free-lunch-eligible students in traditional public schools rose by 7.9 percentage points with the county-level measure and 13.9 percentage points with the spatial measure and 11.2 points with the enrollment-based measure from the 1995-1996 school year to the 2009-2010 school year in Ohio. In Texas, the differences of the differences are negative—the share of free-lunch-eligible students increased in this time period for the treatment and control schools, but more for the control schools, suggesting that charter schools contribute to the reduction in the share of free-lunch-eligible students in traditional public schools.
The changes in the means suggest some statistically distinguishable effects that may occur due to charter presence, but they are only average changes across the groups of schools in those states in this time period. Tables 4 and 5 present the results from the fixed effects regression models that incorporate the demographic and economic controls. In these tables, the coefficient of interest is the interaction term between the postlegislation year and the competition variable. The first column for each state shows the results from the first county-level exposure measure (C1 = school has one or more charters in the same county), the second column shows the results from the models with the second spatial exposure measure (C2 = school has one or more charters within a 5-mile radius), and the third column shows the enrollment measure (C3 = school is in county with above-median charter enrollment). Significant results are marked with asterisks.
Estimated Effect of Charter School Presence on Public Schools in Ohio: Percentage of Non-Hispanic Whites and Percentage of Free-Lunch-Eligible Students.
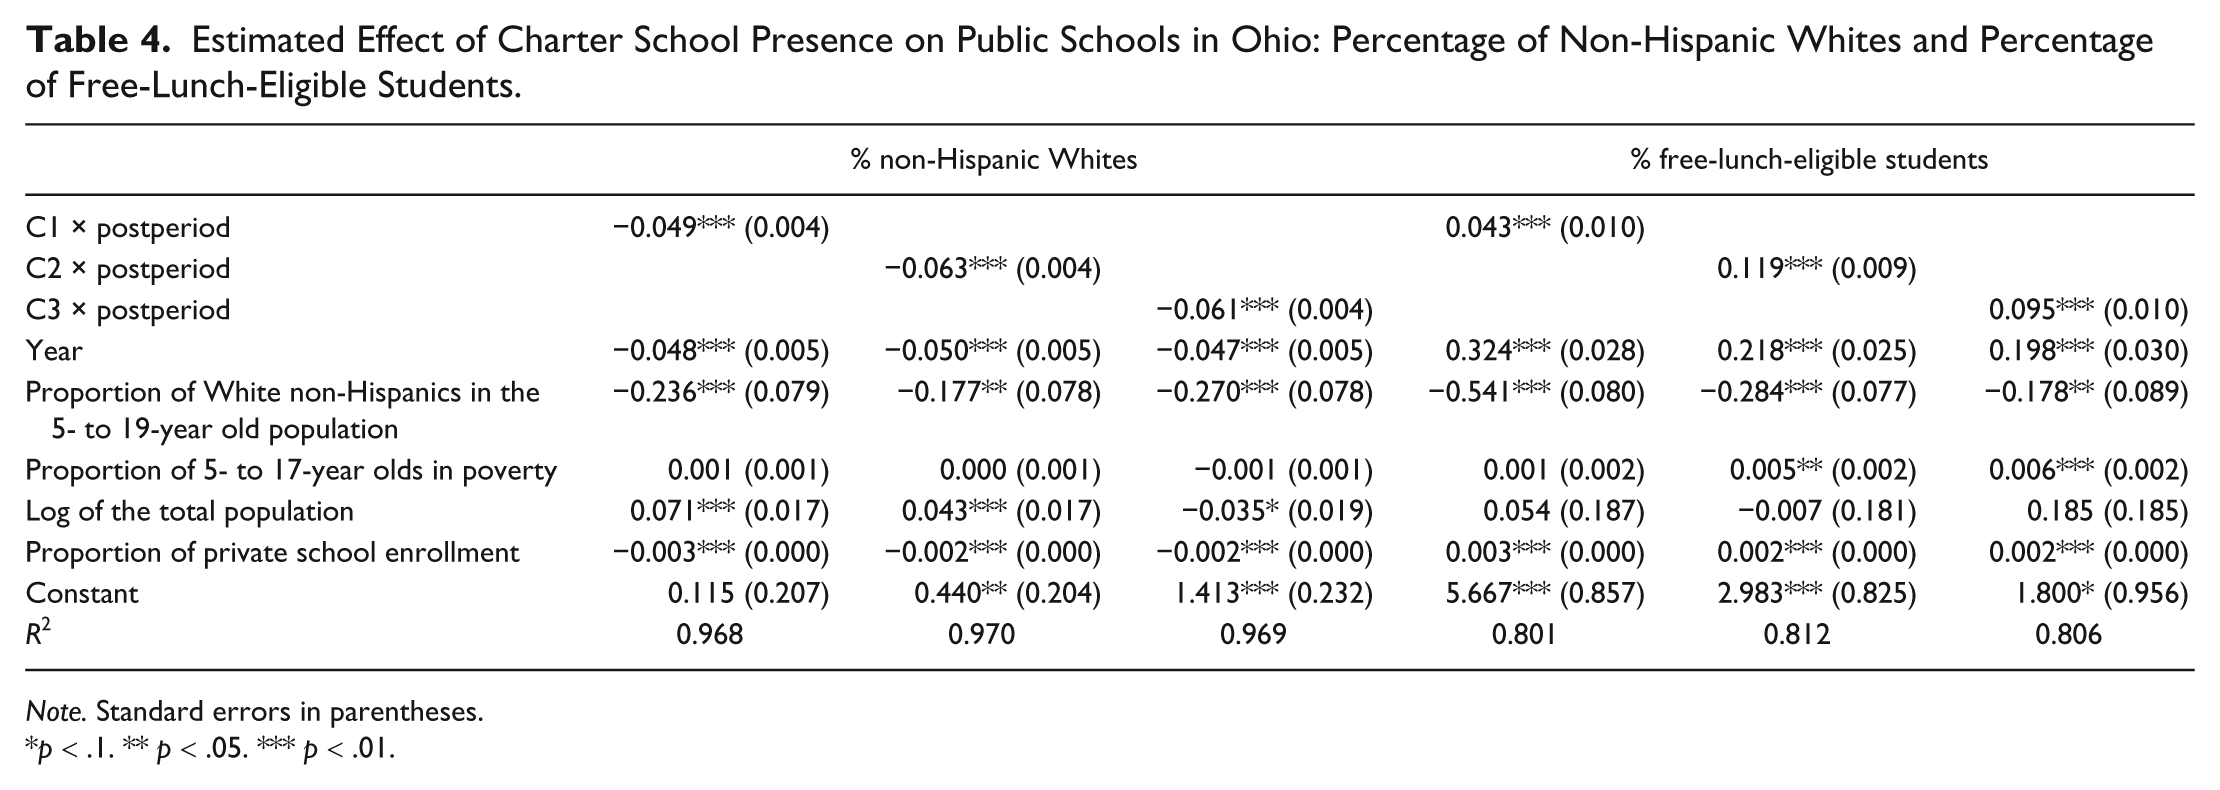
Note. Standard errors in parentheses.
p < .1. ** p < .05. *** p < .01.
Estimated Effect of Charter School Presence on Public Schools in TEXAS: Percentage of Non-Hispanic Whites and Percentage of Free-Lunch-Eligible Students.

Note. Standard errors in parentheses.
p < .1. ** p < .05. *** p < .01.
The regression results suggest that the existence of charter schools contributed to the reduction of the share of non-Hispanic White students in traditional public schools that face charter competition in both states. The size of the effect and the sensitivity to the competition measure varies across states, but the overall negative effect remains significant across models. The initial differences in the means for Ohio schools show the largest change in the share of non-Hispanic Whites in public schools with a decline of 6.2 percentage points. With the addition of county-level controls, the size of the effect is reduced to 4.9 percentage points but remains significant. For the schools that experience direct competition within a 5-mile radius, the share of non-Hispanic White students is reduced by 7.6 percentage points. With the additional controls, the size of the coefficient is reduced to 6.3 but remains highly significant. In the models with the enrollment-based measure, the basic model shows a 6.7 percentage-point decrease in the share of non-Hispanic White students in the treatment group. The change reduces to 6.1 percentage points with the controls but remains highly significant.
In Texas, schools that have charter schools in their counties saw the non-Hispanic White percentages of their students drop by a statistically significant 6.5 percentage points more than schools in other counties. Introducing the county-level controls reduces the size of the coefficient to 4.3 percentage points, but the coefficient remains significant. Schools with charter schools within 5 miles saw the non-Hispanic White percentage drop 5.6 percentage points more than schools without competition that close. With control variables, we still observe a statistically significant 4.1 percentage-point reduction. The results with the enrollment-based specification also suggest that the introduction of charter schools reduced the share of non-Hispanic White students in traditional public schools by 4.2 percentage points even after controlling for changes in the county populations and demographics. In sum, for the racial composition outcome, all models show significant and negative effects.
The results from the free-lunch-eligible models are presented on the right sides of the tables. The results suggest that charter presence in these states is associated with the share of free-lunch-eligible students in traditional public schools, but the size and direction of the effect vary across states. The results for Texas show reductions in the share of free-lunch-eligible students in traditional public schools are in counties that experience heavier charter exposure. Relative to schools without charter schools in their counties, schools with one or more charters in their counties experienced approximately a 2.8 percentage-point drop in their share of free-lunch-eligible students. With the addition of county-level controls, the size of the effect actually increases to 5.1 percentage points and remains significant. In the models with the spatial measure, charter school presence again contributes to the reduction in the share of free-lunch-eligible students—by a statistically significant 1.9 percentage points—and with the additional controls, the effect size again increases modestly (compared with the first specification) to 2.9 percentage points. For public schools located in counties with above-median charter enrollment, with the addition of controls we observe a significant 4.2 percentage-point drop in the share of free-lunch-eligible students, which is similar to the results of the other models.
The results from the simple model for Ohio schools show that the charter school competition contributes to increases in the share of free-lunch-eligible students in traditional public schools. Even after controlling for demographic and socioeconomic changes, the size of the coefficient shows an increase of 4.3 percentage points for the county-level specification and 9.5 percentage points for the enrollment-based specification. Relative to other public schools, public schools with charter schools nearby experienced approximately a 12-percentage-point rise in their share of free-lunch-eligible students. This model produced the largest effect size among all models. In sum, all specifications show significant declines in the share of free-lunch-eligible students in Texas and significant increases in the share of free-lunch-eligible students in Ohio.
Discussion and Conclusion
Poverty and inequality are the biggest challenges facing urban public education today and promoting school choice has gained popularity across the country as a way to address these long-standing problems. Majority of the states now have hundreds of charter schools serving thousands of students, and advocacy groups are working to pass charter legislation in the remaining states and to modify existing legislation to allow for growth and success of these schools. As charter schools continue to proliferate around the country and to attract public and scholarly attention, their impact on the public education system comes to the forefront as a major public policy question. Many discussions of such system-wide effects revolve around the academic achievement issues; however, changes in the composition of the student body is another important dimension of system-wide effects created by the introduction of charter schools in the public education system. This study focuses on the racial and socioeconomic composition of students in traditional public schools in two states that have experienced a certain degree of charter competition in the last decade. The analysis provides additional empirical evidence on observed changes in student distributions by relying on a panel design and school-level data. The results based on these data consistently suggest that the introduction of charter schools is associated with changes in the share of non-Hispanic white students in traditional public schools in both states. The estimates from the race models are negative and robust at the county-level, spatial, and enrollment-based specifications, which is consistent with findings from previous research using data from other states. Charter presence measured in all three ways showed significant reductions in traditional public schools’ non-Hispanic White student populations, but the magnitude of the change generally increased in the models with the spatially more precise measure. The controls explained away some of the change and reduced effect size, but all coefficients still remained significant. The effect size ranged from 4.1 to 6.3 percentage points across models. The analyses show that charter school presence is associated with changes in the share of free-lunch-eligible students in traditional public schools during the time period of the study, but in different directions. The regression results showed that while the traditional public schools experiencing charter school competition more intensely saw a decline in their share of free-lunch-eligible students in Texas, but they experienced an increase in their share of free-lunch-eligible students in Ohio. These changes range between 2.9 and 11.9 percentage points.
These results do not suggest that charter schools would necessarily lead to additional segregation or concentration of certain types of students. The shifts identified in the models have shown a more complex aggregate impact than simple skimming. This suggests that the details of the legislation and implementation have the potential to minimize any unwanted sorting. Consequently, it is critical that we keep track of aggregate changes, especially as the observed associations are robust and sensitive to different measures and significant even after controlling for changes in the population and private school enrollments in the area. The current popularity of the charter schools is undeniable, yet as Frankenberg et al. (2011) stated “severe lack of essential data on charters is of concern. Basic questions about the extent to which charter schools enroll low-income and ELL students cannot be conclusively answered and represent major research and civil rights policy concerns” (p. 47). To create an inclusive school system and realize the integrative potential of charter schools, more research and systematic data collection, as well as cooperation and communication between charter school founders and operators, policy makers, and researchers are needed. Charter school reform is a complex policy that has very extensive repercussions on the public education system. No single study can fully characterize the systemic impacts created by charter schools in a conclusive manner. In this study, this complex phenomenon has been studied from a rather narrow empirical perspective, so it should be noted that this analysis merely points out a pattern, it does not explain it. If charter presence is systematically associated with declines in the enrollment of non-Hispanic White students in nearby traditional public schools, this may imply that some sorting is taking place in the face of charter competition; however, further research on the characteristics of the schools and the policies is needed to explain the underlying mechanisms as this study has certain limitations that need to be taken into account when considering the results. First, this study uses school-level data; therefore, it is important to interpret the results as average changes that do not apply to each individual charter school. Second, the analysis deals with only two states and cannot be generalized to other states, which may have entirely different experiences with charters. Third, carefully selected control variables and school-level fixed effects models utilizing the difference-in-differences estimation are used to address the influence of preexisting trends, but in evaluating complex policies involving individual choice, it is difficult to account for all sources of potential endogeneity. Keeping these constraints in mind, this study provides an empirical account of changes in the student composition of traditional public schools from two states that allow charter schools. These observed aggregate-level changes over a 14-year period put forward many questions and suggest interesting avenues for further research that may increase our understanding of the charter school effect. First, the effect sizes are pretty small, but that is expected as these schools are still a minor portion of the educational landscape. Charter schools may be still too few to create any substantial effect on the student distributions in the public school system. As the laws become more permissible and the number of charter schools increases, are we going to observe larger effects?
Second, why is there a decline in the average proportion of non-Hispanic White students served by traditional public schools in these states in the face of charter presence? State-level data presented earlier show that charter schools serve disproportionately more black students when compared with traditional public schools. If charter schools are not enrolling these White students, does this mean that the schools choose to locate in areas with already high levels of minority concentration and speed up the ongoing departure of non-Hispanic White families to other areas or private schools?
Third, while the traditional public schools in both states experienced reductions in their shares of White students, the changes in their levels of free-lunch-eligible students were in opposite directions. Can these dissimilar findings in different states be reflecting differences in educational histories, provisions in the legislations, and operation of charter schools in different states? If so, which aspects of legislation and operation explain the observed difference? One possible explanation is the now defunct 75% provision in Texas charter legislation. In 1995, the Texas Legislature passed laws allowing 20 open-enrollment charter schools, which increased to 100 by 1997 then eventually to 215 schools and an unlimited number of open-enrollment charter schools serving students at-risk of failure or dropping out of school. However, if a school enrolled 75% or more at-risk students, it qualified as a 75% Rule charter school and was not subject to the cap (Texas Center for Education Reform [TCER], 2002). This provision was eliminated in 2001, but the results regarding the share of free-lunch-eligible students in the models may reflect the transfer of the at-risk students from traditional schools to charters under the early 75% rule. Finally, why does the size of the effects, especially in the models investigating the changes in the share of free-lunch-eligible students, vary this much across states and measures? For example, why do we see the largest effects in Ohio schools that have charters in close proximity? Examining the landscape in Ohio, it can be observed that educational management organizations (EMOs) are very actively involved in the charter schools in the state (Hill & Lake, 2005). Previous research has shown that EMO-operated schools tend to be strongly racial segregative for minority and majority students as compared with the composition of the sending district (Miron, Urschel, Mathis, & Tornquist, 2010) and they seek out more Black students but are also focused on selecting fewer poor students than traditional public schools (Ertas & Roch, 2012). Could there be a relationship between the positive and large effect sizes and the possible inclination of some profit-oriented EMOs to serve fewer disadvantaged and costly students? What other policy variables such as racial balance provisions or transportation requirements in the charter school legislation have affected these patterns? As the charter schools proliferate, we can observe the effects in other states in future studies and hopefully discover differences in operation and legislation that lead to the most desirable and equitable outcomes.
Footnotes
Author’s Note
Opinions reflect those of the author and do not necessarily reflect those of the granting agencies.
Declaration of Conflicting Interests
The author(s) declared no potential conflicts of interest with respect to the research, authorship, and/or publication of this article.
Funding
The author(s) disclosed receipt of the following financial support for the research and/or authorship of this article: This research was supported by a grant from American Educational Research Association which receives funds for its “AERA Grants Program” from the National Science Foundation and the National Center for Education Statistics of the Institute of Education Sciences (U.S. Department of Education) under NSF Grant REC-0310268.
Notes
Author Biography