
Abstract
Radiologic findings of fungal sinus disease are generally opacification in paranasal computed tomography (CT) images. The Hounsfield unit (HU) is a standardized objective unit that is also suitable for measuring remodeling and opacifications on CT scans of bone sections of patients with chronic rhinosinusitis. We hypothesized that HU values could provide valuable information in isolated sphenoid sinus lesions before surgery. Between 2012 and 2019, 35 patients underwent functional endoscopic sinus surgery for sphenoid sinus lesions. Tissues obtained from the sphenoid sinus were divided into two groups, fungal and nonfungal, according to the findings of histopathologic examinations. HU values were measured in sphenoid sinus sections on paranasal CT scans of these two groups. Differences in mean and maximum HU values between the two groups were statistically significant (p < .05). The maximum HU values calculated from the sphenoid sinus were 435.08 and 196.23 (p ≤ .05) in the fungal group and nonfungal group, respectively. The mean HU values calculated from the sphenoid sinus were 64.31 and 29 (p ≤ .05) in the fungal and nonfungal groups, respectively. At the maximum cutoff value of 241, the sensitivity and specificity of the HU maximum were 84.6% and 77.3%, respectively. At the mean cutoff value of 41.5, the sensitivity and specificity of the HU mean were 76.9% and 86.4%, respectively. HU is an objective value used in radiographic density measurement. The HU values were higher in fungal lesions than in nonfungal inflammations, and they are useful in preoperative measurement.
Introduction
Underestimation of the extent of damage by invasive sphenoid sinus lesions (ISSLs) could result in catastrophic consequences to the relevant anatomy. An accurate diagnosis of sphenoid sinus lesions depends on histologic sampling. Imaging modalities such as computed tomography (CT) may provide valuable information for the differential diagnosis of ISSL before surgical intervention.
Osteitis is the inflammation of the sinus walls without the bone marrow that occurs with chronic rhinosinusitis (CRS). 1 One of the most beneficial noninvasive methods for the evaluation of osteitis in the paranasal sinuses is CT. In osteitis, each sinus wall (except those of the frontal sinus) appears to be more than 3 mm thick on CT images. 2 The increase of the sinus wall thickness is thought to be related to neo-osteogenesis, osteoclastic resorption, fibrosis, periosteal reaction, and Haversian canal changes.3,4 The Hounsfield unit (HU) is a standardized objective unit that is also suitable for measuring remodeling and opacifications on CT scans of bone sections of the patients with CRS.5,6 Numerous studies express the HU changes in patients with CRS.5,7,8 However, differences in HU values between fungal and other inflammatory sinus diseases have not been reported extensively.
The main aim of this study was to compare the HU values of unilateral fungal ISSLs with those of nonfungal ISSLs.
Material and Method
We used tissue samples from the sphenoid sinus in patients who underwent functional endoscopic sinus surgery because of ISSL between 2012 and 2019. The samples were classified into two groups according to the findings of histopathologic examination: with fungal disease (the fungal group) and without fungal disease (the nonfungal group). Fungal infection was detected with periodic acid–Schiff and Grocott stains to confirm fungal sinusitis in its different presenting forms and types. Patients undergoing revision surgery, those with bilateral ISSLs, those with diagnosed malignancies, and those who refused surgery were excluded. Axial and coronal sections of paranasal sinus CT and medical history records with histopathologic examination records were reviewed retrospectively. The study was approved by the institutional ethics committee.
High-resolution, unenhanced, multislice paranasal sinus CT was performed with collimation of 0.625 mm, 100 kV, and 80 to 140 mA; a rotation time of 0.5 s; and a field of view of 29.5 cm by a 64-slice multidetector CT scanner (General Electric LightSpeed VCT XTe; General Electric). To measure HU values, we calculated a region of interest by creating a circle on the soft tissue windows of the CT scan within the sphenoid sinus at the axial section of a paranasal sinus. Measurements were made in the widest part of the sphenoid sinus area in the axial section of CT. Minimum, maximum, and mean HU values were automatically calculated. The measurements were made by 2 otolaryngologists who were unaware of whether samples were fungal or nonfungal, and the mean of the 2 values in each case was used to analyze the data.
To compare categorical variables between the groups, we used the chi-square test. Continuous variables were calculated as means ± standard deviations with minimal and maximal values. To compare continuous variables, we used Student’s t-test and Fisher’s exact test. SPSS version 18.0 (SPSS Inc.) was used for statistical analysis. A p-value of <.5 was considered significant.
Results
This study included tissue samples and radiodense images of compact materials from 35 patients (an example is shown in Figure 1). Of these patients, 13 (37%) were male and 22 (63%) were female. The median age was 41.17 ± 15.94 years (range: 11-78 years). The area most commonly affected in the fungal group was the left sphenoid sinus; in contrast, the right sphenoid sinus was most commonly affected in the nonfungal group. The most frequent complaints were headache and facial pain in both groups. The distribution of the clinical parameters according to histopathologic results is shown in Table 1.

Axial section of paranasal sinus tomography, isolated sphenoid sinus pathology (left side) Hounsfield unit (HU) measurement values.
Clinical Parameters Among the Sphenoid Sinus Lesions.

The fungal genus most commonly identified in the fungal group was Aspergillus. Tissue inflammation caused by CRS was the most common histopathologic diagnosis in the nonfungal group. Histopathologic findings in sphenoid sinus lesions are shown in Table 2.
Histopathologic Findings in Sphenoid Sinus Lesions.

Mean and maximum HU values were higher in the fungal group than in the nonfungal group. The distribution of the HU values in the 2 groups is shown in Table 3. Differences in mean and maximum HU values between the two groups were statistically significant (p < .05).
Comparison of Hounsfield Unit (HU) Values Among the Groups.

At a maximum cutoff HU value of 241, the sensitivity and specificity of the HU maximum were 84.6% and 77.3%, respectively (Table 4 and Figure 2). At the mean cutoff value of 41.5, the sensitivity and specificity of the HU mean were 76.9% and 86.4%, respectively (Table 5 and Figure 3).
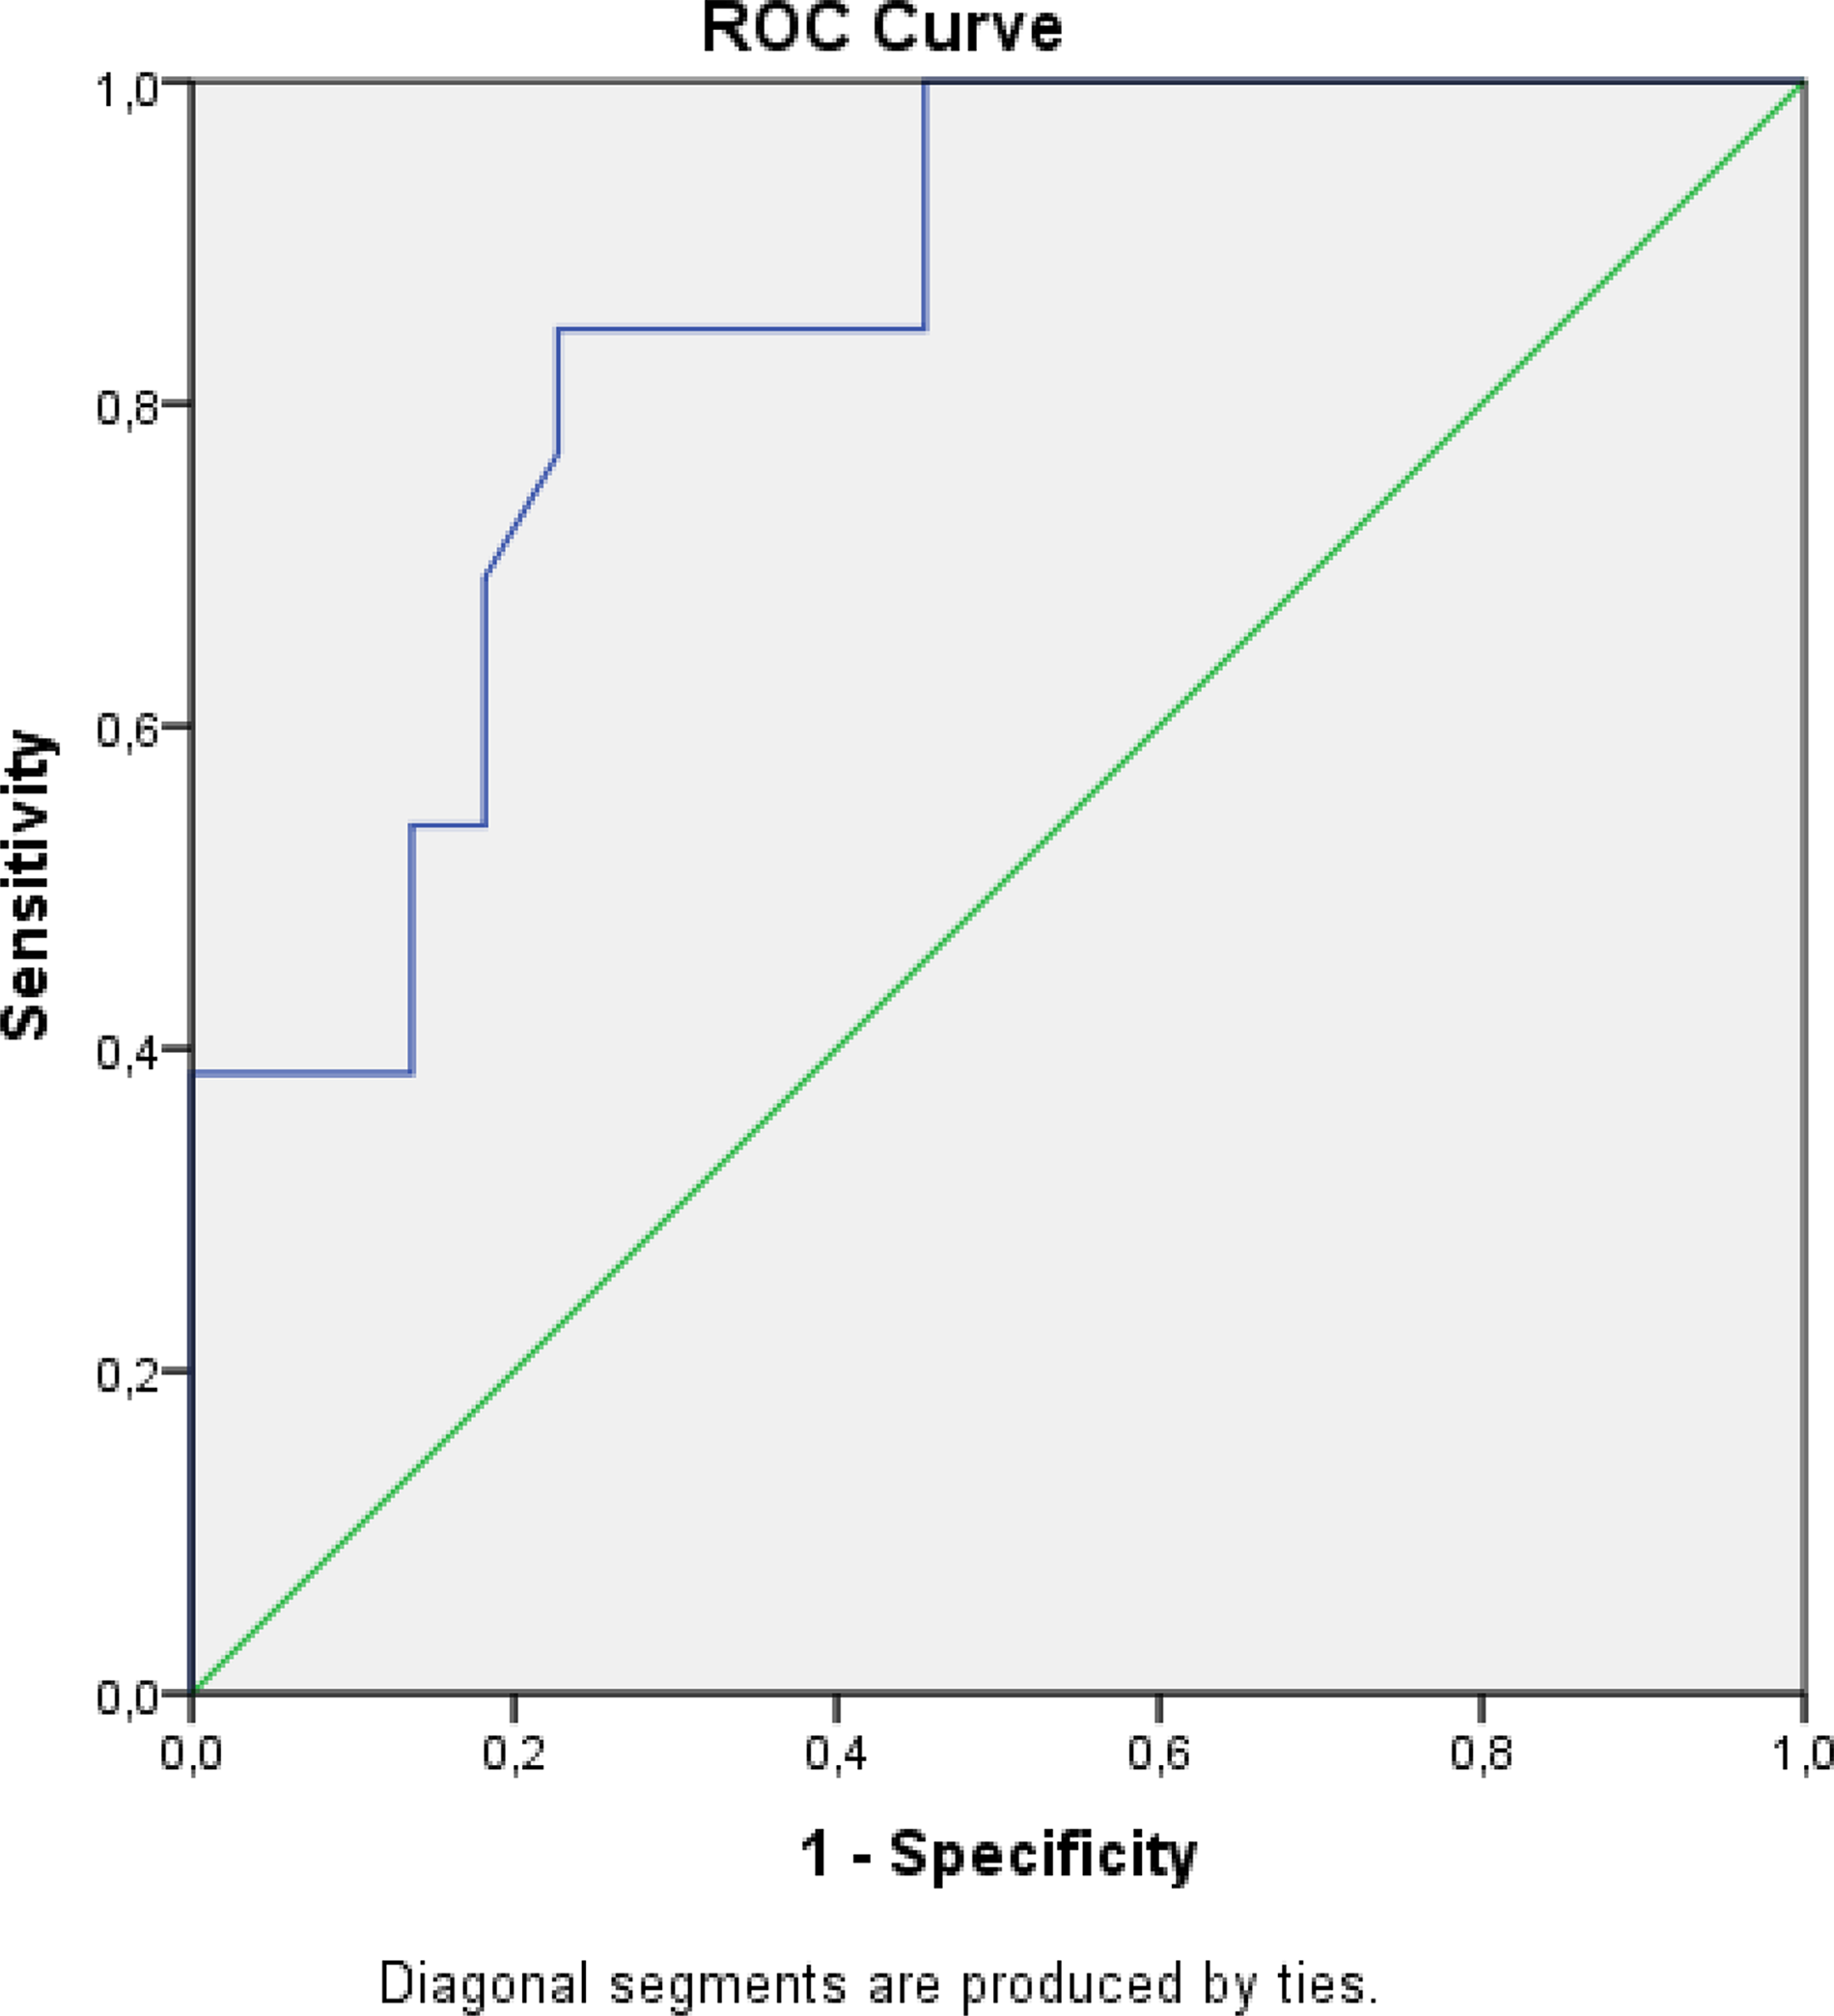
ROC curve analysis of HU maximum.
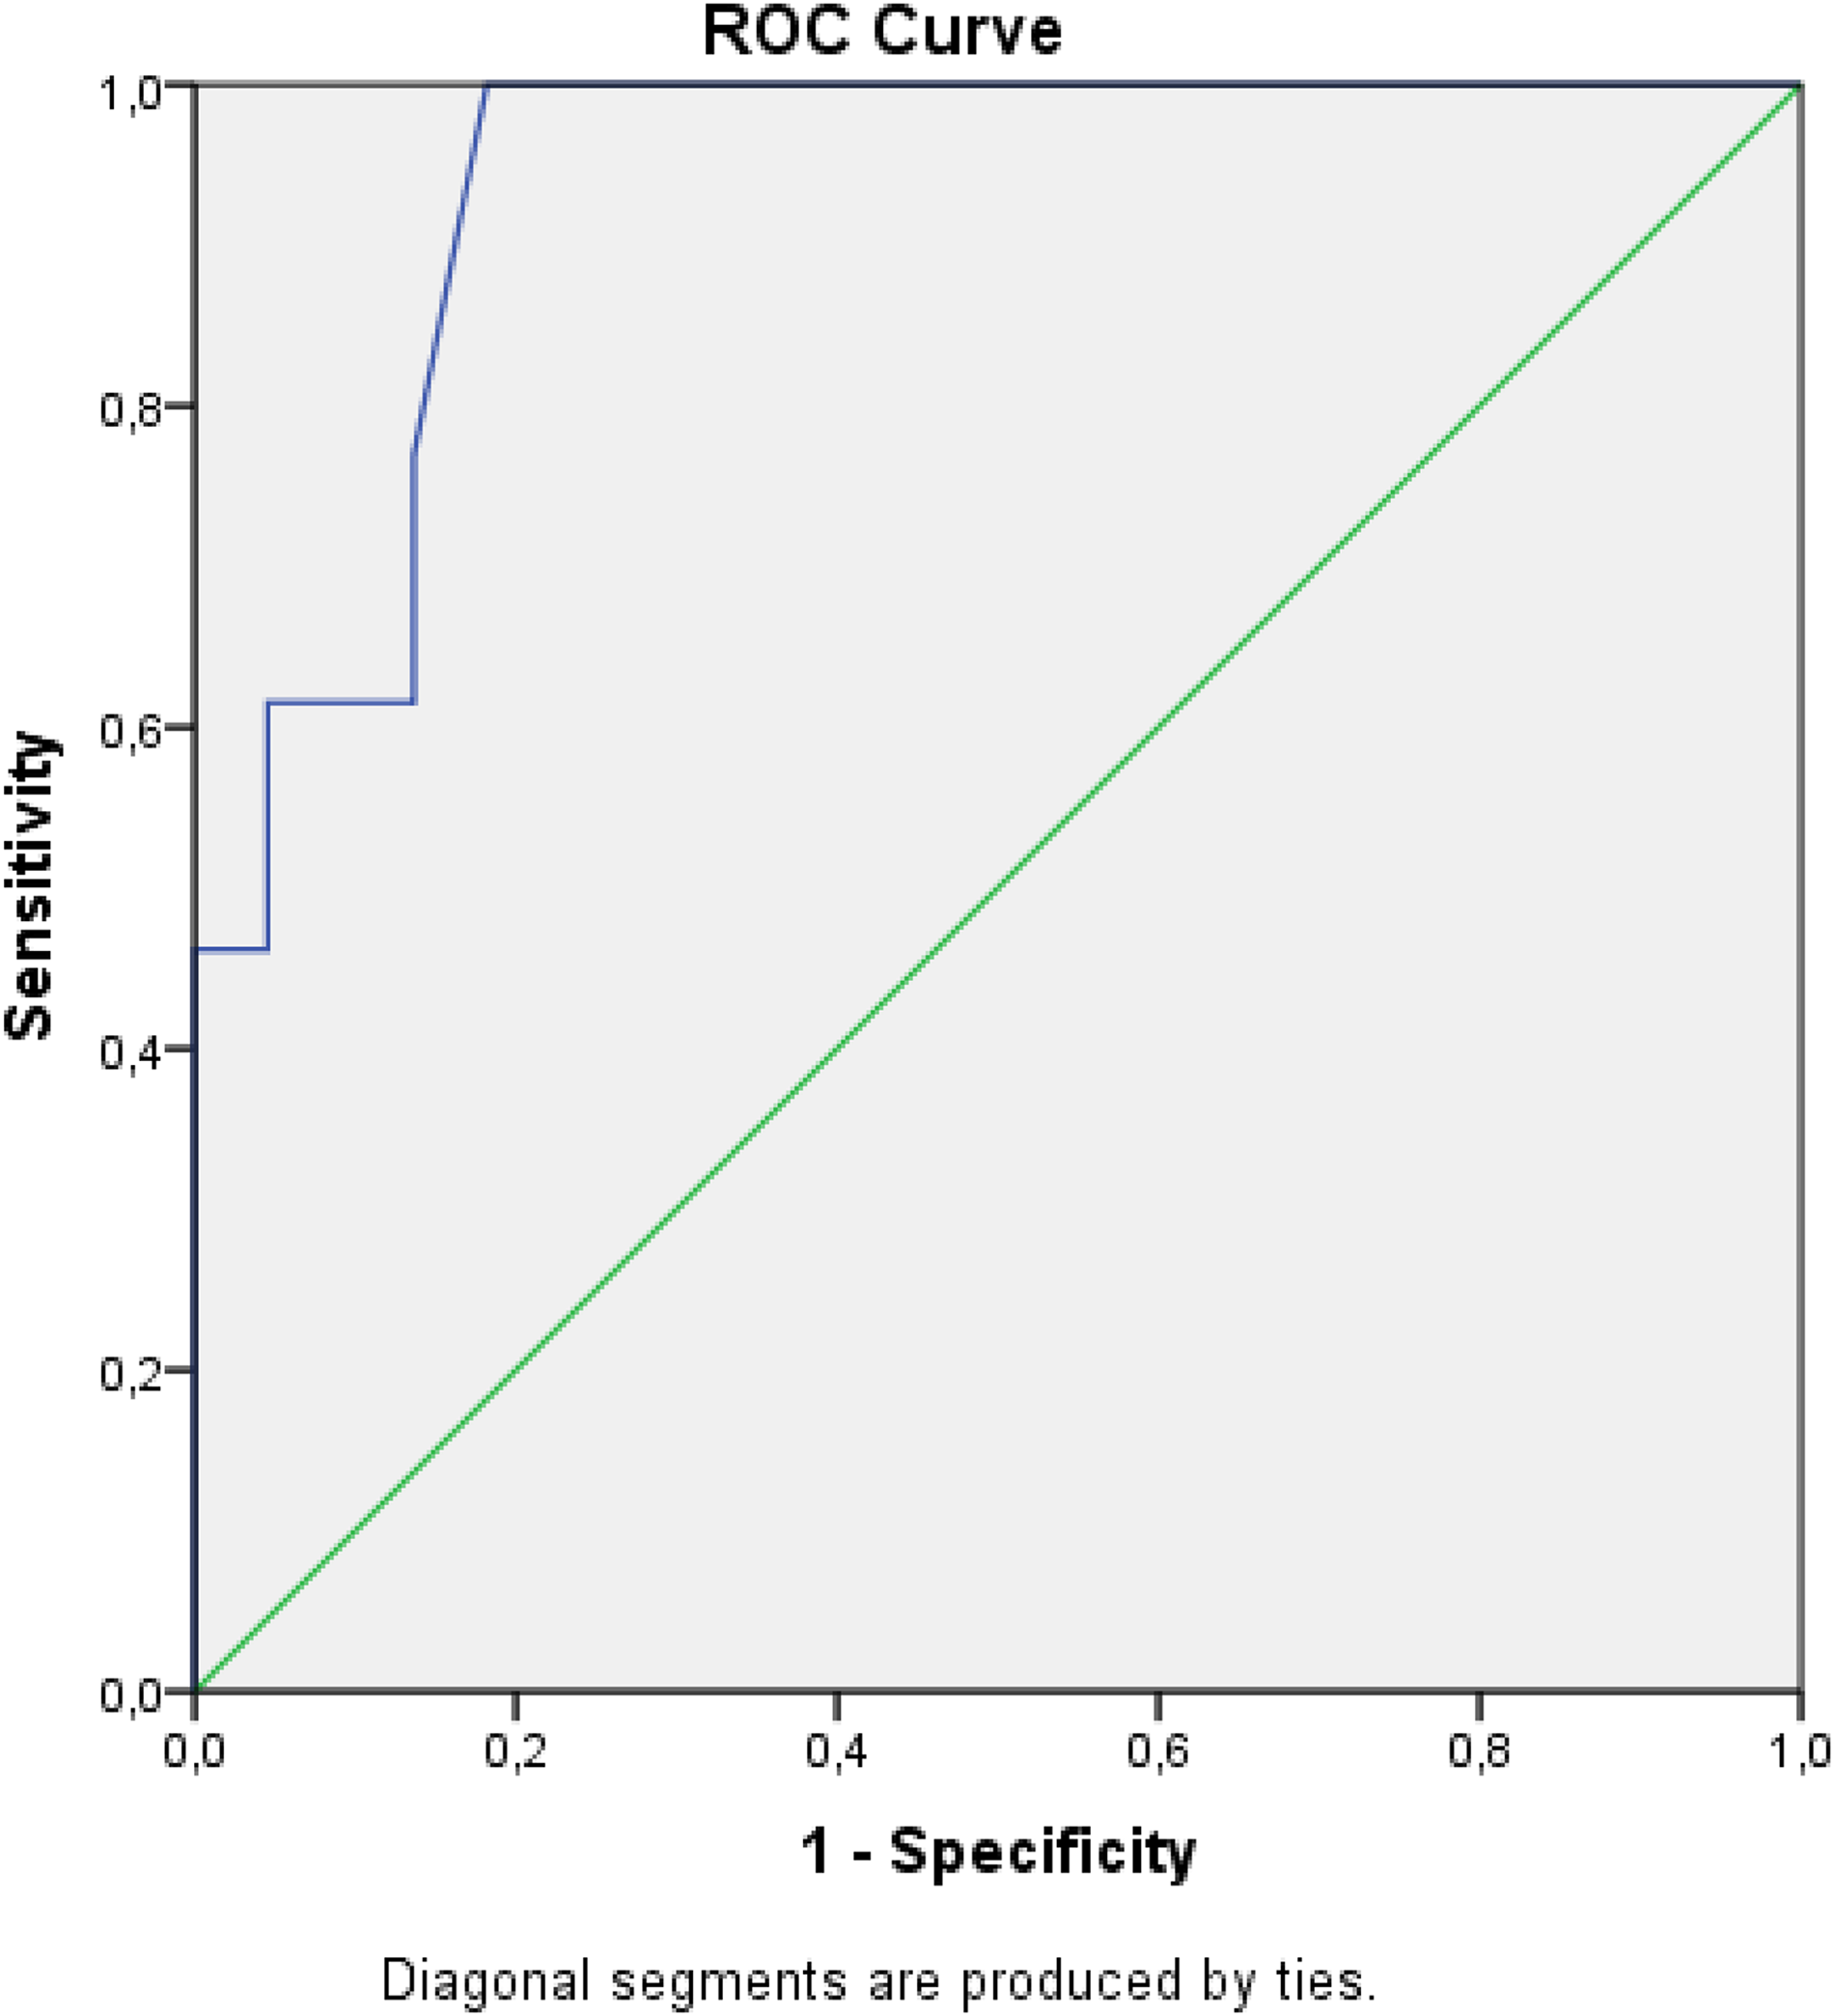
ROC curve analysis of HU mean.
Sensitivity and Specificity Values at Maximum HU Cutoff Value of 241.

Abbreviations: HU, Hounsfield unit; AUC, area under the curve; CI, confidence interval.
Sensitivity and Specificity Values at Mean HU Cutoff Value of 41.5.

Abbreviations: HU, Hounsfield unit; AUC, area under the curve; CI, confidence interval.
Discussion
High-resolution CT and magnetic resonance imaging (MRI) provide important information for the surgical plan prior to sinonasal surgery. 9 Radiologic findings for fungal sinus disease are often opacifications. 10 Invasive fungal lesions show T2 voids on MRI with corresponding CT opacification and foci of intrasinus or nasal fungal elements. These signal voids are centrally located. 11 In nearly 1 of every 8 patients with isolated sphenoid sinus opacifications, the diagnosis is fungal rhinosinusitis. 12 Sinus wall thickness enhancements, opacification inside the sinus, and sclerosis of the sphenoid sinus wall are thought to be related to fungal sphenoid sinusitis. 13 However, exact criteria for the differential diagnosis of sphenoid sinus lesions on computerized images have not been specified.
The main finding of this study is that HU values in fungal lesions are higher than those in nonfungal lesions at the sphenoid sinuses. Diseases that result in opacifications on images increase the HU levels in the affected tissues of distinct body parts.14,15 Emre et al 8 found that HU measurements in the maxillary sinus medial wall in patients with CRS were 200.2 ± 24.86. They also concluded that the HU values in the sinus wall in patients with CRS were lower than those in the control group as a result of the development of osteitis in CRS. On the other hand, Cho et al 5 concluded that HU values tend to increase in patients with increased mucosal thickening and sinus wall thickening. In our study, HU values were measured inside the sphenoid sinus lesion rather than in the sinus wall. Krennmair et al 7 conducted a similar evaluation of HU values inside the lesion. Interestingly, Krennmair et al 7 found HU values nearly 10 times higher than our findings. The discrepancy between their results and ours might be related to the fact that HU values in the maxillary sinus inferior wall and dental root are different from those in the sphenoid sinus; they might also be related to the degree of radiation exposure in CT. 16
With fungal lesions, sinus opacification is often associated with sclerosis of bone adjacent to the sphenoid sinuses on CT sections.17,18 The development of opacification and hyperdense foci in fungal lesions is thought to be related to zinc-oxide dental filling material, which favors fungal growth.19,20 However, this theory does not clarify the opacification of the fungal lesions in the sphenoid sinuses, which are relatively far from the dental margins. Regardless of the histopathologic mechanism, fungal infections at the sphenoid sinuses are thought to demonstrate higher HU levels. 7 According to another theory, the HU values on images are not strong predictors of fungal diseases. 21 However, in that study, the authors compared HU values in fungal sinus infections to allergic mucin components of nasal polyps, which are different from the samples that we used.
One of the limitations of this study is that the histopathologic samples from the paranasal sinuses did not enable us to determine a grading pattern. We measured simple objective density values; more complex quantitative measurements could improve the accuracy of diagnostic methods with imaging modalities. Another limitation was that we focused on HU values for fungal infections in general, rather than invasive and noninvasive fungal infections, because of our limited sampling.
Conclusion
The HU is an objective radiographic density measure. HU values in fungal lesions are higher than those in nonfungal inflammations. This is the first study to use the HU measurement in the surgery of isolated sphenoid sinus lesions. We think that this technique will be very useful for surgeons before surgery.
Footnotes
Declaration of Conflicting Interests
The authors declared no potential conflicts of interest with respect to the research, authorship, and/or publication of this article.
Ethical Approval
This study was approved by our institutional review board (Gaziantep University Clinical Research Ethics Committee, Permit Number: 2020/156).
Funding
The authors received no financial support for the research, authorship, and/or publication of this article.
Statement of Human and Animal Rights
The study adhered to good clinical practices and ethical standards.
Statement of Informed Consent
Informed consent form was obtained from all patients included in the study.