
Abstract
Keywords
Introduction
Hip fractures are an important public health problem and can cause a reduced quality of life and increased mortality 1 Hip fractures commonly occur among people over the age of 65 and, as the number of elderly people increases. In 2019, the number of people living with a disability is reached 2.9 million, and this number is expected to increase significantly over the years. 2 Trochanteric fractures accounted for 42% of all hip fracture types and 44% of the total orthopedic healthcare costs. 3
Currently, surgical fixation is the standard treatment for trochanteric fractures as it allows early mobilization, weight bearing, and functional recovery. Fixation devices for trochanteric fractures include extramedullary devices, and more recently, intramedullary devices.4-6
Although many different intramedullary devices have been developed for use in trochanteric fractures, osteosynthesis complications are still seen. The most common complication is cut-out, which is the screw/blade cutting through the femoral head.7-9 Risk factors for cut-out complications have been determined as tip-apex distance, reduction of quality, osteoporosis, Neck-Shaft angle, lag-screw positioning in the femoral head, and implant designs.10-12 The cut-out can be caused by modifiable factors, which includes tip-apex distance, Cleveland index, reduction quality, Neck-shaft angle (NSA), and implant types, and also non-modifiable variables such as osteoporosis, fracture type, and gender. 13 Schmitz et al suggests that there are differences in the likelihood of complications based on the lag screw designs and implantation techniques. 12
The aim of this study was to review our clinical experience with four proximal femoral nail fixation of trochanteric fractures to compare rates of implant cut-out between double lag screw PFN, wedge wing lag screw PFN, Helical blade PFN, and Integrated Dual Screw PFN.
The second aim of this study was to evaluate the most important predictive factors for cut-out such as age, sex, osteoporosis, NSA, TAD, the Cleveland Index and reduction reduction quality of Fracture.
We hypothesized that lag screw design will be associated with a high risk of cut-out as the some type of screws changes between the bone implant through the femoral neck and head during implantation.
Patients and Methods
Local Ethics Committee approval and informed consent from all the patients were obtained. A total 145 patients with trochanteric fractures who were treated with proximal femoral nails at between January 2015 and December 2018 were included in the study. The assessment of patients eligibility is presented in Figure 1. The study was conducted over a period of 12 months from January 2018 to January 2019. Patients Selection.
The operations were performed with the patients under general or spinal anesthesia in the supine position on a standard surgical table by four experienced surgeons. The proximal femoral nail had always been applied after anatomical reduction of trochanteric fractures under fluoroscopy intraoperatively.
The patients started to walk with a walking aid approximately 48 hours after surgery, firstly with toe-touch weight-bearing and then 6 weeks later with full weight-bearing. The patients were assessed clinically and radiographically at 1, 3, 6, and 12 months.
Inclusion criteria consisted of patients aged 65 years or older who underwent proximal femoral nail (PFN), due to intertrochanteric hip fracture. The exclusion criteria included patients younger than 65 years, those with pathological fracture, ipsilateral pelvic or knee fractures, subtrochanteric fractures, and multiple trauma cases. Additionally, demographic data, including patient gender, age and comorbidities, were collected and analyzed.
Radiographs were examined to assess osteoporosis, the fracture type, NSA, fracture reduction quality, the position of the screw within the head, TAD. Cut-out and union were assessed with the use of preoperative and postoperative A-P and lateral radiographs and, in some cases of multifragmentary fracture, for an understanding of the subtrochanteric extension fracture, computer tomography (CT) was used.
Fractures were classified according to the AO/OTA classification system as trochanteric (31A); stable (A1), unstable (A2), and transverse or reverse oblique (A3). 14 NSA was measured on the AP pelvis radiograph as the angle between a line bisecting the femoral neck/head and a line down the center of the femoral shaft. 10
BMD scores were recorded for all patients using DEXA and classified as severe, mild, or normal for osteoporosis. 15 Patients who had been screened for osteoporosis within 1 year prior to surgery did not undergo DEXA, while those who had not been screened within 1 year prior to surgery underwent DEXA.
The quality of the reduction of the fracture that was achieved intraoperatively was assessed on the basis of the displacement and alignment of the fracture as seen on the postoperative radiographs. The quality of the reduction of the fracture was categorized as good, acceptable, or poor according to the definitions of the three-grade classification system proposed by Baumgaertner et al. 16 The displacement criteria was satisfied if there was less than a 4-mm - displacement of the fracture fragments on the AP and lateral radiographs. The angulation criteria was met if the neck shaft angle was normal or slightly valgus (130°-150°) and there was less than a 20° angulation on the lateral radiograph. The quality of the reduction of the fracture was considered as good if both criteria were met, acceptable if only 1 was met, and poor if neither was met. 16
The location of the screw/blade within the head was recorded as per the Cleveland method. This method divides the femoral head into nine separate zones, with three zones on the anteroposterior radiograph (superior, central, and inferior) and three zones on the lateral radiograph (anterior, central, and posterior). The screw/blade can be located in any of these zones.17,18
The TAD was used to describe the position of the screw. The TAD is defined as the sum of the distance in millimeters from the tip of the screw/blade to the apex of the femoral head on AP and lateral views. 18 All measurements was performed by the first author, experienced surgeon.
All postoperative radiographs of the patients were reviewed to identify implant cut-out. A Cut-out is defined as the protrusion of the implant outside the femoral head on any radiographic view. 19
Radiographs and the relevant measurements were evaluated with the aid of the Picture Archiving and Communication System (PACS).
Features of the Different Implants and Selection
A double lag screw PFN (the parallel lag screw 6.5 mm diameter, 127°), A wedge wing lag screw PFN nail,
20
A helical blade PFN,
21
An integrated Dual Screw PFN
22
was selected. All types of implants are presented in Figure 2. Implant selection was not based on predefined criteria such as fracture type or patient characteristics. In the early years of the study, helical blade PFNs and integrated double screw PFNs were randomly used, whereas in later years, double lag screw and wedge-wing PFNs were utilized. This variation was influenced by implant availability rather than a standardized institutional protocol. (A) Wedge-Wing PFN: Preoperative, Postoperative, and 3-Month Follow-Up Radiographs. (B) Integrated Dual Screw PFN: Preoperative, Postoperative, and 3-Month Follow-Up Radiographs. (C) Double-Lag Screw PFN: Preoperative, Postoperative, and 3-Month Follow-Up Radiographs. (D) Helical Blade PFN: Preoperative, Postoperative, and Final Radiograph Demonstrating Cut-Out Complication.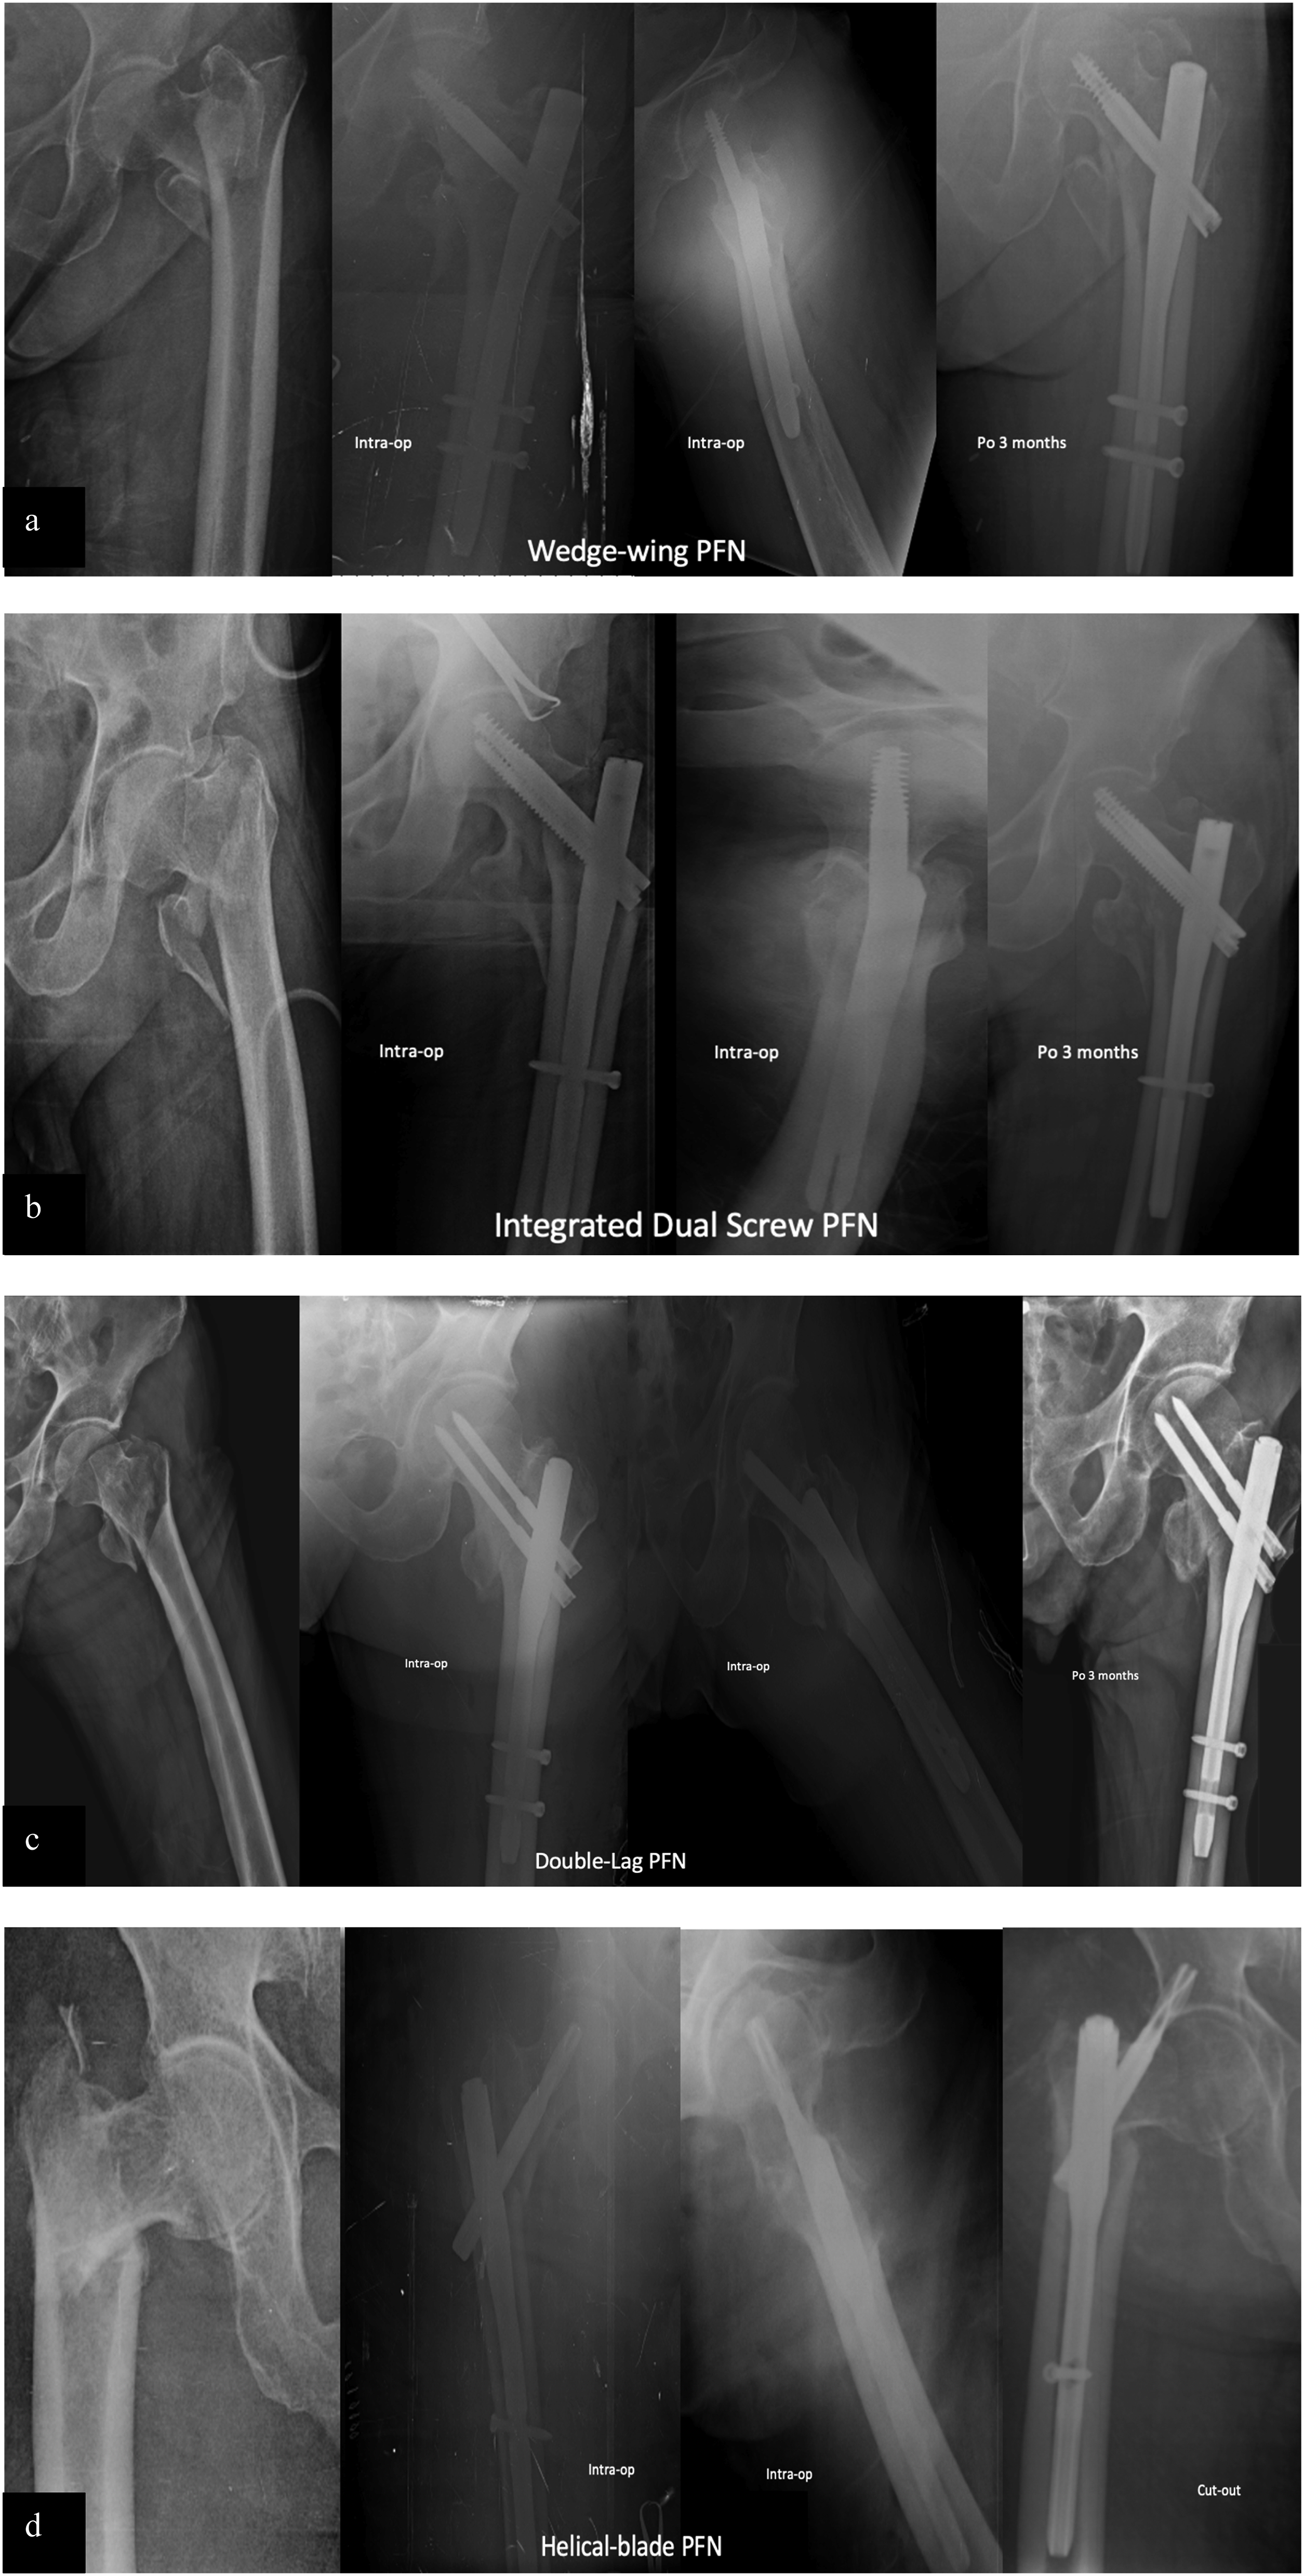
Statistical Analysis
All statistical analyses were performed using SPSS software (version 21.0, IBM Corp, Armonk, NY, USA). The normality of continuous variables was assessed using histograms, probability plots, and the Kolmogorov-Smirnov/Shapiro-Wilk tests. Descriptive statistics were presented as mean ± standard deviation (SD) for normally distributed data and median (min-max) for non-normally distributed data.
Comparisons of categorical variables were conducted using the Chi-Square test. For comparisons of non-normally distributed continuous variables between two groups, the Mann-Whitney U test was used. Receiver Operating Characteristic (ROC) analysis was performed to determine the predictive value of numerical variables such as Tip-Apex Distance (TAD) and Neck-Shaft Angle (NSA) for implant cut-out. To identify independent risk factors for cut-out, logistic regression analysis was performed, including univariate and multivariate models.
A post-hoc power analysis was conducted using G*Power software (version 3.1.9.7, Heinrich Heine University, Düsseldorf, Germany) to evaluate the statistical power of the study. The achieved power values were as follows: Chi-Square test: 0.9999, Mann-Whitney U test: 0.49, and Logistic Regression: 1.0.
Results
Demographic and Clinical Assessment of Cut-Out.

p<0.05 statistically significant.
The percentage of those with poor fracture reduction quality was determined to be statistically substantially higher in the helical blade group, at 42.9%, compared to 5.7% in the double lag PFN group, 6.9% in the wedge wing nail group, and 6.5% in the Integrated dual lag PFN group. Cut-out was observed to have occurred in 8.6% of those with double lag PFN, 38.1% of those with a helical blade PFN, and 5.2% of those with a wedge wing PFN (P = .0001).
The risk analysis of variables that may lead to cut-out formation was performed by univariate and multivariate regression analyses. The Cleveland Index, fracture reduction, TAD total, and early and late NSA cut-out were considered to be predictive factors. Patients who had a poor Cleveland Index were 5.396 (95% CI: 1.437-20.270) times more likely to develop cut-out than those with an acceptable Cleveland Index. The risk of cut-out was 177 600 (95% CI 19 059-1 654 944) times higher in individuals with poor fracture reduction quality compared to those with good fracture reduction quality. It was discovered that a one-unit increase in total TAD multiplied cut-out development by 1.21 times (95% CI: 1.105-1.306). Those with early NSA of <130° were 13 609 (95% CI 1.730-107.057) times more likely to develop cut-out than those with early NSA of ≥130°. Those with a late NSA of <130° had 14.468 (95% CI 1.839-113.816) times higher risk of developing a cut-out than those with a late NSA of ≥130°. The Cleveland Index, TAD, NSA early, and NSA late variables were included in the multivariate regression analysis. It was established that a 1-unit increase in the TAD value increased the cut-out risk by 1.334 times (95% confidence interval: 1.156-1.538) in model 1, and 1.345 times (95% confidence interval: 1.160-1.560) in model 2. In Model 1, those with early NSA ≤130 had a 93 912-fold (95% CI 3.767-2341.022) risk of developing cut-out compared to those with ≥130. In Model 2, those with a late NSA ≤130 had the cut-out risk of 107 506-fold (95% GA 4.039-2861 822) compared to those with ≥130.
Predictive Factors for Cutout.

p<0.05 statistically significant.
Risk Factor Combinations of Cut-Out.
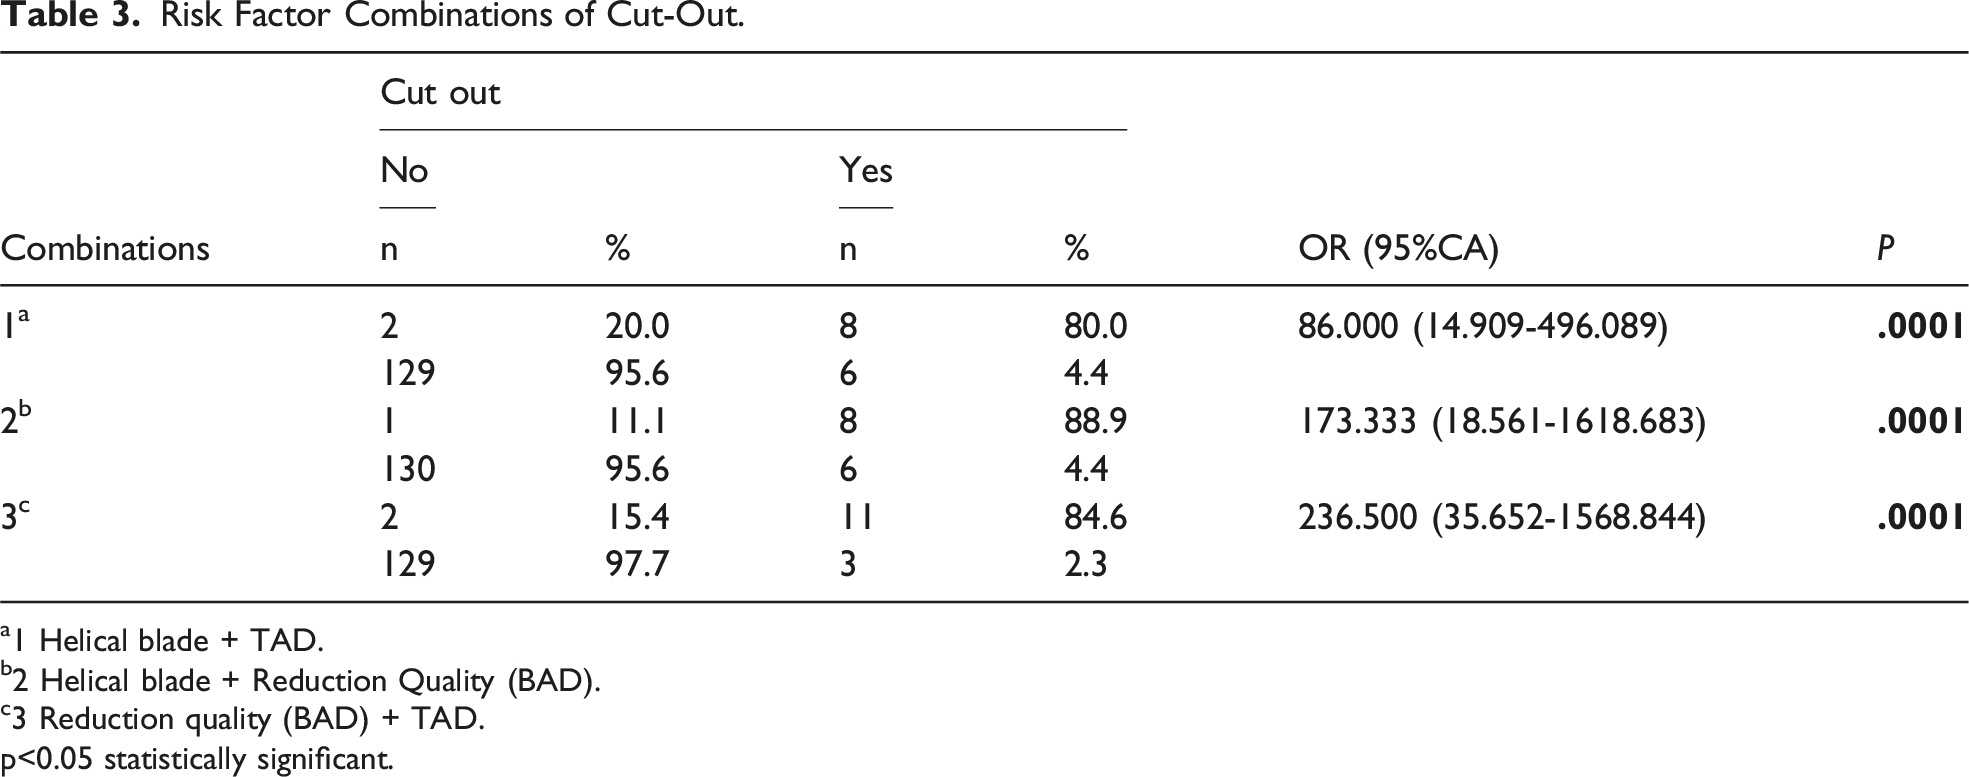
a1 Helical blade + TAD.
b2 Helical blade + Reduction Quality (BAD).
c3 Reduction quality (BAD) + TAD.
p<0.05 statistically significant.
The ROC curve analysis was used to investigate the diagnostic decision-making possibilities of the TAD total value in predicting cut-out development. The TAD total value cut-out value for predicting the risk of developing cut-out was determined to be 28.70 mm, with a sensitivity of 85.7% and a specificity of 77.8%.
The ROC curve analysis shows that early NSA has a cut-out predictive angle. The cut-off value of the early NSA for predicting the risk of developing cut-out, with a sensitivity of 85.7% and a specificity of 68.8%, was determined to be 126.50°.
The ROC curve analysis for late NSA determined a cut-out predictive angle. The cut-off value of late NSA for predicting the risk of developing cut-out, with a sensitivity of 85.7% and a specificity of 87.0%, was determined to be 120.5°.
Discussion
The study’s most significant finding is that the most dangerous combination of cut-out is poor fracture reduction quality with high TAD. Among risk factors, fracture reduction quality was the most critical, followed by TAD, late NSA, early NSA and the Cleveland index, respectively. While previous studies have identified TAD, reduction quality, the Cleveland index and NSA as predictors for cut-out complications, 23 they have not established a ranking of risk factors or emphasized the most hazardous combination.
The helical blade PFN had a significantly higher rate of cutout complications among the four PFNs studied (double lag PFN, wedge wing lag PFN, integrated double lag PFN, and helical blade PFN). Cut-out was observed in 14 of 145 patients (9.6%), experienced cut-out, with 8 patients specifically linked to poor fracture reduction quality and increased TAD in helical blades. Although some may consider this surgical technique inadequate, experienced trauma surgeons at our clinic performed these procedures. We observed loss of reduction during implantation and high TAD in procedures performed after anatomical reduction was achieved. Additionally, the reduction loss observed during the follow-up period highlights the importance of implant-related problems (rotational movement of the helical blade during implantation).
However, it is difficult to determine which PFN type is the most hazardous in terms of causing cut-out due to the presence of numerous confounding factors and lack of homogeneity between PFN types.
Age, sex, osteoporosis and fracture classification were not found to be a predictor of cut-out, verifying previous reports. 24
Fuse et al 25 claimed that PFN types for severely osteoporotic bones were crucial and that performing the rotating movement with a helical blade PFN might have resulted in reduction loss, and thus this type of PFN should not be recommended for severely osteoporotic trochanteric fractures. However, our study highlights that even in patients with normal bone density, helical blade PFNs exhibit a higher complication rate. This may be attributed to rotational and compression movement during lag screw advancement, which reduces bone contact in the femoral head and neck, ultimately causing reduction loss.
According to certain recent studies, the rate of cut-out using helical blades has increased in comparison to integrated dual lag PFNs.26,27 Several cohort studies have considered that the cause for the increase was not connected to the helical blade, but due to technical errors.9,28 Schmitz et al 12 showed that mechanical failure was not related to the learning curve but was connected to the implant design. Our clinical observations in treating trochanteric fractures align with these findings. Specifically, the helical blade’s impaction and rotational movement may result in compromised bone-implant integration, resulting in micro-instability and the formation of a gap around the implant, which could predispose it to mechanical failure.
Wang et al 29 determined a case of implantation failure of a helical blade that had caused a compression issue, which is another disadvantage of the use of helical blades. A similarity was reported in Chapman et al 30 that emphasized the problem of inadequate technical ability.
Another study that investigated the radiological differences between helical blades and lg-screw devices reported that helical blades were at fault. 27 Stern et al 26 did not investigate reduction quality and did not mention any reduction loss after helical blade application. However, in our study, we have stated that sometimes the blade type is to blame for cut-out complications. Stern et al 26 identified a critical TAD cut-off range <20 mm or >30 mm for cut-out risk. Our study refined this threshold to 28.7 mm, demonstrating that each 1 mm increase beyond this value elevates the risk of cut-out by 1.21-fold. Two prior meta-analyses compared helical blade extramedullary implants31,32 and Kim et al 33 discussed lag-screw and helical blades. All three studies show clinical differences but not a statistically significant difference. Ibrahim et al 9 had a large number of patients but this study did not apportion blame to the helical blade. Many more prospective randomized studies and meta-analyses are required to provide clearer findings on whether helical blade type PFN does a greater risk of complications.
In the univariate logistic regression analysis, modifiable factors such as TAD, the Cleveland Index, and a reduction of quality were found to be directly connected to mechanical complications.34-36 In addition, the helical blade had an increased risk of cut-out complications compared to the other three types of PFN.
Tip-Apex ROC Curve for Predictive Cut-Out.
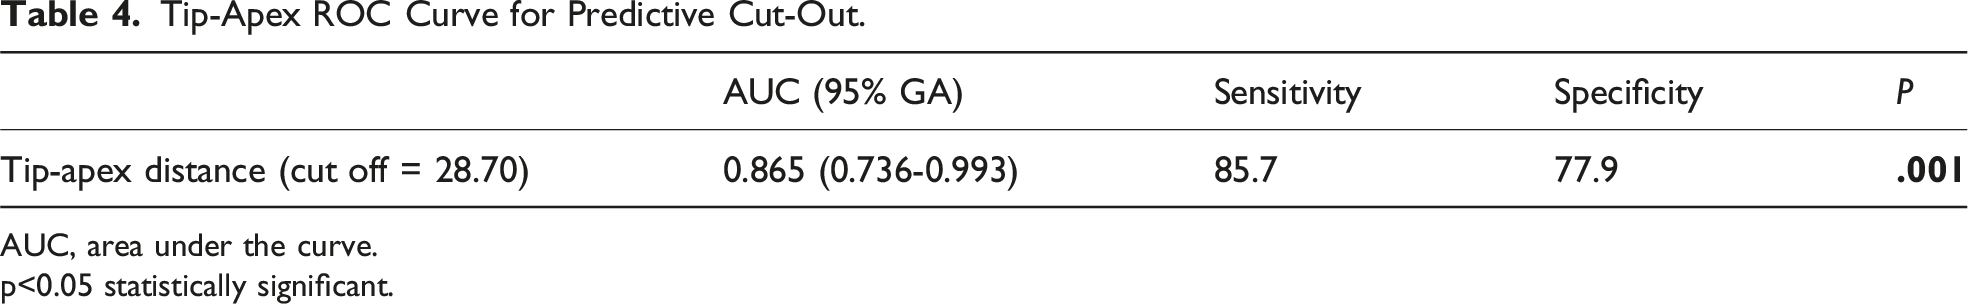
AUC, area under the curve.
p<0.05 statistically significant.

ROC Curve Demonstrating the Diagnostic Performance of the Model. The Area Under the Curve (AUC) is 0.865, Indicating Strong Discriminative Ability. The Optimal Cut-Off Value is Determined as 28.7 mm for TAD.
In this study, the importance of reduction quality was demonstrated by the 177.000-fold increase in cut-out complication compared to those with poor reduction quality, Şişman et al 10 showed a 57.917-fold. This emphasizes the significance of assessment using intraoperative fluoroscopy and early postoperative X-rays. If an inadequate reduction is observed, a change in early surgical technique or even arthroplasty may be recommended over an intramedullary implant. 42% of patients with a helical blade showed poor reduction quality due to implantation failure when the impaction blade to head fracture reduction was displaced. A couple prior studies have determined the poor reduction as an increase in cut-out complications.41,42
Early NSA ROC Curve for Predictive Cut-Out.

AUC, area under the curve.
p<0.05 statistically significant.

ROC Curve Demonstrating the Diagnostic Performance of NSA Early. The Area Under the Curve (AUC) is 0.696, Indicating Moderate Discriminative Ability. The Optimal Cut-Off Value for NSA Early is Determined as 126.5°.
Roc Curve Late NSA for Predictive Cutout.

AUC, area under the curve.
p<0.05 statistically significant.

ROC Curve Demonstrating the Diagnostic Performance of the Model. The Area Under the Curve (AUC) is 0.893, Indicating Strong Discriminative Ability. The Optimal Cut-Off Value is Determined as 120.5 mm for NSA Late.
The current study has shown that poor Cleveland zone positioning had a 5.396 times greater risk for cut-out than placement in an acceptable Cleveland zone. Güven et al 44 determined anteriorly and superiorly positioning of the Cleveland zone with an acceptable reduction quality that had a risk of cut-out, but this was described with a Dynamic hip screw. Parker et al 45 determined the increased risk of cut-out with superiorly and posteriorly screw placement, while Turgut et al 46 demonstrated the decreased risk of cut-out with posterior inferior screw placement. Mao et al 47 emphasized that the position and direction were distinct concepts, and also described the axis-blade angle (ABA), between the helical blade axis and the femoral neck axis on anteroposterior and lateral views and reported that placing the helical blade towards the anterior or superior direction was a predictive factor for cut-out.
The objective of this study was to investigate the cause of the high cut-out rate in proximal femur fractures treated with PFN. However, in 8 out of 14 patients with cut-out, helical blade PFN was implanted. It is speculated that the minimal gap between the femoral head and the helical blade lag screw is the reason for the high cut-out rate in our study. Notably, these complications were observed in bones that did not have osteoporosis.
The study has limitations due to its retrospective design, which means that confounding is likely to be present. Notably, although fracture types were matched for a subset of baseline characteristics, unmeasured covariates may still differ. For instance, disparities in fracture types, implant selections and intra-surgeon differences cannot be ruled out. This potential source of bias seems to be restricted as it was reached by agreement among all orthopaedic surgeons during weekly trauma meetings throughout the entire study period, thereby preventing individual surgeon assessments.
Second limitation of the this study is that all measurements were performed by the first author, an experienced orthopedic surgeon. While efforts were made to standardize the measurements based on previously published methods, the lack of interobserver validation may introduce measurement bias.
Third limitation of the study was for the Mann-Whitney U test, the power was 0.49, suggesting a lower sensitivity in detecting differences between specific groups. These results highlight that while the overall study design had sufficient power for categorical and nonparametric group comparisons, the ability to detect smaller differences in pairwise nonparametric analyses was more limited. This limitation has been acknowledged in the discussion section.
Conclusion
Whenever applying a proximal femoral nail with a helical blade to treat trochanteric fractures, 1 should pay particular attention to predicted factors such as TAD, NSA, fracture reduction, and the position of the Lag screw’s head. If loss of fracture reduction or an unacceptable TAD is observed when using a helical blade, a correction must be done or an alternative proximal nail must be employed. Furthermore, anatomical reduction must be tried, and the TAD must be maintained below 28.7 mm.
Footnotes
Acknowledgements
We would like to thank the subjects included in the current study. We would like to dedicate this study to the memory of our esteemed mentor and respected Prof.Dr Akın Turgut, who passed away during the publication process. His invaluable guidance, dedication to the field, and contributions to our clinical practice have left a lasting impact. His legacy will continue to inspire us in our future work.
Statements and Declarations
Author contributions
Aytek Hüseyin Çeliksöz and EroL Göktürk collaborate on article design and writing, Aytek Hüseyin Çeliksöz and Akın Turgut handles data collecting and analysis, Akın Turgut helps with all patients follow-up, Akın Turgut and Nusret Köse handles with article editing and proofreading. All authors have read and approved the final manuscript, and these four authors all contributed equally to this work.
Funding
The authors received no financial support for the research, authorship, and/or publication of this article.
Conflicting interests
The authors declared no potential conflicts of interest with respect to the research, authorship, and/or publication of this article.
Data Availability Statement
The data and materials are available from the medical records Eskişehir Osmangazi University Orthopaedics and Traumatology Department. The datasets used and analyzed during the current study are available from corresponding author on reasonable request.