
Abstract
Objective:
To investigate the prevalence of obesity with low muscle mass and its impact on physical function, quality of life (QOL) and pain in patients with end-stage knee osteoarthritis over 65 years old.
Methods:
In this cross-sectional study, we assessed a total of 562 patients. After separating the group into males and females, we divided patients into 4 further groups: normal BMI with normal muscle mass, obesity with normal muscle mass, normal BMI with low muscle mass and obesity with low muscle mass. All patients completed stair climbing test (SCT), 6-minute walk test, timed up and go test (TUG), instrumental gait analysis, Western Ontario McMaster Universities Osteoarthritis Index, VAS, and EuroQOL 5 dimensions questionnaire.
Results:
Obesity with low muscle mass was diagnosed in 6 males subjects (7.8%) and 9 female subjects (1.9%). Patients with obesity and low muscle mass performed the SCT-ascent and descent significantly slower than other body composition groups in both males and females. TUG in males and gait speed in females were also significantly slower in the obesity with low muscle mass group. Stepwise multiple linear regression analysis revealed that in males, obesity with low muscle mass was significantly predictive of SCT ascent (β = 0.409, p < 0.001), SCT-descent (β = 0.405, p < 0.001), and TUG (β = 0.283, p = 0.009), and in females, obesity with low muscle mass was significantly predictive of SCT-ascent (β = 0.231, p < 0.001), SCT-descent (β = 0.183, p < 0.001), and gait speed (β=-0.129, p = 0.004).
Conclusions:
This study confirms that the combination of obesity and low muscle mass is associated with impaired physical function in patients with end-stage knee osteoarthritis.
Introduction
Osteoarthritis (OA) of the knee is a major cause of disability in the elderly. In patients with knee OA, various comorbidities are present, including poor physical function, pain, and reduced quality of life (QOL). 1,2
There are several risk factors for knee OA, including obesity. 3,4 Obesity is associated with the development of knee OA, 5 and after total knee arthroplasty (TKA) surgery, deep prosthetic infections and wound complication are more prevalent in obese patients. 6 In knee OA patients, obesity has negative effects on mobility, pain and self-efficacy. 7 Due to the adverse effects of obesity on recovery in people with OA, patients may be advised to lose weight before TKA; however, losing weight before surgery can increase infection. 8
Sacropenia, as well as obesity, is an important factor for knee OA patients. With sarcopenia, functional impairment and disability tend to increase, 9 which can lead to physical disability, falls, and mortality. 10 Vlietstra et al. 11 reported poor physical function in OA patients with sarcopenia. Additionally, in knee OA patients, sarcopenia is associated with knee pain 12 and decreased QOL. 13 Indeed, losing weight in obese patients can cause muscle loss leading to sarcopenic obesity (SO), 14 which can eventually lead to a decline in physical function.
In elderly patients, SO is associated with decreased physical performance, including decreased walking speed, walking limitations, and difficulties climbing stairs. 15,16 SO is also related with poorer QOL, longer hospital stay, and higher mortality than those with obesity or sarcopenia alone in community-dwelling elderly patients. 14,17,18 In patients with both obesity and muscle weakness, a delay in recovery, such as decreased physical function and extended hospital stay, was found after total hip arthroplasty. 19 SO is more closely associated with knee OA than sarcopenia alone or non-SO; 20,21 however, there are few studies on the relationship between SO and physical function in knee OA patients. 22
This study was undertaken to investigate the prevalence of obesity with low muscle mass and its impact on physical function, QOL and pain in patients with end-stage knee OA over 65 years old.
Methods
Study Design and Participants
In this cross-sectional study, we assessed a total of 562 patients (77 males and 485 females; mean age 72.7 ± 4.4 years) who were diagnosed with end-stage knee OA (K-L grades 3 and 4) and were scheduled to undergo unilateral or bilateral TKA between October 2013 and October 2019 at the Department of Orthopedic Surgery in Jeju National University Hospital. The study protocol was approved by the Institutional Review Board of Jeju National University Hospital (No. JEJUNUH 2020-12-011). Patients did not have to provide informed consent due to the retrospective nature of the study.
All 562 patients completed the following assessments before surgery. Physical performance tests included the stair climbing test (SCT), the 6-minute walk test (6MWT), the timed up-and-go test (TUG), and instrumental gait analysis. Self-reported physical function and self-reported pain were measured using the Western Ontario and McMaster Universities Osteoarthritis Index (WOMAC), self-reported knee pain was evaluated on a visual analog scale (VAS), and self-reported QOL was measured using the EuroQOL 5 dimensions (EQ-5D) questionnaire.
Body Composition
Low muscle mass was measured using bioelectrical impedance analysis (BIA). Low muscle mass was calculated by dividing appendicular skeletal muscle mass (kg) by the square of height (m2). Cut-off reference values were < 7.0 kg/m2 for males and < 5.7 kg/m2 for females, according to the Asian Working Group for Sarcopenia, 2014 and 2019. 23,24
Body mass index (BMI) was calculated as weight (kg) divided by height squared (m2). Obesity was identified by BMI ≥ 25 kg/m2, according to the International Association for the Study of Obesity in the Western Pacific Region, WHO. 25
We divided patients into 4 groups depending on presence of obesity and low muscle mass: normal BMI with normal muscle mass, obesity with normal muscle mass, normal BMI with low muscle mass, and obesity with low muscle mass.
Performance-Based Physical Function
SCT
The SCT is a measurement of the time required to ascend and descend a flight of stairs (12 steps, each 17 cm high and 25 cm wide). In this test, the participants ascend or descend the stairs as fast as possible upon hearing the word “go”. Each patient completed 3 trials, with a 5-minute rest interval between each pair of trials. The fastest time was recorded for each patient. 26
6MWT
The 6MWT assessed functional walking capacity and gait endurance in adults. Patients walked as far as possible for 6 minutes in the 50 m hallway and the distance they traveled was recorded. A higher score in 6MWT indicates a larger distance covered in 6 minutes. 27
TUG
The TUG test is used to evaluate dynamic balance. In this test, the participants sit with their backs against a chair (seat height, 44 cm; width, 49 cm; armrest height, 64 cm) placed at the end of a marked 3 m distance and stand up upon hearing the word “go”, walk at a comfortable speed past the 3 m mark, turn around, walk back, and sit down again in the chair without physical assistance, all while being timed. 28
Gait Analysis
The spatiotemporal variables of gait were measured using a validated wireless inertial sensing device (G-Walk, BTS Bioengineering S.p.A., Milan, Italy). Each patient wore a semi-elastic back-belt device and was asked to walk 8 m as naturally as possible, at a comfortable speed. 29
Self-Reported Physical Function and QOL
WOMAC
This is a multidimensional questionnaire that asks questions about pain, stiffness, and physical function. It was used previously to measure self-reported disability in patients with knee OA. There are 5 pain variables, 2 stiffness variables, and 17 physical function variables. Each of the 24 WOMAC variables is scored using a 5-point Likert scale (0, none; 1, slight; 2, moderate; 3, very; and 4, extremely), as recommended by the Outcome Measures in Rheumatology Clinical Trials (OMERACT). Thus, the Likert scale is employed to determine the degree of pain, stiffness, and difficulty experienced in performing each of 17 activities in the preceding 48 hours. Higher scores indicate greater levels of pain, stiffness, and difficulty. 30 The sum of scores for pain, stiffness, and physical function determine WOMAC-pain (range 0–20), WOMAC-stiffness (range 0–8), and WOMAC-function (range 0–68) sub-scores.
VAS
Patients self-evaluated their level of knee pain using a VAS. The scale has facial expressions, visually representing the intensity of pain from no pain to unbearable pain along a 10 cm horizontal line. The VAS system ranged from 0 (completely satisfied) to 10 (totally unsatisfied). All patients marked a point that matched their pain level on the line. 31
EQ-5D Questionnaire
The EQ-5D index is widely used to evaluate self-reported QOL measuring 5 dimensions: mobility, self-care, usual-activities, pain/discomfort, and anxiety/depression. Each dimension is represented by one question with 3 severity levels (no problem, some or moderate problems, and extreme problems). The scores are transformed using utility weights derived from general Korean population ranging from -1 to 1. Higher scores indicated better overall health status. 32
Statistical Analysis
All statistical analyses were performed using SPSS, Version 20.0 (SPSS V 20.0 K, SPSS Inc., Chicago, Illinois, USA). All variables were subjected to descriptive statistics. After dividing into males and females, the patients were allocated into 1 of 4 groups according to the presence of obesity and low muscle mass. Analysis of variance (ANOVA) was used to compare differences between the 4 groups within each sex. When the ANOVA results were statistically significant, Bonferroni’s post-hoc test was used to identify which groups were significantly different from each other. Stepwise multiple linear regression analysis, adjusted for age and BMI, was used to identify the association of the combination of obesity and low muscle mass with preoperative physical function. A p-value < 0.05 was considered significant.
Results
Patient demographics and characteristics are presented in Table 1. There were 77 males and 485 females. The mean age was 74.0 ± 4.1 years in males and 72.5 ± 4.5 years in females. The mean BMI and prevalence of obesity were 26.1 ± 3.2 kg/m2 and 62.3% (48/77) in males and 26.6 ± 3.2 kg/m2 and 67.8% (329/485) in females. The mean appendicular muscle mass/height 2 and low muscle mass prevalence were 7.58 ± 0.74 and 19.5% (15/77) in males and 6.54 ± 2.96 and 5.2% (25/485) in females. Comparing males and females, the obesity rate was 5.5% higher in females and the low muscle mass rate was 14.3% higher in males.
Demographic and Disease-Related Characteristics of Participants (N = 562).

Values represent mean ± standard deviation or number (%) of cases.
Abbreviations: BMI, body mass index; ASM, appendicular skeletal muscle mass; K-L, Kellgren-Lawrence.
Comparison of Performance-Based Physical Function, Self-Reported Physical Function, QOL and Pain Between Groups
Table 2 compares performance-based physical function, self-reported physical function, QOL and pain between the 4 groups in males and females. In males, obesity with low muscle mass was diagnosed in 6 subjects (7.8%). In females, obesity with low muscle mass was diagnosed in 9 subjects (1.9%). In the analysis of variance (ANOVA), followed by Bonferroni’s post hoc test, in males, obesity with low muscle mass group took significantly longer to complete the SCT-descent than all other groups (p < 0.05). The obesity with low muscle mass group also took significantly longer to complete the SCT-ascent than the normal BMI with normal muscle mass group and the obesity with normal muscle mass group, and also had a significantly higher TUG score than the obesity with normal muscle mass group (all p < 0.05). In females, the obesity with low muscle mass group took significantly longer to complete the SCT-ascent than all other groups (p < 0.05). The SCT-descent time and gait speed of the obesity with low muscle mass group were significantly slower than those of the normal BMI with normal muscle mass and the obesity with normal muscle mass group (p < 0.05).
In both males and females, there was no significant difference in self-reported physical function, QOL and pain in the obesity with low muscle mass group compared with other groups.
Demographic Data and Performance-Based Physical Function, Self-Reported Physical Function, Quality of Life and Pain in Patients with End-Stage Knee Osteoarthritis According to Body Composition Group.

Values represent mean ± standard deviation or number (%) of cases.
BMI, body mass index; SCT, stair climbing test; 6MWT, 6-minute walk test; TUG, timed up and go; WOMAC, Western Ontario McMaster Universities Osteoarthritis Index; EQ-5D, EuroQOL 5 dimensions; VAS, visual analog scale.
aSignificant difference between normal body composition and obesity with low muscle mass (p < 0.05).
bSignificant difference between obesity without low muscle mass and obesity with low muscle mass (p < 0.05).
cSignificant difference between low muscle mass without obesity and obesity with low muscle mass (p < 0.05).
dSignificant difference between normal body composition and low muscle mass without obesity (p < 0.05).
eSignificant difference between obesity without low muscle mass and low muscle mass without obesity (p < 0.05).
fSignificant difference between normal body composition and obesity without low muscle mass (p < 0.05).
Predicting Performance-Based Physical Function in Patients with End-Stage Knee OA Using Stepwise Multiple Linear Regression Analysis
Tables 3 and 4 show the results from the stepwise multiple linear regression analysis, conducted to evaluate whether different patient characteristics predicted performance-based physical function in males and females. In males (Table 3), age and the combination of obesity and low muscle mass were significantly predictive of SCT-ascent time (model R2 = 0.220), SCT-descent time (model R2 = 0.189), and TUG (model R2 = 0.142). In females (Table 4), age, BMI and the combination of obesity and low muscle mass were significantly predictive of SCT-ascent time (model R2 = 0.143), SCT-descent time (model R2 = 0.107), and age and the combination of obesity and low muscle mass were significantly predictive of gait speed (model R2 = 0.052).
Impact of the Combination of Obesity and Low Muscle Mass on Performance-Based Physical Function in Patients with End-Stage Knee Osteoarthritis in Males Analyzed by Stepwise Multiple Linear Regression Analysis.

Values represent mean ± standard deviation or number (%) of cases.
SCT, stair climbing test; TUG, timed up and go.
Impact of the Combination of Obesity and Low Muscle Mass on Performance-Based Physical Function in Patients with End-Stage Knee Osteoarthritis in Females Analyzed by Stepwise Multiple Linear Regression Analysis.
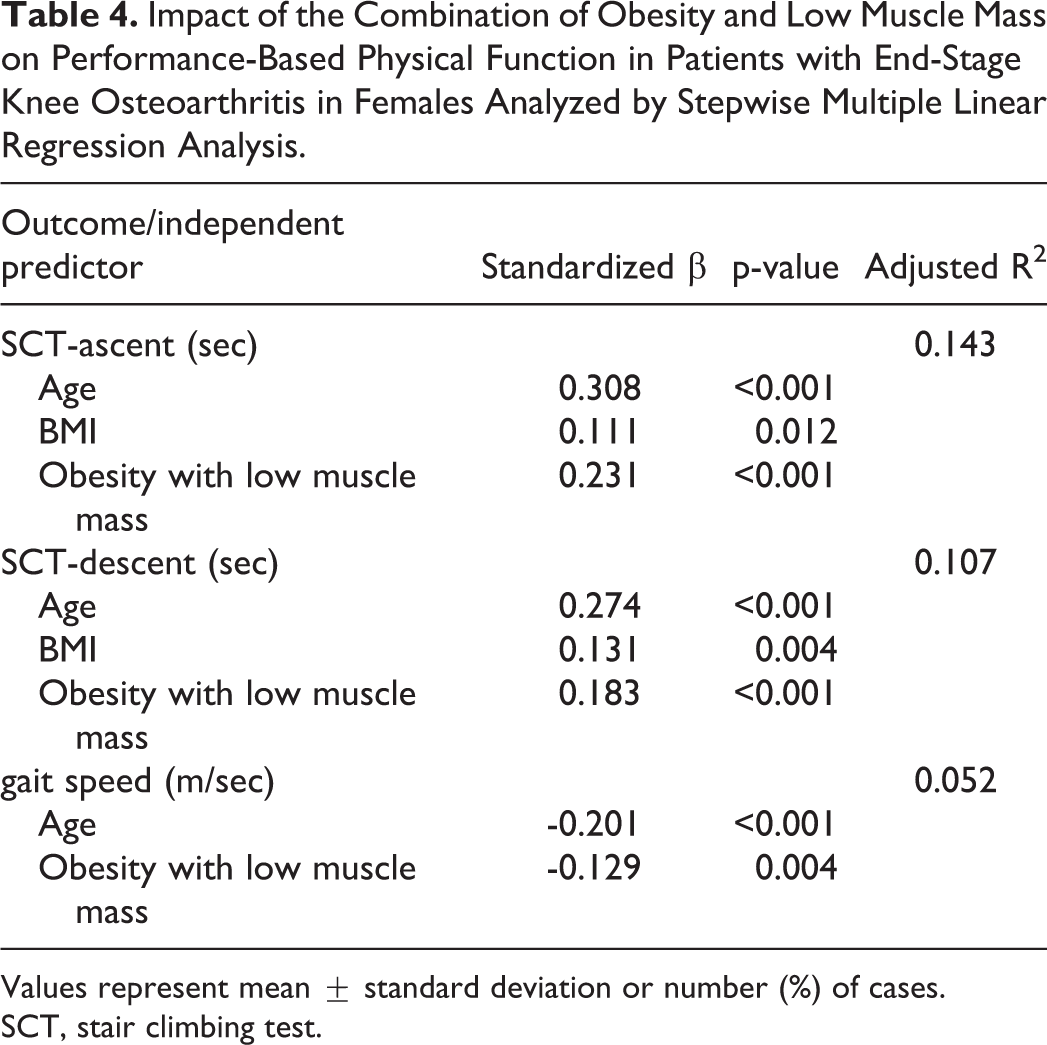
Values represent mean ± standard deviation or number (%) of cases.
SCT, stair climbing test.
Discussion
This study examined the association between obesity with low muscle mass and performance-based physical function, self-reported physical function, QOL, and pain in end-stage knee OA patients. In both males and females, obesity with low muscle mass was associated with performance-based physical function, but not with self-reported physical function, QOL, and pain.
According to Donini et al., 33 the prevalence of SO ranges from 2.75 to 20%. In a study that recruited Korean community-dwelling elderly patients, prevalence was 3.8% in males and 6.7% in females. 16 In the study of Godziuk et al. 34 in which knee OA patients were recruited, 6.7% of males and 11.3% of females had SO, while Manoy et al. 35 reported a prevelance of 15.2% in female knee OA patients; these levels of prevalence are similar to our study in male, but only 1.9% of females had SO. There are differences between studies due to unclear criteria by which SO is diagnosed.
Recently, the definition of sarcopenia using low muscle strength, confirmed through low handgrip strength, combined with low muscle mass has been used. 24,36 The definition of SO has been continuously researched since first introduced, 37 and is defined as a phenotype of low muscle mass and high adiposity, but it is still widely used without clear diagnostic criteria. 18,36 Godziuk et al. 34 additionally assessed muscle strength using handgrip strength and analyzed the difference between the SO patients and other patients according to the definition of sarcopenia that meets the criteria of EWGSOP2. 36 In the SO group, similarly to the obesity with low muscle mass group in our study, gait speed and 6MWT were significantly lower than other groups, suggesting a clinically significant difference between sarcopenia and SO. Further research is needed to define specific diagnostic criteria for SO.
In a cross-sectional study 34 of 151 patients with end-stage knee OA, patients with obesity and low muscle mass had poorer performance-based physical function results than patients without SO, similar to the findings of our study. However, we enrolled a greater number of patients (N = 562), and the study was conducted on Asian Koreans rather than on a majority Caucasian demographic. We also evaluated more performance-based physical function parameters (i.e., SCT-ascent, SCT-descent, TUG) and investigated gait speed more objectively through gait analysis. Also, in agreement with our study, in a study of knee OA by Manoy et al 35 and a study of Korean elderly by Kong et al, 16 the physical performance of patients with obesity with low muscle mass was significantly lower than that of other groups.
In our study, SCT-ascent and SCT-descent were significantly higher in people with obesity and low muscle mass than other groups in both males and females. So far, there are limited studies confirming a significant association between obesity with low muscle mass and SCT performance. 38,39 However, Rolland et al. 39 found, in a cross-sectional study of community-dwelling elderly females, that patients with obesity and low muscle mass had significantly higher SCT-ascent and SCT-descent times than patients with normal body composition. Various factors such as knee OA and knee pain can affect SCT performance; 40,41 therefore, our findings are meaningful in showing that obesity with low muscle mass is predictive of poor SCT-ascent and SCT-descent performance in both elderly males and females with knee OA. The SCT test is widely used to measure physical performance and mobility function, is useful in the assessment of older adults at risk of fall-related injuries, 42 and is an excellent predictor of post-operative morbidity. 43 Given the associations between SCT, SO and low muscle strength, SO and muscle strength may be useful OA-related assessments 44 -46 and daily exercise should be encouraged to improve SCT performance and related outcomes.
In our study, TUG in males was significantly higher in the obesity with low muscle mass group than in obesity with normal muscle mass group. In females, gait speed was significantly slower in the obesity with low muscle mass group than in the normal BMI with normal muscle mass and normal BMI with low muscle mass groups. There was a difference in the prevalence of obesity with low muscle mass between males and females, which may have caused differences the statistical significance of the results. In the study by Manoy et al., 35 the SO group showed significantly slower gait speed and higher TUG time than the normal weight group. In knee OA patients, low gait speed and high TUG time are associated with quadriceps femoris muscle weakness; 47,48 quadriceps muscle weakness was associated with an increased risk of falls. 49 Therefore, patients with obesity and low muscle mass are considered to have a high risk of falls.
Interestingly, in our study, there was no significant difference in self-reported physical performance, QOL, or pain in patients with obesity and low muscle mass compared with other groups. However, these evaluations were subjective, since each patient has different ways of expressing symptoms. Therefore, a more objective evaluation method is needed for this.
According to Pickering et al., 50 higher BMI is associated with an increase in adipose cells, which produce adipokines such as leptin. This creates a pro-inflammatory environment, blunting muscle protein synthesis and causing cartilage destruction. This causes inactivity and decreases physical function, eventually increasing adiposity and BMI, and causing a vicious cycle. To prevent this, proper treatment and exercise are required.
Our study has several limitations. First, only patients who came to the hospital for surgery were recruited, which represents a subpopulation of end-stage knee OA subjects. Therefore, patients with sedentary lifestyle due to severely low muscle mass or severe obesity, or patients with high comorbidity, may not be included because they did not come to the hospital for surgery. Second, our study is a cross-sectional study, not a longitudinal study, meaning cause and effect relationships could not be established. Further prospective longitudinal studies are warranted. Finally, to accurately measure body fat, dual-energy X-ray absorptiometry and waist circumference measurement could be employed, and hand grip strength measurement could be used to evaluate muscle strength.
Conclusion
This study confirmed that the combination of obesity and low muscle mass is associated with impaired physical function in patients with end-stage knee OA. Therefore, measuring both obesity and appendicular skeletal muscle mass could help assess a patient’s physical function. Further longitudinal studies are needed to establish causality between SO and physical function in patients with end-stage knee OA.
Footnotes
Acknowlegment
This work was supported by a research grant from the Jeju National University Hospital Research Fund of Jeju National University in 2020.
Declaration of Conflicting Interests
The author(s) declared no potential conflicts of interest with respect to the research, authorship, and/or publication of this article.
Funding
The author(s) received no financial support for the research, authorship, and/or publication of this article.