
Abstract
Background:
Adults with type 2 diabetes mellitus and comorbid depression face complex disease management. Salud y Vida, a diabetes management intervention for Mexican Americans in the Rio Grande Valley of Texas, may mitigate depression through social support and community-clinic referrals.
Methods:
In a cohort study, 292 Salud y Vida participants completed the patient health questionnaire (PHQ-9) at baseline, month 6, and month 12. A PHQ-9 score of ≥5 indicated mild depression and activated a mental health referral. Using SAS 9.4 with significance set at <.05, we conducted multivariable longitudinal negative binomial regression to assess changes in depression level.
Results:
The proportion of participants with a PHQ-9 ≥5 decreased from 36% at baseline to 18% in month 6 (adjusted risk ratio = 0.51, 95% CI = 0.41-0.62; P < .001). Among those with clinical depression at baseline (n = 121), mean PHQ-9 scores dropped 45% by month 6 (9.60-5.28; adjusted rate ratio = 0.55; 95% CI = 0.47, 0.65, P < .001) and an additional 22% by month 12 (5.28-4.10; adjusted rate ratio = 0.78; 95% CI = 0.66, 0.91; P < .002).
Conclusion:
Salud y Vida participation is correlated with significant depression symptom improvements in Mexican American adults with diabetes and comorbid depression, demonstrating that chronic care management interventions can address multiple chronic conditions.
Introduction
Type 2 diabetes mellitus is a large and growing health burden in the United States, with 38.1 million adults (14.7% of the adult population) estimated to have this condition. 1 The cost of total diabetes care accounts for 1 in 4 spent dollars in health in the United States, or $327 billion annually. 2 Type 2 diabetes is especially prevalent in Hispanic populations in the US, with 15.5% of Hispanic adults estimated to have diabetes. 1 Hispanic populations also face disproportionate barriers to type 2 diabetes care when compared to non-Hispanic White populations, including financial barriers, language barriers, uninsurance, and limited access to healthy foods. 3
Managing type 2 diabetes, especially if it involves significant lifestyle changes and self-care routines, can be emotionally challenging. The daily monitoring of blood sugar levels, dietary restrictions, medication management, and the potential for complications can lead to feelings of stress and anxiety.4 -6 The chronic nature of type 2 diabetes can also contribute to feelings of hopelessness, sadness, and a reduced quality of life. 7 Hispanic individuals are more likely to have complications associated with diabetes, which has been shown to impact mental health. 8 Hispanic individuals generally face prominent cultural stigmas and higher levels of healthcare inaccessibility, such as disproportionate lack of insurance and not being English-fluent, that precludes seeking and accessing care for depression to be diagnosed and managed.9,10 Hispanic participants in the Cameron County Hispanic Cohort with diagnosed diabetes were found to have depression at a significantly higher rate than those with undiagnosed diabetes or no diabetes. 11 Research shows that the relationship between type 2 diabetes and depression is bidirectional; individuals with type 2 diabetes are twice as likely to have depression compared to those without diabetes, 12 and individuals with depression are also at higher risk of developing type 2 diabetes. 13
The presence of depression in individuals with type 2 diabetes can complicate the management of both conditions. Depression in individuals with type 2 diabetes is associated with higher HbA1c, poorer diabetes self-management (including less glucose monitoring, adherence to medication, and meeting physical activity and diet recommendations), and increased mortality. 14 There is a multiplicative risk of functional disability with comorbid type 2 diabetes and depression compared to having type 2 diabetes or depression alone. 15 This added complexity also increases the cost of treatment in individuals with both diabetes and depression, which is 4.5 times higher than the treatment of diabetes alone. 16
Effective management of co-occurring diabetes and depression can be a complex challenge for healthcare professionals, beginning with proper diagnosis. In the United States, only half of individuals with diabetes and comorbid depression are identified during treatment as having depression and subsequently provided with treatment options for their depression. 17 Hispanic individuals with type 2 diabetes are less likely to be diagnosed with depression and half as likely to receive treatment. 18 Research has shown that both psychotherapeutic interventions and psychopharmacological treatment are effective at reducing depressive symptoms—including avolition, a lack of motivation to initiate or sustain activities such as self-care—and improving glycemic control.17,19 Among individuals with type 2 diabetes with multiple co-morbidities or long-term physical conditions, a collaborative care treatment model, which includes patient education, health professionals in the primary care system, and case management from a psychiatrist, is the recommended treatment. 19 However, this model presents financial challenges to traditional fee-for-service medical reimbursement systems in the U.S., 20 as these systems have difficulty reimbursing for the full range of team-based services such as meetings, case management, and care coordination. These challenges are even more pronounced for low-income Hispanic populations with a high rate of uninsurance. For these reasons, the collaborative care model has not been applied widely to this population to treat comorbid type 2 diabetes-depression.
In summary, there are significant research gaps in understanding and addressing comorbid type 2 diabetes and depression in Hispanic populations. Though collaborative care models are effective at treating these conditions, they are rarely implemented in low-income Hispanic communities due to structural and financial barriers.
The Salud y Vida (SyV) program 21 is an intervention designed to address uncontrolled type 2 diabetes amongst a Mexican American population living in the Rio Grande Valley of Texas, located on the US-Mexico border. This area has a type 2 diabetes prevalence rate of 31%, one of the highest rates in the country, which is connected to the pervasiveness of negative social determinants of health in the area, including a lack of insurance and limited education. 22 The SyV program adapted an expanded Wagner’s Chronic Care Management model,23 -25 using a cross-disciplinary team of healthcare providers, Diabetes Self-Management Education (DSME) instructors, social workers, and community health workers (CHWs).
This study focuses on a subsample of participants from the SyV program who were enrolled in a 2-arm controlled trial and completed a 9-item depression symptom scale Patient Health Questionnaire (PHQ-9) over 12 months to track depression levels. The aim of the study is to examine how participation in an expanded chronic care management program affects depression levels in Mexican American patients, a group that is underrepresented in research on both diabetes and depression.
Methods
Study/Program
The methods for this study have been described in detail in a previous publication. 21 Briefly, the study followed 353 participants living in Cameron and Willacy Counties of Texas. These participants were grouped in 2 arms over 12 months: 177 enrolled in the standard SyV intervention (called “SyV 1.0” in the original study) and 176 enrolled in an enhanced SyV program that included medication therapy management services, peer-led support groups, and additional community-based lifestyle programs (called “SyV 2.0” in the original study). Participants in both arms were identified from the SyV 1.0 pool that fit the specific study criteria. Participants became eligible for the intervention study once they had been enrolled in SyV 1.0 for at least 6 months and no more than 36 months. Additional criteria for SyV 2.0 enrollment included: (1) active patient status at 1 of 2 partner clinics, verified by clinic staff; (2) residence in Cameron or Willacy Counties of Texas; and (3) an HbA1c ≥ 9.0% documented at any quarterly or clinical visit during months 6 to 36 of SyV 1.0 participation; and (4) an HbA1c ≥ 8.0% at the time of SyV 2.0 baseline assessment. These individuals were scheduled for a baseline appointment where they were consented and enrolled. Data collection included hemoglobin A1c (HbA1c) percent, systolic and diastolic blood pressure, cholesterol level, and PHQ-9 score to screen for depression at baseline, 6- and 12-month follow-up visits.
There were no differences in the services for depressive symptoms provided to either arm. For ethical reasons, both arms received services that included referrals to clinic and community based behavioral health counseling services, or in cases that presented with a higher PHQ-9 score (>10) or indicated suicidal ideation, participants were referred to the local mental health authority (Texas Tropical Behavioral Health) case manager as well as provided with the hotline number and follow-up phone calls.
For this study, we compared the PHQ-9 scores for the standard and enhanced intervention arms and found no statistically significant differences. Subsequent analyses to examine the relationship between participation in the program and depression levels were conducted after collapsing the 2 arms into 1 full sample group (n = 353).
Measures
The PHQ-9 is a well-validated 9-item questionnaire used to screen for and identify the severity of depression symptoms in the general population, identifying those who may require clinical attention.26,27 The 9 screening questions correspond to each of the DSM-5 symptom criteria to diagnose depressive disorders. The PHQ-9 scale is operationalized as a severity measure, where the participant’s response to each symptom question (eg, “how often do you have little interest or pleasure in doing things?”) results in variable scoring from 0 (“not at all”) to 3 (“nearly all day”). Accordingly, each question’s score can be cumulatively summed to calculate a participant’s PHQ-9 score, which can range from 0 to 27 points. 28
The PHQ-9 survey was administered to study participants by trained university research staff at baseline, 6 months, and 12 months. A cutoff score of ≥5, the threshold for mild or more severe depression severity, was the threshold to trigger a behavioral health services referral for the patient to be evaluated by their medical home for possible treatment. 28 Demographic covariates included age, gender, race, language, employment status, marital status, health insurance status, and education level. There was roughly equal representation in the standard and enhanced intervention groups across all demographic categories (see Table 1).
Baseline Demographic Characteristics.

Missing: n = 1.
Statistical Analysis
A total of 353 study participants were assigned randomly into the 2 arms: the enhanced intervention group (n = 176), and the standard intervention group (n = 177). Randomization was conducted using a minimization randomization algorithm based on the data distribution of demographic information of the previously enrolled participants using R (http://www.r-project.org). After excluding participants who did not have at least 2 visits with PHQ-9 data available, we analyzed data from the remaining 292 participants. Among them, 145 participants were in the standard intervention group and 147 were in the enhanced intervention group. We conducted both univariable and multivariable longitudinal regression analysis using generalized estimating equation (GEE) method that accounts for potential correlations of repeated measures within a participant over time. Specifically, we used negative binomial regression models for PHQ-9 scores, and log-binomial regression models for PHQ-9 referral to additional behavioral health services (ie, PHQ-9 ≥5) to assess how depression levels changed over time, that is, baseline, follow-up months (month 6 and month 12). We further evaluated whether the longitudinal changes in PHQ-9 scores differ by baseline depression severity status by testing interactions between time and severity group. We evaluated underlying assumptions such as overdispersion and linearity while conducting analysis. We also performed sensitivity analyses using alternative statistical approaches that account for within-subject correlations, such as mixed-effects models. Potential confounding factors such as demographic characteristics (eg, age, sex, race, preferred language, marital status, employment, education, and insurance status) were examined and adjusted while building multivariable models. SAS 9.4 (SAS Institute Inc., Cary NC) and R were used to perform all statistical analyses, and statistical significance was assumed at the .05 level.
Missing Data Handling
We evaluated patterns of missing data within our analytic sample and found that 280 participants (95.9%) had PHQ-9 scores available at all 3 time points. Only 12 participants (4.1%) had missing PHQ-9 data at month 6. There were no significant differences in demographic characteristics between these individuals and the rest of the analytic sample.
Results
Baseline demographic characteristics by intervention group are presented in Table 1. We observed no significant differences in demographic variables and baseline PHQ-9 between the enhanced intervention and the standard intervention group. Compared to standard intervention group, the enhanced intervention group had a higher percentage of PHQ-9 referrals (PHQ-9 ≥5) at baseline (47.59% vs 35.62%).
Full Sample Analysis for Depression Scores
We first evaluated the change in PHQ-9 score over time among the full sample of n = 292 (baseline, month 6, and month 12) after controlling for potential confounding effect as shown in Figure 1 and Table 2, we found that PHQ-9 score significantly decreased over 3 time points (P < .0001). Specifically, there was a 41% reduction in PHQ-9 score from baseline to month 6 (from 4.70 to 2.76; adjusted rate ratio (RR) = 0.59; 95% CI = 0.52, 0.67; P < .0001) and this PHQ-9 reduction maintained through month 12 (from 2.76 to 2.37 adjusted RR = 0.86; 95% CI = 0.75, 0.98; P = .021), but there was no significant difference between study arms.
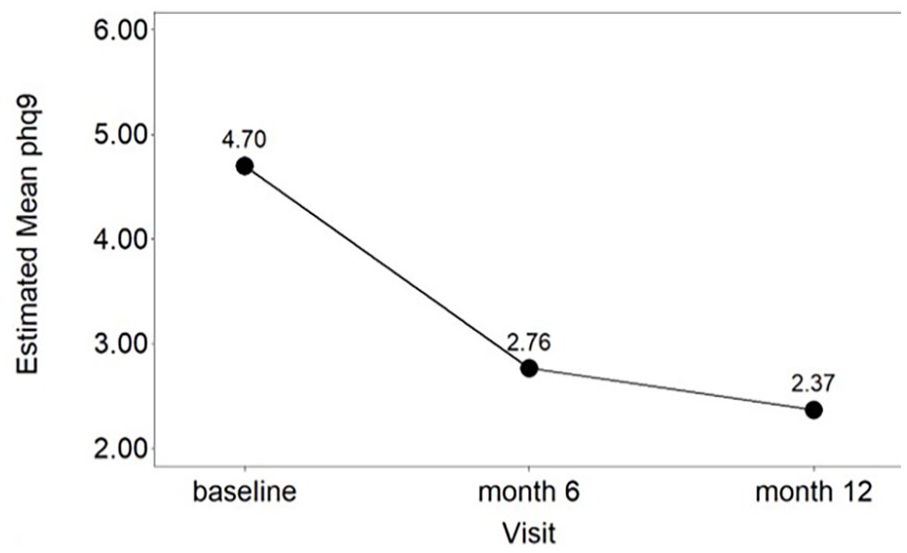
Adjusted mean PHQ-9 scores or probability of referrals over time.
PHQ-9 Levels Over Time Among the Full Sample of N = 292 Using Univariable and Multivariable Longitudinal Negative Binomial Regression Models.

Abbreviation: CI, confidence interval.
Multivariable longitudinal regression model after adjusting for age, sex, preferred language, race, employment status, marital status, type of insurance, and years in school.
Subgroup Analysis With Clinically Significant Depression Scores at Baseline
We conducted a subgroup analysis for only n = 121 (41.4%) participants who had a score (PHQ-9 ≥5) that indicated mild or higher depression at enrollment. Initially, we assessed the change in PHQ-9 score over time while accounting for potential confounding factors. As shown in Figure 2 and Table 3, we observed a significant decrease in PHQ-9 scores across 3-time points (P < .0001). Specifically, there was a 45% reduction in PHQ-9 score from baseline to month 6 (from 9.60 to 5.28; adjusted rate ratio (RR) = 0.55; 95% CI = 0.47, 0.65; P < .0001). There was a further 22% reduction in PHQ-9 score from month 6 to month 12 (from 5.28 to 4.1; adjusted rate ratio (RR) = 0.78; 95% CI = 0.66, 0.91; P = .0017). This is a clinically significant reduction, as it reduces the average score from above the threshold for mild clinical depression (5) to below the threshold. 28

Adjusted mean PHQ-9 scores over time for 121 participants who had mild or higher depression severity level (PHQ-9 ≥ 5) at enrollment.
Subgroup Analysis: PHQ-9 Levels Over Time for 121 Participants Who Had Mild or Higher Depression Severity Level (PHQ-9 ≥ 5) at Enrollment Using Univariable and Multivariable Longitudinal Negative Binomial Regression Models (n = 121).

Abbreviation: CI, confidence interval.
Multivariable longitudinal regression model after adjusting for age, sex, preferred language, race, employment status, marital status, type of insurance, and years in school.
Analysis for PHQ-9 Referrals
In addition to PHQ-9 score, we assessed the change in percent of participants who received a PHQ-9 referral (PHQ-9≥5) over time after controlling for the same set of potential confounding variables using log-binomial regression analysis. As shown in Figure 3 and Table 4, we found that the percentage of PHQ-9 referrals significantly decreased from baseline to month 6 (from 36% to 18%; adjusted risk ratio (relative risk) = 0.51; 95% CI = 0.41, 0.62; P < .0001) and maintained until month 12 (from 18% to 19%; adjusted risk ratio = 1.04; 95% CI = 0.83, 1.30; P = .74).

Adjusted mean probability of referrals for participants with a PHQ-9 ≥ 5 over time (n = 292).
PHQ-9 Referrals Over Time Using Univariable and Multivariable Longitudinal Log-binomial Regression Models.

Multivariable longitudinal regression model after adjusting for age, sex, preferred language, race, employment status, marital status, type of insurance, and years in school.
Depression Severity at Baseline
We further assessed whether the decrease in depression level we found differed by the depression severity at baseline, that is, none or minimal (0-4), mild (5-9), moderate (10-14), and moderately severe or severe (20-27). After controlling for the same set of potential confounding variables, we performed longitudinal negative binomial regression models with interaction terms between time (month 0, 6, and 12) and depression severity to estimate the longitudinal changes in depression level for each severity category separately. As shown in Figure 4 and Table 5, we found that depression severity at baseline significantly modifies longitudinal change in depression level over time (interaction effect P = .037). While the participants who had mild or moderate symptom at baseline had around 50% decrease from baseline to month 12 (adjusted RR = 0.5 and 0.52, respectively), those who had moderately severe to severe symptom had 68% reduction in depression level (from 22.23 to 7.06; adjusted RR = 0.32, P < .001).

Adjusted mean PHQ-9 scores over time for each baseline depression severity group.
PHQ-9 Levels Over Time for Each Baseline Depression Severity Group Using Multivariable Longitudinal Negative Regression Model (n = 292).

Abbreviation: CI, confidence interval.
Multivariable longitudinal regression model after adjusting for age, sex, preferred language, race, employment status, marital status, type of insurance, and years in school.
Characteristics of Those Excluded From the Longitudinal Analysis
Since 61 out of the 353 study participants were excluded from the longitudinal analysis due to having fewer than 2 visits with available PHQ-9 data, we assessed and compared the characteristics of these excluded participants with those included in the analysis sample. First, we found that 59% of the excluded participants had missing PHQ-9 scores at baseline, while 41% had no PHQ-9 data recorded during the follow-up period (mean baseline PHQ-9 = 3.32). Although there were no significant differences in demographic characteristics between the excluded group (n = 61) and the analysis sample (n = 292), a higher proportion of males was observed among those excluded (44.26%) compared to those included in the analysis (26.37%). Additionally, 48% of the excluded participants were from the enhanced intervention group, indicating that the pattern of missingness was similar across intervention arms.
Sensitivity Analysis
We also performed sensitivity analyses using alternative statistical approaches that account for within-subject correlations, such as mixed-effects models. These analyses confirmed that the main findings remained consistent. Although our longitudinal outcome variable, the PHQ-9 score, showed evidence of overdispersion—prompting the use of negative binomial regression models—we also performed Poisson regression for comparison. However, because Poisson regression does not adjust for overdispersion, it resulted in slightly underestimated standard errors in our estimates of longitudinal change.
Use of depression medication is an important factor to consider when evaluating changes in PHQ-9 scores. However, the available data on medication use reflected a time point at least 6 months before the baseline PHQ-9 measurement used in our study. Moreover, data on depression medication use were missing for about 65% of the participants included in our statistical analysis. Despite these limitations, we conducted sensitivity analyses adjusting for this variable. Among the 103 participants with available medication use data (mean PHQ-9 levels: 4.57 for those on meds (n = 5; 4.85%), 4.82 for those not on meds (n = 98; 95.1%), the primary findings remained consistent after adjustment.
Discussion
Our findings suggest an association between participation in an expanded chronic care management program and a decrease in depression level, though causality cannot be determined. As expected, as the population showed lower PHQ-9 scores over time, we also saw a corresponding reduction in referrals to behavioral health services. The subgroup of participants with a baseline PHQ-9 score ≥5, indicating clinically significant depression, 28 were observed to reduce their PHQ-9 scores by an average of 57% (from 9.6 at baseline to 4.10 at month 12; adjusted RR = 0.43, 97% CI = [0.36, 0.51]) over the course of 12 months. The full study group, including participants with scores <4, showed a slightly smaller reduction of 50%, indicating that intervention elements were associated with depressive mood improvement over time.
The reduction in depression observed in this study is a secondary health effect of a diabetes-focused program. However, the SyV program includes components shown to be effective at addressing depression, including assessment and referral to the local mental health authority, local clinic or community counseling services if needed. All SyV CHWs are trained in motivational interviewing and use these techniques at quarterly home visits. Use of reflective listening, empathy, affirmation, decisional balance, and allowing participants to identify their priority needs in a less-threatening home setting, paired with the PHQ-9 assessment, allows the CHWs to identify specific social needs related to depression and make referrals for services that may not otherwise be identified in a clinic setting. Motivational interviewing has been shown to improve depressive symptoms in low-income patients. 29
SyV included intervention components that help address common barriers created by social determinants of health, including lack of transportation and lack of funding for medication. The program also deployed licensed social workers to visit the participants and assess behavioral health needs along with other social barriers. In addition, the chronic care model included a wraparound partnership between the clinic care and CHW care which extended into the patient’s home and community. The CHWs navigated participants back to primary and behavioral health care when need was identified and supported follow-up by helping make appointments, connecting to clinic services, describing complex cases at monthly cross-disciplinary case management review with clinic personnel, and arranging for transportation and other supports to address depression related needs.
Comprehensive approaches like SyV that include clinic-CHW coordinated components to address patients’ social needs likely contributed to improved findings related to PHQ-9 reduction. This is consistent with another study which found a statistically significant reduction in PHQ-9 scores for individuals in an enhanced intervention that addressed social determinants of health in comparison to a basic intervention. 30 By effectively reducing comorbid depression in individuals with type 2 diabetes in addition to helping participants manage their diabetes, this effect could decrease healthcare costs and lead to better health trajectories for patients.
Despite our inability to assess causality with the present study design, the results align with other studies that have shown participation in chronic care management programs improves outcomes for both type 2 diabetes and depression. A randomized control trial of mostly Hispanic patients with type 2 diabetes and clinically significant depression found that the collaborative care management intervention group had significant depression improvement as well as a reduction in diabetes symptoms. 31 Another randomized control trial for patients with comorbid type 2 diabetes and depression found that the integrated care intervention group had lower HbA1c levels and less depression than the control group. 32 These studies, as we found in our results, indicate that an interdisciplinary intervention with structured chronic care management of diabetes has ramifications for alleviating diabetes and depression severity. Intensive chronic care management interventions have implications for population health not just for diabetes strictly, but also improved outcomes related to identifying and mitigating co-morbid depression. In a U.S. healthcare environment, specifically in states like Texas that did not expand the federally-funded health insurance program Medicaid to low-income adults, individuals with type 2 diabetes are less likely to seek assessment and treatment for depression. 33 Assessing and addressing depression among uninsured individuals with type 2 diabetes has healthcare utilization benefits like reduced hospitalization and emergency department visits, lower rates of complications, workforce productivity benefits and public health system savings.34,35
This study contains several limitations that should be considered. Since data on referral follow-up was only tracked for the intervention group, we are unable to determine if there were any differences in uptake or engagement with those services. Also, while the full study group had lower PHQ-9 scores over 12 months, the scores were significantly reduced from an average of 4.70 to 2.37, the clinical significance of reductions in participants with baseline PHQ-9 scores below 5 remain uncertain due to PHQ-9’s validation limits for scores less than 5. 28 However, the close monitoring of PHQ-9 that is possible through a chronic care management program could be valuable by facilitating potential intervention when the PHQ-9 score is still subclinical, therefore proactively preventing depression in type 2 diabetes patients. Furthermore, we conducted subgroup analysis by baseline clinical depression severity and among participants with baseline depression (PHQ-9 score ≥5) and found a consistent significant longitudinal decline in clinical depression severity in our sample. Finally, the study’s sample predominantly consisted of Mexican American individuals facing unemployment and lacking health insurance and was gathered from a specific region on the US-Mexico border, specifically from patients at 2 federally qualified health centers. As a result, it is advisable to exercise caution when applying these findings to Mexican American populations in dissimilar regions or those with different demographic profiles.
We recommend further study of the chronic care management model and its relationship to depression levels in other Mexican American or Hispanic populations. Also, future research should study the cost-effectiveness of treating comorbid type 2 diabetes and depression using a chronic care management model versus standard community care. Lastly, future studies should assess whether reductions in depression severity contribute to improved medication adherence, fewer diabetes-related complications, and reduced healthcare utilization.
Conclusion
Although chronic care management models involve more resources to implement, these interventions may translate to cost-effective health and quality of life gains derived from their enhanced impact on diabetes and depression control. Our current study contributes evidence of the important associations between participation in a community-clinical diabetes intervention and improved depression symptoms among a low-income Mexican American population with diagnosed type 2 diabetes.
Footnotes
Acknowledgements
The authors thank the participants for their involvement in the trial and the UTHealth personnel and all clinical and non-profit partners for their collaborative work in implementing Salud y Vida. The authors would also like to recognize the funding for this trial from Methodist Healthcare Ministries, the Corporation for National and Community Service, and the National Center for Clinical and Translational Sciences. Lastly, the authors gratefully acknowledge the contributions of Dr. Joseph B. McCormick and Lisa Payne for their expertise and support with the implementation of the Salud y Vida program.
ORCID iDs
Ethical Considerations
This study was approved by the University of Texas Health Science Center in Houston’s Institutional Review Board and was registered with ClinicalTrials.gov (NCT04035395).
Funding
The author(s) disclosed receipt of the following financial support for the research, authorship, and/or publication of this article: This material is based on work supported by the Corporation for National and Community Service under Social Innovation Fund Grant Number 14SIHTX001. UTHealth is also a subgrantee of Methodist Healthcare Ministries’ Si Texas Project, a Social Innovation Fund (SIF) Program. Dr. Heredia was supported by a grant from the National Institute on Minority Health and Health Disparities (K01MD019149). This research was also supported by the National Center for Advancing Translational Sciences (NCATS) of the National Institutes of Health, through UTHealth-CCTS grant number UM1TR004906. Its contents are solely the responsibility of the authors and do not necessarily represent the official views of the Center for Clinical and Translational Sciences or the National Institutes of Health.
Declaration of Conflicting Interests
The author(s) declared no potential conflicts of interest with respect to the research, authorship, and/or publication of this article.
Data Availability Statement
The datasets generated during and/or analyzed in the current study are available from the corresponding author upon reasonable request.