
Abstract
Introduction/Objectives:
This real-world study examined adherence to repeat mt-sDNA among patients from federally qualified health centers (FQHCs) across the US and among different payer types.
Methods:
Data from Exact Sciences Laboratories, LLC were used for the period between January 1, 2023, and December 31, 2023, for those who had previously completed a mt-sDNA test. Study outcomes included adherence rate to mt-sDNA repeat screening and time to test return.
Results:
The study sample consisted of 19 536 eligible patients. The mt-sDNA repeat screening adherence rate was 79.7%, and the mean time to return the kit was 21.1 ± 20.8 days. Repeat screening adherence for patients with Medicare was 84.7%, Medicare Advantage was 80%, commercial insurance was 78.2%, managed care organization was 74.6%, and Medicaid was 65.9% (P < .001). Compared with patients covered by commercial insurance, those covered by Medicaid had 42% lower odds of adhering to mt-sDNA repeat screening. Patients with 2 or more prior successful tests had a numerically shorter mean time to test return compared to those with only 1 prior successful test.
Conclusions:
While repeat screening adherence was generally high across patient demographic categories, there were significant differences by type of insurance coverage and number of prior successful mt-sDNA screenings.
Introduction
Federally Qualified Health Centers (FQHCs) are community-based health care providers that play a critical role in addressing healthcare disparities and improving access to care for underserved patient populations, which are predominantly composed of ethnic minorities, low-income individuals, and the uninsured.1,2 FQHCs are strategically located in medically underserved areas, including rural communities, inner cities, and areas with high concentrations of low-income and minority populations. 3 One of the many services provided by FQHCs is screening for colorectal cancer (CRC), which is the fourth most frequently diagnosed cancer in the United States (estimated 152 810 new cases in 2024), and the second leading cause of cancer deaths (estimated 53 010 deaths in 2024).4,5 The US Preventive Services Task Force recommends initiating CRC screening at age 45, which has been shown to significantly reduce CRC-related mortality.6,7 In addition to initial screening, individuals should repeat testing every 1 to 10 years based on screening method, with 3 years being the recommended interval between negative mt-sDNA tests.8,9
While initial screening rates for CRC have increased from approximately 50% in 2005 to upwards of 70% in 2021, 10 they still fall short of the 80% goal set by the American Cancer Society. 11 It is not surprising, then, that several studies have shown that adherence to repeat screening varies widely by modality, and declines significantly after each successive screening.12 -16 Among stool-based screening methods, there is also significant heterogeneity in repeat screening rates, ranging from 14% to 80%.12,15,17,18 Ultimately, a lack of adherence to repeat screening undermines the effectiveness of stool-based screening approaches.13,19,20 Moreover, there are limited studies examining repeat screening rates specifically in patients served by FQHCs, 21 and no studies have examined repeat screening with mt-sDNA tests in FQHC patients.
These issues are further complicated by significant and pervasive disparities in initial and repeat CRC screening rates, which are linked to factors such as race/ethnicity, socioeconomic status, insurance status, and access to healthcare.5,22 -25 Despite these disparities, there has been relatively little research focused on repeat screening by specific subgroups. The current study examined adherence to rescreening with the mt-sDNA test among previous users of the mt-sDNA test from FQHCs across the US and among different payer types during the 2023 calendar year. In addition, the time taken to return the mt-sDNA test was also assessed.
Methods
Data Source
Laboratory data from Exact Sciences Laboratories LLC (ESL; Madison, WI) were used for the period between January 1, 2023, and December 31, 2023. All data were de-identified and compliant with the Health Insurance Portability and Accountability Act (HIPAA). Institutional Review Board (IRB) approval was not required because individual patient data were not identifiable (45 CFR § 46.104(d)(4)).
Study Design and Sample Selection
A retrospective cohort design was implemented. Patients were eligible for inclusion if they met the following criteria: (1) had an order for a repeat mt-sDNA test through a FQHC from anywhere in the US; (2) were between 45 and 85 years of age; (3) had insurance coverage through a commercial payer, managed care organization, Medicare Advantage, Medicaid, or Medicare; (4) received a shipment of Cologuard® mt-sDNA test between January 1, 2023, and December 31, 2023; (5) had previously completed a valid mt-sDNA screening with a negative result at least 2.5 years earlier; and (6) had no prior positive result from any Cologuard test.
Patients were excluded if: (1) the mt-sDNA test was not ordered through a point-of-care service (ie, any order not initiated during an appointment with a health care provider); (2) data were missing for sex, geographic location, or median household income (all of which were self-reported); (3) the patient had participated in any of ESL’s prospective studies (to minimize selection bias toward potentially more adherent patients); (4) they were unreachable by phone; or (5) a non-valid test was returned.
Variables and Outcomes
Collected demographic characteristics for patients included age category, sex, race, ethnicity, preferred language, geographic location, urban/rural classification (coded using the patient’s ZIP code and mapped using the “2010 Rural-Urban Commuting Area Codes”), 26 Social Vulnerability Index (SVI), 27 median household income by ZIP code, outreach channels, the number of prior successful mt-sDNA screening tests (1 test vs 2 or more tests), and outreach group. We defined four outreach groups based on the type(s) of overall communication patients received in addition to the standard outreach (which included welcome messages, reminders, and notifications of test result availability via letters and phone calls). The outreach groups included: (1) fully digital short message service (SMS) plus email, which received both additional SMS and email reminders; (2) digital SMS, which received additional SMS reminders only; (3) digital email, which received additional email reminders only; and (4) no digital communication, which received only the standard outreach, with no additional SMS texts or emails. These different outreach groups were included to determine which model of communication might be the most effective in promoting adherence.
Study outcomes included adherence rate to mt-sDNA repeat screening and time to test return. The mt-sDNA repeat screening adherence rate was defined as the percentage of eligible patients who completed and returned the test kit upon rescreening, with the returned kit received and a valid test result obtained by ESL within 180 days of the initial shipment date. Time to test return was defined as the number of days from the date the test kit was shipped to the patient (ie, the start date) to the date ESL received the test kit with a specimen (ie, the end date).
Statistical Analyses
The mt-sDNA repeat screening adherence rate and the mean number of days to test return were compared across different payer types based on the following patient characteristics: age category, sex, race, ethnicity, preferred language, urban/rural classification, median household income by ZIP code, outreach channels, SVI, and the number of prior successful tests. Repeat screening adherence rates were compared using the Chi-square test or Fisher’s Exact test (when observations were fewer than 5 in at least one cell of the comparison table). Mean days to test return were compared using an independent t-test (for 2 groups) or analysis of variance (for 3 or more groups).
Logistic regression was employed to evaluate the association between patient characteristics and mt-sDNA repeat screening adherence (binary outcome), while linear regression was used to assess the relationship between patient characteristics and time to test return in days (continuous outcome). The output from the linear regression was log-transformed due to the non-normal distribution of time to screening. In both regression models, covariates were included in the multivariable model if they had significant P-values in the descriptive, univariable analysis (race, ethnicity, and preferred language were excluded because most patients had missing or incomplete data). All statistical analyses were performed using R version 4.3.2 (The R Foundation for Statistical Computing, Vienna, Austria).
Results
Patient Characteristics
The final sample consisted of 19 536 eligible patients, including 6072 (31.1%) patients covered by commercial insurance, 2226 (11.4%) by managed care organization, 6331 (32.4%) by Medicare Advantage, 352 (1.8%) by Medicaid, and 4555 (23.4%) by Medicare. Table 1 provides an overview of patient characteristics overall and by payer type. Most patients had only 1 prior successful test (96.5% overall). The SVI was evenly distributed among SVI quartile 2 (less vulnerable, 24.4% overall), SVI quartile 3 (more vulnerable, 28.3% overall), and SVI quartile 4 (most vulnerable, 23.0%). Approximately 75% of patients received outreach through digital channels, either via SMS alone or with both SMS and email (ie, full digital). In the overall sample, 93.6% of patients were aged 45–75 years. Most patients lived in metropolitan areas (54.9% overall), followed by micropolitan areas (19.0% overall). The majority had a median household income by ZIP code between $50 000 and $75 000 (52.6% overall), followed by an income of less than $50 000 (26.9% overall). Lastly, a large proportion of patients fell into the “unknown” category for race (48.6% overall), ethnicity (52.6% overall), and preferred language (67.6%).
Patient Characteristics, Repeat Screening Adherence, and Days Between Kit Shipment and Valid Test Receipt.

Abbreviation: SVI, Social Vulnerability Index.
Repeat Screening Adherence Rates and Time to Test Return
The mt-sDNA repeat screening adherence rate was 79.7% (Table 1). Adherence rates significantly varied by payer type, with the highest for Medicare (84.7%) and the lowest for Medicaid (65.9%) (P < .001). Patients with 2 or more prior successful tests had significantly higher adherence (90.8%) compared to those with only 1 prior successful test (79.3%) (P < .001). The SVI was generally balanced across all quartiles (approximately 80%), with a slight association with more vulnerable quartiles having lower adherence. Patients receiving full digital outreach had the highest adherence rate (84.1%), followed by partial digital outreach (80.8% for email only and 78.7% for SMS only), while those with no digital outreach had the lowest adherence (72.9%). Repeat screening adherence rate was above 77% for all age groups, with the highest adherence observed among those aged 65–75 (82.0%).
Adherence rates were similar across the different geographic locations and were also comparable between females and males overall (80.1% vs 79.0%, respectively). Patients living in areas with the lowest median household income (less than $50 000) had numerically the lowest adherence (75.6%). For areas with median household incomes above $50 000, adherence rates were about 80%. In terms of race, American Indian or Alaska Native patients had the lowest adherence (69.4%), while White patients had the highest (79.2%).
The mean (SD) time from shipment of the mt-sDNA kit to the receipt of a valid test was 21.1 (20.8) days overall (Table 1). Across payer types, the mean (SD) time to test return ranged from 19.9 (19.5) days for Medicare beneficiaries to 23.9 (22.5) days for Medicaid recipients (P < .001). Patients with 2 or more prior successful tests had a numerically shorter mean time to test return compared to those with only 1 prior successful test. Patients receiving full digital outreach also had a numerically shorter mean time to test return compared to no digital outreach (21.0 vs 21.8 days).
Predictors of Repeat Screening Adherence
Compared with patients covered by commercial insurance, those covered by Medicaid had 42% lower odds of being adherent to mt-sDNA repeat screening (odds ratio [OR]: 0.582, 95% confidence interval [CI]: 0.461-0.733, P < .001), while those covered by Medicare Advantage or Medicare had 19% (OR: 1.194, 95% CI: 1.070-1.332, P = .002) and 56% (OR: 1.564, 95% CI: 1.381-1.770, P < .001) higher odds of being adherent, respectively (Table 2).
Logistic Regression Predictors of Repeat Screening Adherence Rate. a

Abbreviation: SVI, Social Vulnerability Index.
Repeat screening adherence rate: percentage of eligible patients who completed and returned the test kit upon rescreening, with the returned kit received and a valid test result obtained within 180 days of the initial shipment date.
Compared with a median household income of less than $50 000, those living in areas with higher median household incomes by patient ZIP code had significantly higher odds of being adherent: $50 000–$75 000 (OR: 1.326, 95% CI: 1.219-1.443, P < .001), $75 000–$100 000 (OR: 1.317, 95% CI: 1.168-1.485, P < .001), and $100 000–$125 000 (OR: 1.426, 95% CI: 1.161-1.752, P = .001). Adherence was lower among patients living in metropolitan areas, who had 28%, 27%, and 19% lower odds of being adherent compared to those residing in micropolitan, rural, and small-town areas, respectively (all P ≤ .002). Patients receiving full digital outreach (OR: 2.070, 95% CI: 1.864-2.299, P < .001) and those with 2 or more prior successful tests (OR: 2.254, 95% CI: 1.731-2.936, P < .001) both had more than twice the odds of being adherent compared with their respective counterparts (no digital outreach and only 1 prior successful test).
Predictors of Time to Return Test
Compared with the median household income of less than $50 000, those living in areas with higher median household incomes by patient ZIP code had significantly and increasingly longer times to test return, ranging from 2.8% longer for $50 000–$75 000 to 11.7% longer for $100 000–$125 000 (Table 3). Time to test return was significantly shorter among males compared to females; among older patients compared to those aged 45–64 years (9.2% shorter for ages 65–75 and 14.1% shorter for ages 76–85); and among those with 2 or more prior successesful tests compared to those with only 1 prior successful test (17.2% shorter).
Linear Regression Predictors of Days Between Kit Shipment and Valid Test Receipt. a
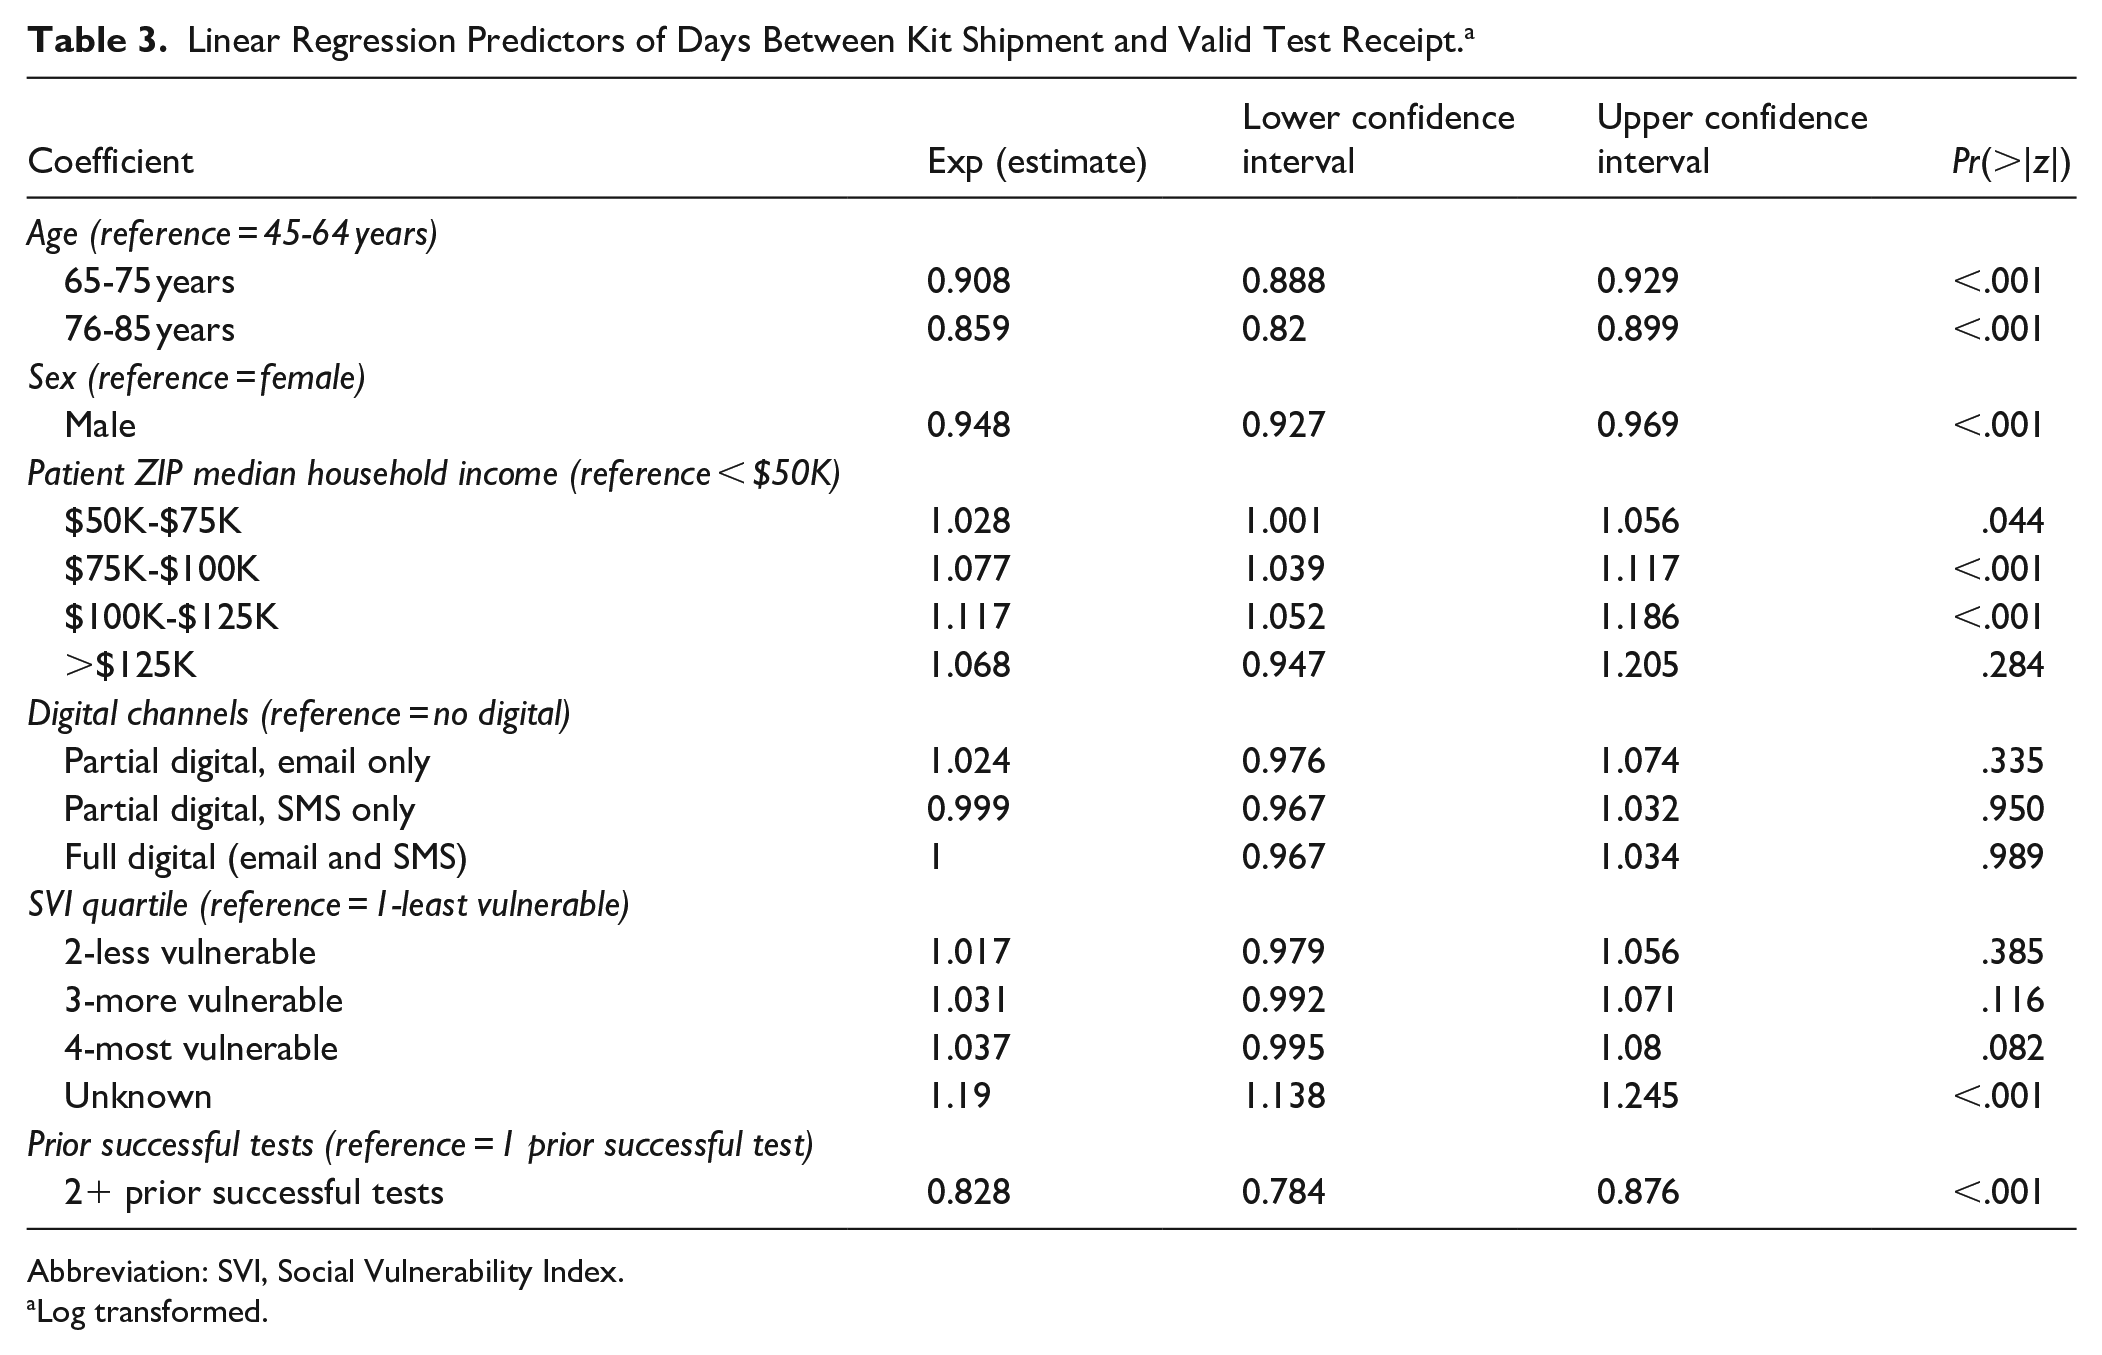
Abbreviation: SVI, Social Vulnerability Index.
Log transformed.
Discussion
The current real-world study found that adherence to repeat screening in patients served by FQHCs to be generally high, with 79% of patients who had previously completed a mt-sDNA test adherent to repeat screening and 91% adherence in patients with 2 or more prior successful mt-sDNA tests. A previous systematic literature review of studies from various countries reported a median adherence rate of 46.6% for the second round of FIT testing. 15
These previous results contrast with the high adherence to repeat screening with mt-sDNA tests reported here, which underscores the role of mt-sDNA testing in helping to achieve the Healthy People 2030 target. Furthermore, a non-FQHC study assessing trends in CRC screening and the effects of various modalities (colonoscopy, sigmoidoscopy, CT colonography, mt-sDNA, FOBT, FIT) on screening rates revealed an overall increase from 47.7% in 2005 to 60.7% in 2010, and, after plateauing until 2015, the rate increased again from 63.5% in 2015 to 69.9% in 2018, primarily fueled by the growing use of mt-sDNA, which rose from 2.5% in 2018 to 6.6% in 2021. 10 This study also found that the contribution of mt-sDNA to the increase in overall screening rates was significant (P < .0001) between 2018 and 2021. 10
Despite the overall high repeat screening rates, the current study also found, both descriptively and after adjustment for covariates, significant disparities in adherence based on a several different individual and demographic characteristics. Regarding payer type, patients covered by Medicaid exhibited the lowest adherence rates and were significantly less likely to adhere than patients with commercial insurance, while those covered by Medicare showed the highest adherence. This observation is consistent with prior studies demonstrating lower screening adherence among Medicaid recipients compared with those with private insurance.28 -31 For instance, screening rates with mt-sDNA testing have ranged from 38.9% to 54.6% for Medicaid patients and from 69.1% to 72.1% for Medicare patients.32,33 In prior studies, high rates of cross-sectional adherence have been reported for mt-sDNA (51%-67%),32,33 including higher rates compared to those for FIT/gFOBT (12%-41%).34 -38
Differences in demographics included race, age, income, and rural/metropolitan status. In terms of race, the findings from the current study are consistent with previous research.23,39,40 White patients had the highest overall adherence to repeat screening compared to other racial groups, including Black or African American and American Indian or Alaska Native patients. Lower adherence in Black and American Indian or Alaska Native patients is particularly concerning, given that CRC incidence and mortality rates are the highest in these two groups.41 -43 At the descriptive level, repeat screening rates were lower in younger patients; however, the impact of age was not uniquely significant after controlling for other demographic predictors in the logistic regression model, suggesting that characteristics such as payer type and income are more salient predictors. Adherence also varied by income level, with patients residing in ZIP codes where the median household income was under $50 000 per year showing the lowest adherence. Results from the logistic regression model further showed that, after controlling for other predictors, patients with higher incomes were more likely to be adherent to repeat screening than those earning under $50 000 per year. However, this association was not statistically significant for patients residing in areas where the median household income was over $125 000, which may be due to the very low number of patients in this category (n = 170, 0.9%).
Furthermore, patients in metropolitan areas had the lowest adherence to repeat screening, and results from the logistic regression suggested that individuals in other urban/rural classifications were significantly more adherent than those in metropolitan areas. One possible explanation for this finding is that the low adherence rate among the Medicaid population may be driving the overall low adherence in metropolitan areas. There were also more Medicaid patients living in metropolitan areas than anywhere else, suggesting that these patients may be living in urban underserved communities. Although studies have shown that rural populations generally have lower screening rates than urban populations, 44 screening rates can still be very low in urban underserved areas. For example, one study reported only 11.5% screening completion within 1 year of an initial primary care visit at a large urban safety-net hospital in New York City. 45 Given the differences in adherence due to race, income, and insurance type, it is not surprising that patients with high social vulnerability, as assessed by the SVI, had the lowest rescreening rates. Finally, digital outreach with both SMS and email increased the likelihood of rescreening adherence by almost 2-fold compared with no digital outreach.
The current study found an average return time of 21 days in the overall population. Patients covered by Medicaid took the longest time to return the test kit, with an average of about 24 days, while Medicare patients had the shortest time, at about 20 days. This correlates with the repeat screening adherence rate results, as Medicaid had the lowest rate (65.9%) among all payer types, while Medicare had the highest (84.7%). Based on linear regression, having 2 or more prior successful tests was a strong predictor of returning the test in a shorter time, and it also mirrored its role as a predictor of higher adherence. However, the rest of the linear regression predictors for a shorter time to test return did not align with those of the logistic regression predictors for a higher repeat screening adherence rate, including SVI, digital outreach, age, and patient median household income by ZIP code. Descriptively, having only 1 prior successful test (vs 2 or more), no digital outreach, being younger, living in a metropolitan area, or being female were associated with longer times to test return. These findings are similar to a previous study, which reported that younger patients, females, or those with Medicare (vs commercial insurance) had, on average, longer times to return completed FITs. 46 Understanding the barriers or factors that affect patients’ timely return of stool tests is crucial for improving the screening process, as delays in this early step can have significant downstream consequences. 46 One study found that the longer a person waited to follow up on a positive stool test, the greater their risk of colorectal cancer and the more advanced the disease stage at the time of diagnosis. 47 Additional research is needed to more fully understand the predictors of time to return a valid mt-sDNA test, including whether there are clinically valid time thresholds that may better characterize the outcome.
Limitations
Results from this analysis should be considered alongside some caveats. First, the current study only examined repeat screening rates of patients using mt-sDNA and did not compare these rates to other screening modalities. Second, it is possible that patients who failed to complete a repeat screening with mt-sDNA test elected to use another screening modality, potentially leading to an underestimation of CRC repeat screening rates in the current study. Third, the income variable was based on median income by ZIP code, which may have overestimated income for some individuals, particularly homeless individuals who represent approximately 5% of the FQHC population.1,2 Finally, the study was unable to include uninsured patients, who comprise approximately 20% of the FQHC patient population, thereby reducing the generalizability of the study findings to uninsured patients.
Conclusions
The current real-world study suggests that patients receiving care from FQHCs have relatively high CRC repeat screening rates with the Cologuard mt-sDNA test. This is particularly encouraging given that the use of mt-sDNA has increased over the last 5 years, particularly among minority groups. 16 While screening rates were generally high across many participant characteristics, significant differences in repeat screening rates did emerge based on type of insurance coverage, median household income, rural/metropolitan status, outreach channel, and number of prior successful mt-sDNA screening tests. Like in previous studies, adherence to repeat screening among patients from minority groups, who are at the highest risk for CRC, remained suboptimal, highlighting the continued importance of focusing efforts to ensure that individuals from disadvantaged backgrounds are afforded the opportunity to screen and rescreen for CRC.
Footnotes
Acknowledgements
Medical writing support was provided by Jason Allaire, PhD of Generativity Health Economics and Outcomes Research and wad funded by Exact Sciences Laboratories LLC.
Author’s Note
Martha Duarte is now affiliated to Sanitas, Miami, FL USA.
Ethical Considerations
The study was considered exempt research under 45 CFR § 46.104(d)(4) as it involved only the secondary use of data that were de-identified in compliance with the Health Insurance Portability and Accountability Act (HIPAA), specifically, 45 CFR § 164.514.
Funding
The author(s) disclosed receipt of the following financial support for the research, authorship, and/or publication of this article: This study was funded by Exact Sciences Laboratories LLC.
Declaration of Conflicting Interests
The author(s) declared the following potential conflicts of interest with respect to the research, authorship, and/or publication of this article: Greene, Pew, and Limburg are employees of and own stock in Exact Sciences Laboratories, LLC. Zapatier, Rincón López, and Duarte have nothing to disclose.
Data Availability Statement
The data that support the findings of this study are available from Exact Sciences Laboratories LLC. Restrictions apply to the availability of these data, which were used under license for this study. Data are available from the authors with the permission of Exact Sciences Laboratories LLC.