
Abstract
Introduction:
A causal relationship exists between salt intake and hypertension, stroke, and kidney disease. However, whether or not reduced salt intake slows progression of renal diseases has been intensely debated.
Methods:
In this prospective, open-label, randomized controlled trial, we examined the impact of a low salt diet on renal function, blood pressure, and other metabolic parameters. Herein, 194 patients with chronic kidney disease (CKD) stages 1 to 3 were randomized in low salt (intervention) and control groups. The intervention group was provided a low salt diet (1.5 g/day) for 3 months. The control group consumed their usual diet, and daily food intake was recorded in the control group. Renal function tests, 24-h urinary sodium excretion, urinary protein, serum calcium, phosphorus, and electrolyte levels were recorded monthly.
Results:
After 3 months, the mean reduction in estimated glomerular filtration rate was significantly higher in the control group (mean reduction in eGFR, −3.011 mL/min/1.73 m2; 95% confidence interval (CI) = −5.367, −0.656, P = .013). Blood pressure (BP) decreased significantly in both groups; systolic and diastolic BP reduction at 3 months was significantly greater in the intervention group (systolic BP mean reduction −6.57/−4.29 mmHg; 95% CI = −10.24, −2.89) and diastolic BP mean reduction −6.95, −1.64 mmHg) compared with the control group (systolic BP mean reduction −0.58/−2.63 mmHg; 95%, CI = −4.33, 3.17 and diastolic BP mean reduction −5.34, −0.08 mmHg). The mean reduction in 24-h urine sodium excretion was greater in the intervention group, reaching a significant level at month 2 (−14.45 mmol/day; 95% CI = −27.63, −1.22).
Conclusion:
Overall, salt restriction can help slow the progression of renal insufficiency and results in statistically significant and clinically important reductions in BP among patients with CKD.
ClinicalTrials.Gov Identifier:
NCT05716386 on 28/01/2023.
Introduction
Dietary sodium intake has been reported to have an influence on cardiovascular risk factors and kidney outcomes in several patient groups including patients with CKD.1,2 A growing body of evidence suggests that higher sodium consumption contributes to higher blood pressure (BP), 3 thereby increasing the risk of cardiovascular disease (CVD).4,5 According to WHO, restricting sodium intake to <2.0 g/day, corresponding to 5.8 g of salt (or 100 mmol), is one of the most cost-effective measures for improving public health. 6
Studies also demonstrate the beneficial effects of salt reduction among patients with CKD and healthy people.7,8 A recent review of the evidence on the relationship between salt intake and CKD progression concluded that consistent evidence suggests that dietary salt intake is linked to albuminuria and tissue injury.2,7
High salt intake is closely associated with CKD progression. Furthermore, when the urine sodium-to-creatinine ratio increases by 100 mmol/L, the risk of CKD developing into end stage renal disease (ESRD) increases 1.61 times.9,10 A trial evaluating the effect of a low salt diet on CKD progression demonstrated that among patients with CKD, salt reduction has additional beneficial effects on renal function and reduction of proteinuria, independent of its blood pressure-lowering effect. 11 However, the follow-up of this trial was short. Garofalo et al 12 performed a meta-analysis of 9 studies including 738 patients with CKD; they reported that low sodium intake (4.4 g/day) significantly reduced systolic BP by 4.9 mmHg (95% confidence interval [CI] = 6.8/31 mmHg, P < .001) and diastolic BP by 2 mmHg (95% CI = 6.8/3.1 mmHg, P < .001). In the CRIC study, 13 which followed a cohort of 3757 patients with CKD for approximately 7 years, the high urine sodium group (>195 mmol/day) had a significantly increased risk of CKD progression and CVD. These data support the evidence that reducing dietary sodium can reduce cardiovascular risk and the rate of CKD progression.
However, restriction in dietary sodium intake also activates the renin-angiotensin-aldosterone system (RAAS) and sympathetic nervous system.14 -16 To date, studies on the association between sodium intake and CKD progression have yielded inconsistent results. 17 Although several studies have shown that high dietary sodium intake increases the risk of CKD development or progression,9,10,18 some studies have failed to find significant connections with renal outcomes.19 -22 In addition, it has been reported that lower 24-h urine sodium excretion is associated with a higher risk of death and ESRD among individuals with type 1 and 2 diabetes with overt proteinuria.22,23 This study aimed to determine whether an intensive short term, sodium-restricted dietary intervention has beneficial effects on the glomerular filtration rate (GFR) and susceptibility to proteinuria, both measures of kidney function, in addition to BP and metabolic markers among patients with CKD.
Methods
This prospective, open-label, randomized controlled trial was conducted from 1 December 2022 to 31 August 2023 at the Faculty of Medicine, Vajira Hospital, and a private hospital (Kasemrad Prachachuen Hospital) from 1 April 2023 to 31 August 2023. Written informed consent was obtained from all participants before study inclusion. This study was approved by the Institutional Review Board of the local hospitals which complied with the tenets of the Declaration of Helsinki, and Consolidated Standards of Reporting Trials (CONSORT) checklist was used as a reference. This study was registered in The ClinicalTrials.Gov, identifier: NCT05716386 on 28/01/2023.
Participants and Randomization
The inclusion criteria were as follows: patients (i) aged 18 to 80 years with CKD stages 1 to 3 (eGFR ≥30 mL/min/1.73 m2); (ii) without a recent history of acute illness or hospitalization; and (iii) with a BP of >135/85 mmHg or controlled BP with the use of antihypertensive medications. The exclusion criteria were as follows: patients (i) with serious primary diseases affecting major organs such as the heart, brain, lung, liver, or the hematopoietic system; (ii) with active cancers or other acute infectious diseases; (iii) who were pregnant; (iv) who had undergone postsolid organ transplantation; and (v) with terminal illness.
Eligible patients received an invitation, information regarding the procedure and confidentiality, an informed consent form, and a baseline questionnaire. Eligible patients were randomly assigned to 2 groups using a computer-based block randomization procedure: (i) the low sodium diet group and (ii) the control group. The low sodium diet group was prescribed a diet containing 1.5 g/day of salt distributed across 3 main meals for 3 months. The diet was prepared by nutritionists and delivered directly to the patients’ homes. The specific components of this diet are described in Supplementarl File 1. In contrast, the control group continued with their usual diet . Both groups received standard care according to the National Kidney Foundation-Kidney Disease Outcomes Quality Initiative and Thai CKD guidelines. 24 Throughout the intervention, patients were paired with dietitians and research assistants who conducted dietary recall interviews and provided instructions on the low salt diet protocol. The dietary history of the control group, involving collecting information about what type of food was consumed over an extended period using open-ended questionnaires, has been favorably compared with other dietary assessment methods, such as food records or 24-h recall. This method has been comprehensively reviewed for nutrients other than sodium. 25 Diet history was recorded using a food frequency questionnaire (FFQ), composed of a list of foods. Patients were asked to identify the frequency of consumption of each food item in broad terms, eg, daily or weekly). 26 The proportion and estimation of sodium intake and other nutrient components were calculated using the “Immucal” Program (Nutrient calculation software V.4.0 database NM2 20219), designed by the Institute of Nutrition, Mahidol University. This software converts the dietary record to the proportions of each nutrient.
Measurements and Outcomes Data Acquisition
Measuring dietary adherence in a dietary intervention trial is imperative to ensure that changes in outcomes are attributable to changes in intake. Data were collected at baseline and every month during the 3-month intervention period. Sociodemographic, anthropometric and medical data were collected at baseline. Biochemical data (complete blood count values, renal function test values and electrolyte, and calcium and phosphorus levels) were recorded. During each monthly patient visit, BP levels were measured. Urinary sodium excretion was estimated from a 24-h urine collection at baseline and at 1, 2, and 3 months. Urinary volume, urinary creatinine excretion, and reported urine collection time were used to assess the completeness of urine collection, and these are considered by the WHO as the gold standard for monitoring adherence. 27 The control group was assessed using a self-reported dietary intake assessment method, as previously described. 25 Diet history is considered useful for capturing daily food intake and aligns closely with the dietary assessment methods used in clinical trials. The diet of the control group is presented in Supplemental File 2. Blood tests were repeated at the end of the study.
The primary endpoint was the rate of eGFR decline. The secondary endpoint was the effect of the low salt diet on blood pressure, acid-base status, calcium phosphate balance and proteinuria.
Statistical Analysis
This randomized controlled trial was designed to determine the effect of low dietary salt on CKD progression by comparing the rate of change in the eGFR between the control and intervention groups. Using the study by Ahn et al, 28 we then calculated the sample size for at least 200 participants including anticipated dropout rate of 10% across both treatments to achieve 80% power, with 95% confidence interval (Supplemental File 3).
Descriptive statistics were computed to describe the baseline characteristics of the study population. Continuous variables with a normal distribution were presented as means ± standard deviation (SD) to investigate the effectiveness of the intervention. Continuous variables with skewed distribution were presented as medians and interquartile ranges, while categorical variables were presented as frequencies and percentages and compared using Pearson’s chi-square or Fisher’s exact test according to the data type. A P-value of <.05 was considered statistically significant.
The comparison between the rates of CKD progression, including parameters such as eGFR, blood urea nitrogen, creatinine, 24-h urine protein, blood pressure, acid-base balance, and calcium-phosphate balance at each time point (before and after intervention), was evaluated using Student’s t-test or Mann-Whitney U test, according to the distribution of variables. The repeated measures analysis of variance, repeated measures analysis of covariance, generalized estimating equation, or generalized linear mixed model were used to compare changes among the same patients over the 3-month intervention according to the distribution of variables. IBM SPSS Statistics for Windows, Version 28.0 (Armonk, NY, USA) was used for analysis.
Results
The study flow is summarized in the CONSORT flow chart in Figure 1. In total, 194 of 254 (76.37%) eligible patients provided written informed consent and were included in the primary intention-to-treat analysis. After that, the patients were allocated to 2 groups (intervention group, n = 99; control group, n = 95). During the trial, 19 patients dropped out, leaving 194 (91.10%) patients who completed the trial. The baseline characteristics of the participants are presented in Table 1. The mean ± SD age of the participants was 61.72 ± 11.47 years in the intervention group (n = 99) and 61.00 ± 12.67 years in the control group (n = 95). No significant differences were noted between groups regarding demographic features, mean eGFR, 24-h urine sodium, and other electrolyte values. Most patients were considered to have CKD stage 3 (66.7% and 68.5% in the intervention and control group, respectively), and one-fourth of the patients in each group had morbid obesity (body mass index [BMI] ≥30 kg/m2).

CONSORT diagram and study flow.
Baseline Characteristics of the Study Participants.
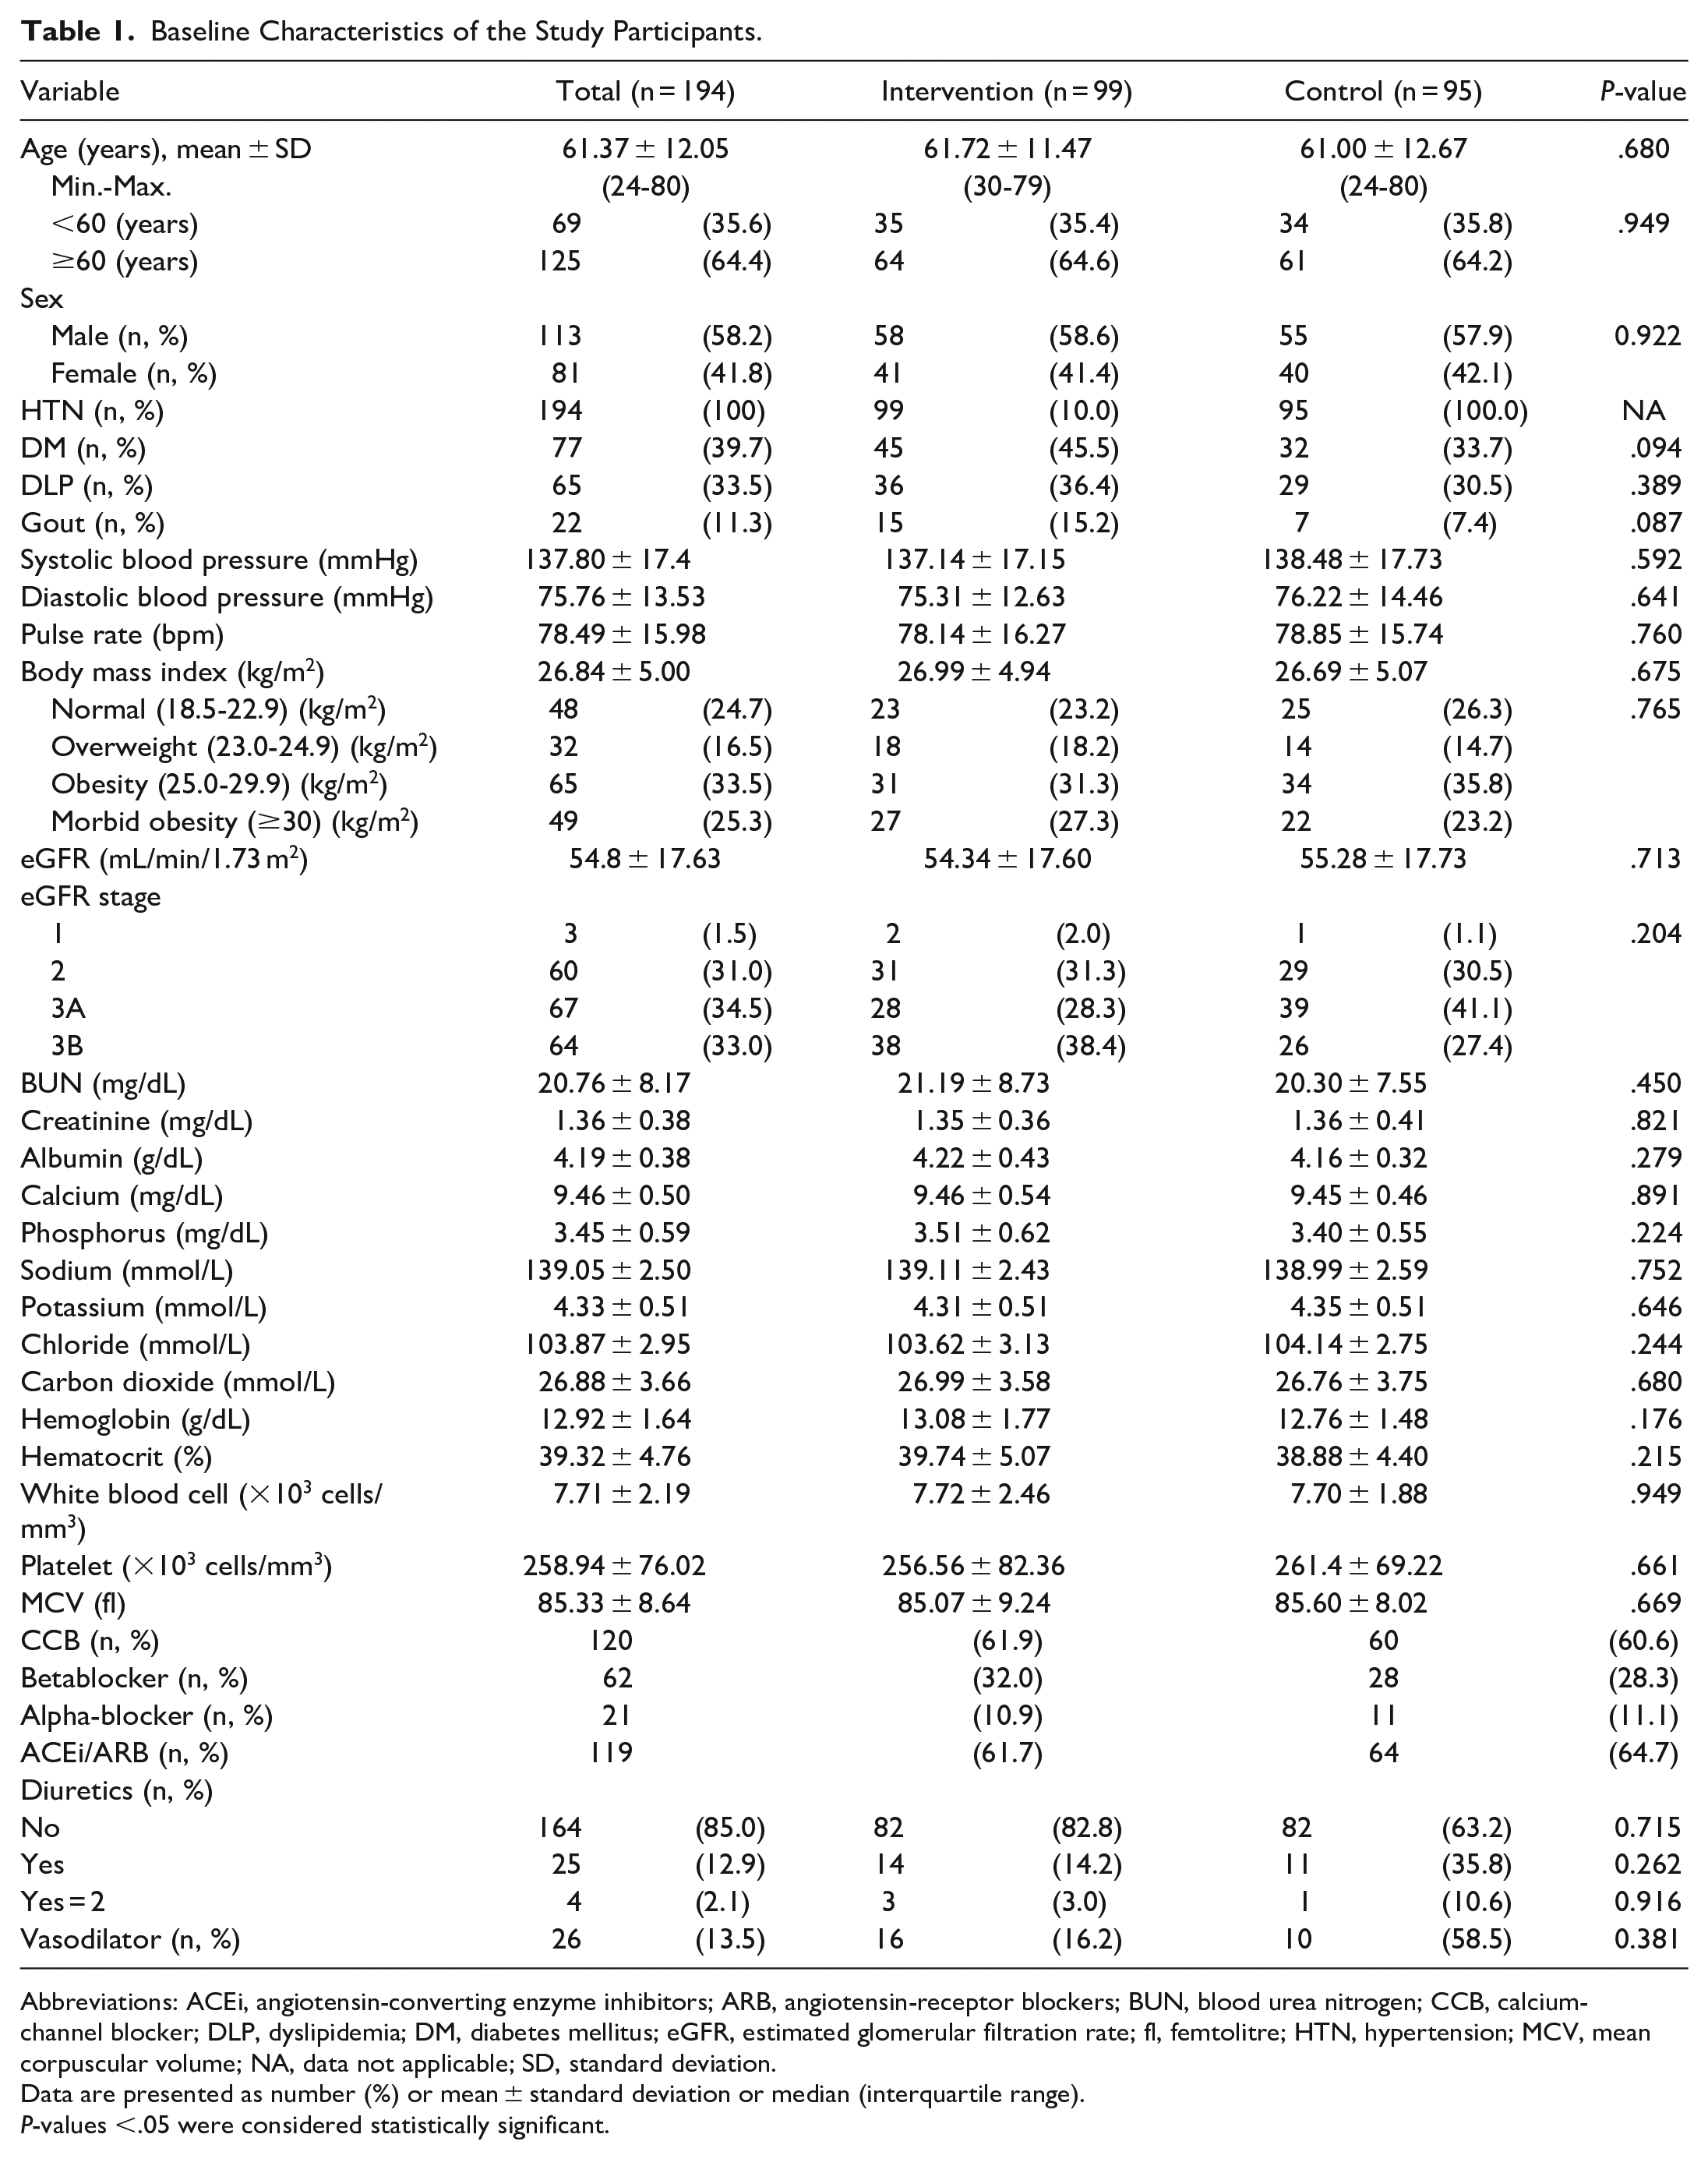
Abbreviations: ACEi, angiotensin-converting enzyme inhibitors; ARB, angiotensin-receptor blockers; BUN, blood urea nitrogen; CCB, calcium-channel blocker; DLP, dyslipidemia; DM, diabetes mellitus; eGFR, estimated glomerular filtration rate; fl, femtolitre; HTN, hypertension; MCV, mean corpuscular volume; NA, data not applicable; SD, standard deviation.
Data are presented as number (%) or mean ± standard deviation or median (interquartile range).
P-values <.05 were considered statistically significant.
Effects of Dietary Sodium Restriction on Renal Progression and Proteinuria
Renal function, as measured by the eGFR, at 3 months did not change significantly from the baseline period in the intervention group (Table 2). The eGFR decreased overtime in both groups at 3 months, and this effect was significantly greater in the control group (baseline: in the intervention group was 54.34 ± 17.60 mL/min/1.73 m2, 52.77 ± 18.03 mL/min/1.73 m2 at 3 months, and mean difference was −1.491, 95% CI = −3.197, 0.215; P = .086 while for the control group, it was 55.28 ± 17.73 mL/min/1.73 m2 at baseline. About 52.27 ± 15.83 mL/min/1.73 m2 at 3 months; and mean difference −3.011, 95% CI = −5.367, −0.656, P = .013; Figure 2).
Comparison of Laboratory Data at 3 months With That at Baseline in Both Intervention and Control Group.
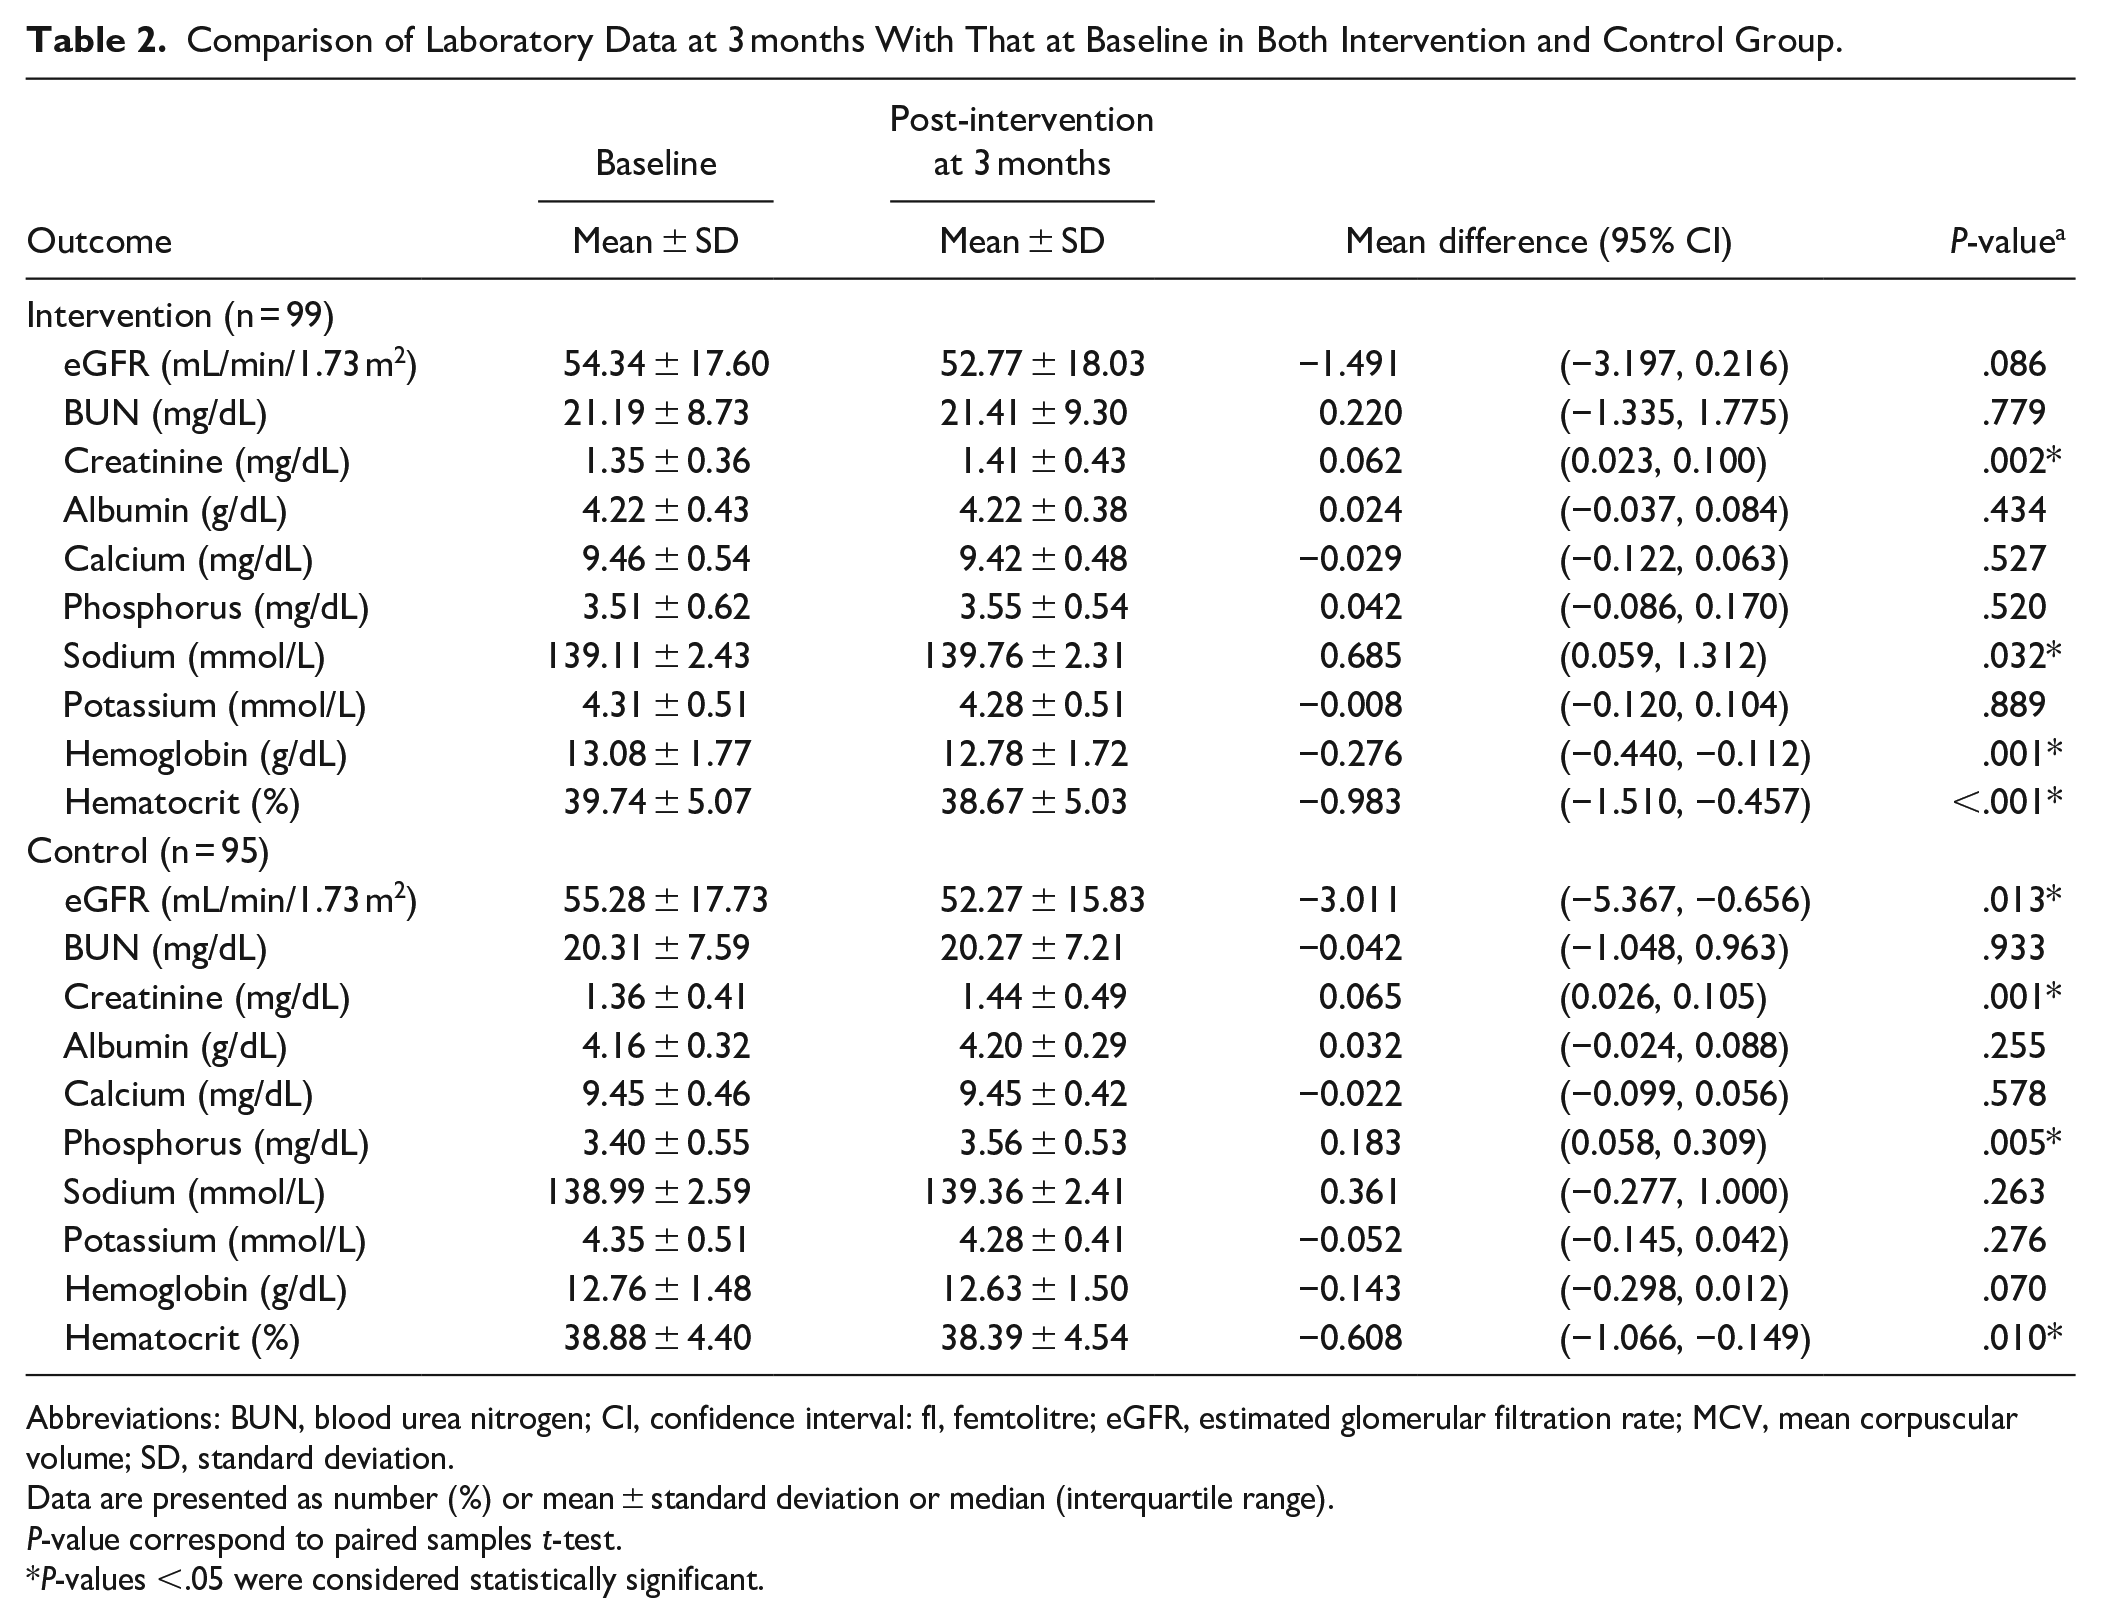
Abbreviations: BUN, blood urea nitrogen; CI, confidence interval: fl, femtolitre; eGFR, estimated glomerular filtration rate; MCV, mean corpuscular volume; SD, standard deviation.
Data are presented as number (%) or mean ± standard deviation or median (interquartile range).
P-value correspond to paired samples t-test.
P-values <.05 were considered statistically significant.

eGFR at baseline and 3 months during the trial. Data are mean ± SD.
Albuminuria remained unchanged overtime in both the control (baseline : 206.91 ± 198.74 mg/day, 3 months: 192 ± 217.63 mg/day, change from baseline −2.66 mg/day; 95% CI = −42.92, 37.60, P = .897 in the intervention group and the control group had baseline; 259.05 ± 299.34 mg/day; 3 months 264.75 ± 328.13 mg/day; change from baseline −11.52 mg/day; 95% CI = −53.39, 30.34, P = .590)
Effects of Dietary Sodium Restriction on Hemoglobin and Other Metabolic Markers
The hematocrit decreased significantly in both groups after 3 months. No significant changes in other laboratory data were detected for either treatment, except for serum sodium and chloride levels of the intervention group, showing a significant increase at 3 months, whereas serum phosphorus levels of the control group showed a significant increase at 3 months (Table 2).
Effect of Dietary Sodium Restriction on Ambulatory BP and Other Outcomes
The changes in BP are presented in Table 3. BP decreased significantly in both groups. The reduction in systolic BP at 3 months was significantly greater in the low salt group than in the control group (change from baseline in the intervention group, −6.57, [95% CI = −10.24 to −2.89] mmHg, P < .001; control group, −0.58, [95% CI = −4.33 to 3.17], P = .072; Supplemental File 4).
Effect of Low Salt Diet on Blood Pressure in the 2 Groups Comparing Baseline Data and Changes From Baseline Including Differences Between the Groups.
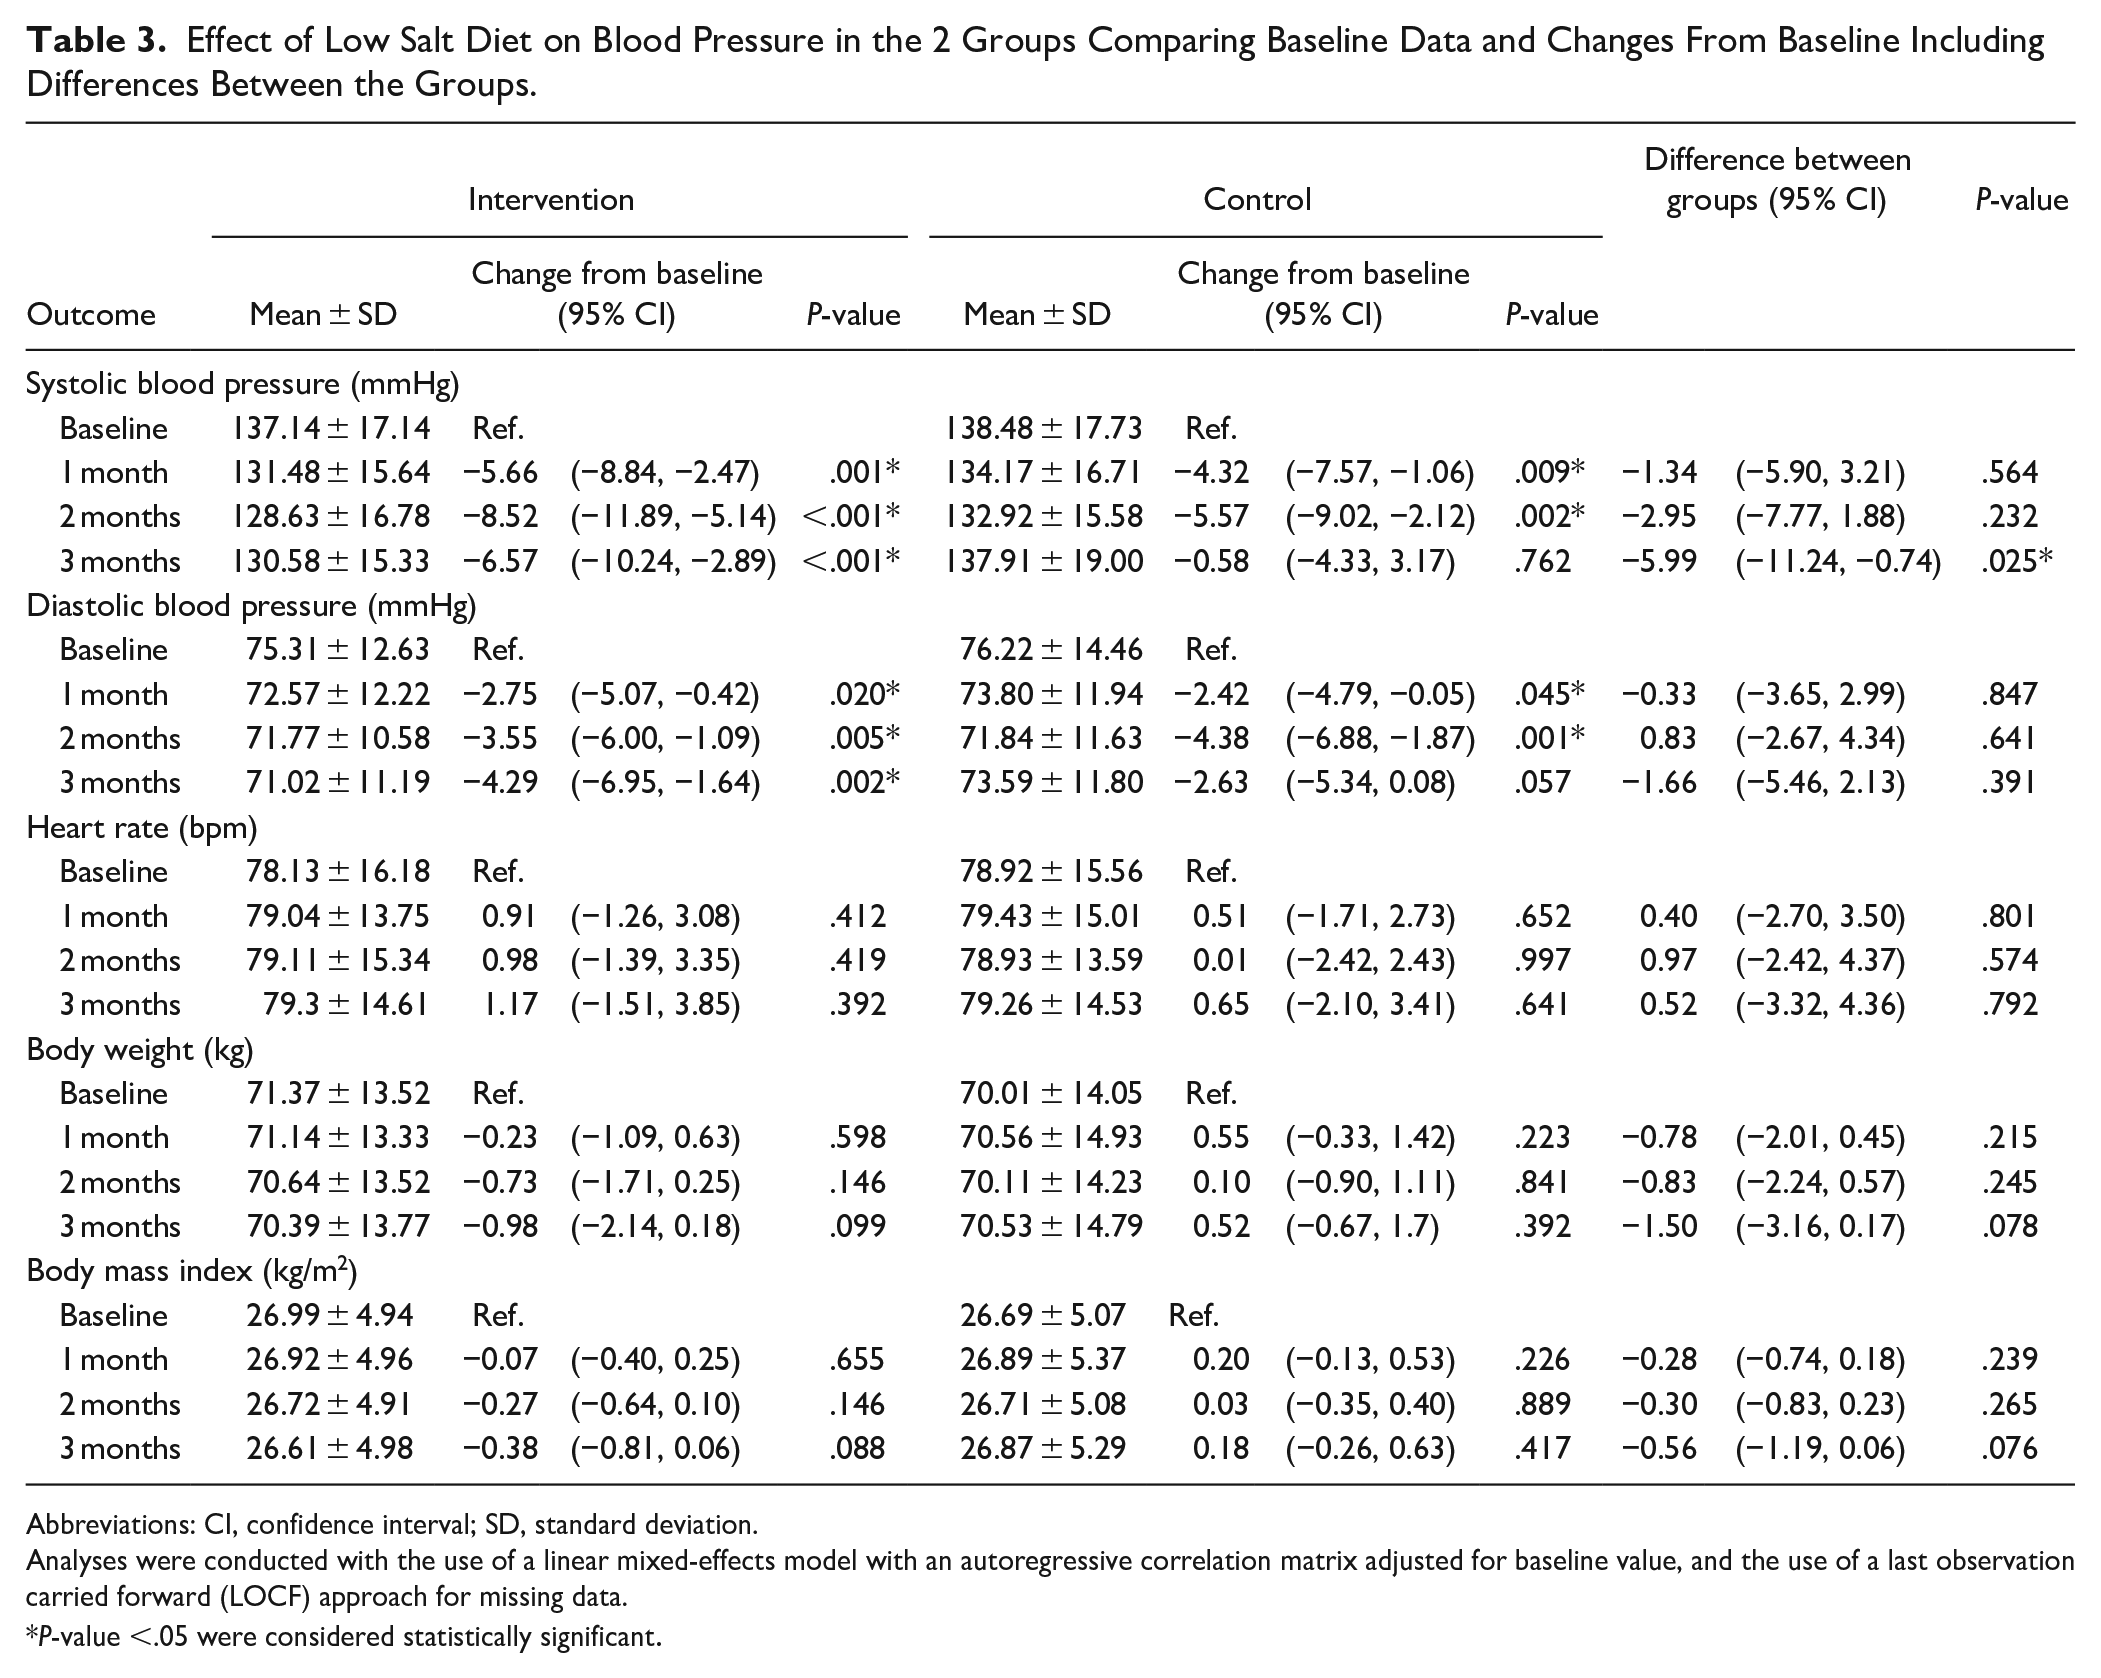
Abbreviations: CI, confidence interval; SD, standard deviation.
Analyses were conducted with the use of a linear mixed-effects model with an autoregressive correlation matrix adjusted for baseline value, and the use of a last observation carried forward (LOCF) approach for missing data.
P-value <.05 were considered statistically significant.
No changes were observed in the heart rate, body weight, and BMI from the baseline values in either group, although body weight tended to decrease in the intervention group (mean change = −0.35, 95% CI = −0.72 to −0.03 mmHg). The difference in BP changes between the groups lacked statistical significance (P = .391).
Effect of Dietary Sodium Restriction on 24-h Urinary Electrolytes
Several significant differences were observed at the end of the intervention period (Table 4). The mean 24-h urinary sodium excretion was 136.88 ± 77.18 mmol/L at baseline in the intervention group and a reduction was observed at 3 months; however, it reached statistical significance in month 2 (120.87 ± 69.94 mmol/L; change from baseline: −14.45 mmol/24 h [95% CI = −27.68 to −1.22], P = .032). No significant reduction in urinary sodium excretion was observed in the control group (136.36 ± 63.65 vs 134.04 ± 66.46 mmol/L, change from baseline = −11.52 mmol/day, 95% CI = −53.39, 30.34, P = .590) at 3 months. Reduction in 24-h urine sodium was not significantly differ between groups (−6.60 mmoL/day; 95% CI: −16.30 to 3.09, P = 0.182; Figure 3, Supplemental File 5).
Effect of Low Salt Diet on 24-h Urine Protein and Electrolytes in the 2 Groups.

Abbreviation: CI, confidence interval.
The data presented changes of parameters from baseline throughout the study periods in 3 months and difference between the 2 groups at all time points. Analyses were conducted with the use of a linear mixed-effects model with an exchangeable correlation matrix adjusted for baseline value. and the use of a last observation carried forward (LOCF) approach for missing data.
P-values <.05 were considered statistically significant.

Mean changes and 95% CI of urinary sodium excretion in low-salt diet and control groups.
A significant change was found in mean 24-h urinary potassium levels in the control group at month 2 (−4.31 mmol/L, 95% CI = −7.65 to −0.97, P = .012; Table 4). No significant differences were detected between the groups for any of the other urine indices.
Discussion
This randomized controlled trial examined the effects of an intensive short term, sodium-restricted, dietary intervention on eGFR and susceptibility to proteinuria, blood pressure, and metabolic markers. The key findings are listed below.
(i) At 3 months, the reduction in systolic BP was significantly greater in the low salt intervention group than in the control group.
(ii) At 3 months, a significant reduction in urinary sodium excretion was observed in the intervention group, as opposed to the control group.
(iii) At 3 months, the eGFR decreased in both groups, and this effect was significantly greater in the control group.
Consistent evidence has identified excessive dietary sodium intake as a risk factor for CVD and its impact on CKD progression among patients with CKD. However, limited evidence is available regarding the role of low salt consumption in clinically significant reductions in ESRD, cardiovascular events, and all-cause mortality. 29 Numerous studies have indicated that increased salt consumption is associated with increased albuminuria and the possibility of decreased eGFR.17,30 Pooled analysis in 1 meta-analysis showed a significant improvement in proteinuria of 0.4 g/day (95% CI = 0.2-0.6 g/day) associated with lower salt intake. 17 Proteinuria and albuminuria have been reported as major risk factors for the progression of type 2 diabetic kidney disease.31,32 However, 1 meta-analysis reported no compelling evidence of a reduction in the eGFR decline rate or proteinuria following a low salt diet. 33 In our study, the eGFR declined in both groups, probably due to the anticipated progression of CKD. Nevertheless, the mean change in eGFR from baseline was greater in the control group (−3.011, 95% CI = −5.367, −0.656) than in the intervention group (−1.491, 95% CI = −3.397, 0.216), although no between-group differences were found in the final eGFR at follow-up period .In addition, our study did not show significant changes in proteinuria (mean difference: 034; 95% CI = −27.38, 28.06). The beneficial effects of salt restriction on CKD progression independent of proteinuria might be related to other factors such as BP decrement in the intervention group. The beneficial effects of salt restriction on CKD progression have been proposed to ameliorate hypertension, decrease the generation of Na/KATPase inhibitors, TGF-β, and activate the intrarenal renin-angiotensin system (RAS) in damaged kidneys.34,35
We found that a low sodium dietary intervention resulted in a significant reduction in BP. This is comparable to related studies showing that lowering salt intake can significantly reduce blood pressure.36 -38 Lowering salt intake can significantly reduce BP through changes in fluid volume, mediated by the renin angiotensin-aldosterone system and also other mediators, for example, vascular stiffness or inflammation. In addition, dietary sodium can optimize the effect of several classes of antihypertensives including the RAAS blockade. 39 The overall effect of a low salt diet on individuals with HTN likely depends on salt sensitivity, categorizing individuals in salt-sensitive and salt-insensitive groups. 40 Approximately 50% to 60% of individuals with HTN are estimated to be salt-sensitive, and our group of patients was likely to be in the salt-sensitive category. We found that body weight decreased in the low sodium group, although the difference was not significant. High salt intake has been reported to be positively associated with stomach cancer and obesity. Thus, lower salt intake reduces body weight. 41
Related studies have indicated the efficacy of sodium restriction in reducing BP for their respective populations, most lasted for 2 to 8 weeks, and the daily salt reduction was in the range of 4.3 to 9.3 g/day. This resulted in a reduction of BP in the range of 3.9 to 5.9/1.9 to 3.8 mmHg (systolic/diastolic) among individuals with HTN and 1.2 to 2.4/0.3 to 1.1 mmHg (systolic/diastolic) among normotensive individuals. 41 In our study, the intervention group consumed 1.5 g of sodium daily, whereas the control group consumed an average of 2.5 g of sodium daily. The BP reduction was comparable or even better than that of related trials (6.57/4.29 mmHg) which could have been due to lower salt intake in our study. The diastolic blood pressure reduced in both groups, while the mean reduction was greater in the intervention group although without significance. The reason for diastolic BP reduction in the control group might be explained by the self-awareness of a high salt diet and involuntarily reduced salt in their diet, in that, the control group consumed only 2400 mmoL of salt daily.
Sodium intake can fluctuate considerably daily, and this study measured 24-h urinary sodium excretion to reflect sodium intake. However, inherent errors exist in all these methods, including urinary sodium measurement, and the strengths and limitations of each method must be considered. The validity of 24-h sodium excretion as an accurate estimate of sodium intake for individuals with CKD has not yet been established. Large-scale studies have suggested that patients with CKD commonly excrete 150 to 200 mmol of sodium in their urine over 24 h. 42 The urinary sodium excretion in our study was comparable to this range (136.12 ± 73.62 mmol/L in the intervention group vs 138.20 ± 70.44 mmol/L in the control group at baseline). The intervention group, receiving a salt-restricted diet delivered directly to their homes (3 meals daily), exhibited a greater decrease in urinary sodium compared with the control group, although the difference was without significance. However, 1 limitation of the study is that in the intervention group, patients may have had additional dietary sources contributing to additional salt intake, which could have diminished the effect of salt restriction. The control group also showed reduced urinary sodium excretion, possibly due to increased self-awareness while recording the dietary intake, leading to an unintentional reduction in salt intake.
Adherence to sodium restriction in clinical trials is important. Pimenta et al. used total food provision as a means for delivering the low sodium intervention and achieved a mean urinary sodium excretion of 46 ± 27 mmol daily (target 50 mmol/day), 43 indicating closer adherence than that achieved by Dietary Approaches to Stop Hypertension. 38 Even though our study provided total food provision, which was considered the best method to achieve adherence, 44 the patients still achieved the target urinary sodium excretion of around 100 mmoL/day, which could be from considerable variability in adherence among participants. We used 24-h collection to measure dietary sodium intake which should be more reliable than spot urinary sodium, or sodium to creatinine ratio (Na:Cr), 45 However, the validity of this measure to represent sodium intake is controversial, especially in CKD where tubular damage may render sodium excretion unreliable. 46 Therefore, we combined both urine collection and dietary recall to assess sodium intake and then compare between intervention and control groups. The urine sodium decreased more in the intervention group than in the control group in our study indicating effective low salt therapy according to the protocol. The reason for the significant reduction in urine volume and potassium level in the control group might have been due to the reduced renal function, resulting in decreased urinary potassium excretion. However, no significant difference was noted between intervention and control group regarding both parameters.
Our study possessed several strengths. For example, multiple nonconsecutive 24-h urine collections were used to prospectively measure sodium excretion at 3 time points, which is the gold standard for sodium intake assessment. 47 Another strength of this study is the inclusion of diverse patients, making the results more generalizable to patients with CKD. The intervention group received a highly controlled and standardized dietary intervention with precise control of sodium intake. Related studies have employed mostly dietary education, motivational reviewing and coaching but rarely has it been that well-prepared meals have been directly delivered to the participating patients.48 -50
The study also encountered limitations. First, sodium intake in the control group was assessed using self-completed FFQs and was therefore subject to misreporting and recall bias. Second, different CKD stages may impact urinary sodium excretion. Therefore, evaluating the dietary salt intake as a reference value is necessary. Third, the patients were assessed for only 3 months, so we could not conclude whether dietary sodium restriction could slow the progression of kidney disease in the long term. Consecutively, a longer study period is warranted to monitor definitive outcomes.
In conclusion, our findings revealed that dietary reduction in sodium induced clinically relevant reductions in BP, especially systolic BP, among patients with CKD. A low salt diet reduced eGFR decline, although no effect on proteinuria was demonstrated, and no significant differences in other metabolic parameters were found. A short term low salt diet resulted in better control of BP and preservation of eGFR. This could offer new insights into dietary interventions for kidney disease management. The research in this area is not yet conclusive especially among patients with CKD. Future research with a larger sample size and longer follow up is warranted. Using a single 24-h urinary sodium excretion to represent intake over a dietary intervention can greatly underestimate the efficacy of sodium reduction and prove impractical. Another method such as spot urinary sodium samples may lower participant burden but needs to be ascertained regard validity. The present study adds novel and valuable information regarding the benefits of sodium-restriction among patient with CKD.
Supplemental Material
sj-docx-1-jpc-10.1177_21501319241297766 – Supplemental material for Effect of a Low Salt Diet on the Progression of Chronic Kidney Disease: A Prospective, Open-Label, Randomized Controlled Trial
Supplemental material, sj-docx-1-jpc-10.1177_21501319241297766 for Effect of a Low Salt Diet on the Progression of Chronic Kidney Disease: A Prospective, Open-Label, Randomized Controlled Trial by Thananda Trakarnvanich, Worawon Chailimpamontree, Surasak Kantachuvesiri, Sirirat Anutrakulchai, Basmon Manomaipiboon, Tanun Ngamvitchukorn, Swangjit Suraamornkul, Thanphisit Trakarnvanich and Sathit Kurathong in Journal of Primary Care & Community Health
Footnotes
Acknowledgements
The authors thank Mr. Anucha Kamsom and Ms. Worachanee Imjaijit for performing the statistical analyses. The authors thank Ms. Khemika Rojtangkom, Ms. Siwaporn Rungrojthanakit, Mr. Peerawit Thinpangnga, and Ms. Monthathip Srisoontorn for preparing the dietary data and for performing the institutional program calculations. The authors extend their gratitude to Ms. Patthanant Srimuang, a nutritionist, for preparing the dietary interventions.
Author Contributions
T.T., W.C., and S.K. designed the study and devised the research plan. S.A., B.M., T.N., S.S., T.T., and S.K. conducted the statistical analysis, research, and data interpretation; drafted the manuscript and ensured data integrity and accuracy of the analysis. T.T., W.C., and S.K. contributed to the discussion and reviewed the manuscript. T.T. and S.A. wrote/edited the original draft and reviewed the manuscript. The final manuscript has been reviewed and approved by all authors.
Declaration of Conflicting Interests
The author(s) declared no potential conflicts of interest with respect to the research, authorship, and/or publication of this article.
Funding
The author(s) disclosed receipt of the following financial support for the research, authorship, and/or publication of this article: We are grateful for the financial support from the Fundamental Fund of Thailand Science Research and Innovation (TSRI) [grant number: 180301/2566].
Supplemental Material
Supplemental material for this article is available online.
References
Supplementary Material
Please find the following supplemental material available below.
For Open Access articles published under a Creative Commons License, all supplemental material carries the same license as the article it is associated with.
For non-Open Access articles published, all supplemental material carries a non-exclusive license, and permission requests for re-use of supplemental material or any part of supplemental material shall be sent directly to the copyright owner as specified in the copyright notice associated with the article.