
Abstract
Background:
Patients’ satisfaction with their treatment directly impacts the control of their diabetes. Quality of life is crucial for patients with diabetes mellitus to maintain long-term health and minimize complications. The current study aimed to evaluate the impact of diabetes education on quality of life (QoL) and treatment satisfaction of patients with type 2 diabetes mellitus.
Methods:
The current study was a randomized controlled trial. Patients with type 2 diabetes who were attending the diabetes clinic for 1 year were recruited. The overall sample in this study was 364 participants; 182 controls 182 cases. The interventional and control group participants were assigned randomly by simple random sampling technique. Controls were managed per usual care while cases were managed per usual care plus education done by the researcher. Pre-structured standardized questionnaires were used to collect the data. Data were processed and analyzed by using SPSS; version 28.
Results:
More than three-fourth of the participants; 76.4% were females. The average (±SD) age of the cases was 54.5 (±10) years, while was 56 (±9.8) years for controls. The overall median (IQR) years of DM diagnosis for all participants was 8 (4-14) years. The results showed a statistically significant difference between the mean satisfaction score from baseline to 12 months in the cases compared the controls (P < .001). Furthermore, there are statistically insignificant differences between the changes of mean overall QoL score from baseline to 12 months among the 2 groups.
Conclusion:
The education provided improved self-reported treatment-satisfaction among individuals with diabetes .A statistically insignificant differences in QoL between the 2 groups compared to baseline have been shown at the study end.
The trial registration number is PACTR202311766174946 which was registered by pan African clinical trials registry, https://pactr.samrc.ac.za/TrialDisplay.aspx?TrialID=26928.
Keywords
Introduction
Diabetes mellitus (DM) is huge health burden across the world due to different complications like retinopathy, cardiovascular diseases, and nephropathy. DM is a multifactorial disease, it depends on the individual’s genetic predisposition and lifestyle factors such as alcohol consumption, cigarette smoking, and sedentary lifestyle.1,2 Patients’ satisfaction with their treatment directly impacts the control of their disease. For example, in the Netherlands more than half of the individuals with diabetes were satisfied with their treatment. However, they found that individuals using insulin therapy, resulted in high HbA1c readings, and those of young ages were less satisfied. 3 Furthermore, other study showed low satisfaction with treatment was reported among individuals on insulin therapy, low educational level, and those who suffer from diabetes-related complications. 4 Both studies supported the importance of identifying factors associated with patients’ satisfaction with their treatment in achieving the therapeutic goals.3,4 Satisfaction with treatment will not always be associated with good glycemic control. 5 The fixed-dose use of combination therapies increases treatment adherence and satisfaction. 6 Hence, most individuals with diabetes, especially with type 2 diabetes (T2DM) on oral anti-diabetic medications, may not achieve their glycemic target levels, despite their treatment satisfaction. This may be associated with tolerability of signs and symptoms of hypoglycemia, constipation/diarrhea, and headaches. These signs and symptoms could be improved by optimizing the oral anti-diabetic medications as in combination therapies in a fixed-dose form compared to loose-pill combination therapies.5,7 In individuals living with type 1 diabetes, a long-acting analogue glargine was associated with high level of treatment satisfaction than those individuals on human basal insulin (NPH). 8 Importantly, individuals who were using continuous subcutaneous insulin infusion (CSII) were more satisfied than those on multiple daily injections (MDI), with no difference regarding glycemic control, 9 while inhaled insulin resulted in more satisfaction among women with gestational diabetes.10,11
The concept of “Quality of Life” is crucial for individuals living with diabetes and their health care providers. Quality of life is considered a significant predictor of an individual’s capacity to manage his/her disease and maintain long-term health by avoiding or minimizing complications. For instance, several factors associated with better QoL, including good financial status, male gender, good clinical status manifested by good control, and the absence of diabetes complications. 12 The presence of neuropathy and nephropathy appeared to decrease QoL.13,14 Male gender and lowered mood were considered risk factors for worse QoL among T2DM individuals.15,16 Low QoL was shown in Vietnamese in association with cardiac illnesses, diabetic retinopathy, and neuropathy. Health related quality of life (HRQoL) was moderately low, especially in social and mental health domains. 17 However, a systemic review concluded that macro-vascular and micro-vascular complications and the disease itself negatively affect individuals’ HRQoL in the Nordic countries. 18
Psychosocial factors presented in self-efficacy, self-management, emotional distress, and perceived social support can impact HRQoL in individuals with diabetes. These factors were collectively a good predictor of HRQoL, with emotional distress and self-efficacy as independent predictors. However, the previous study stated that generally, the HRQoL of individuals living with T2DM is better than that of T1DM. 19 Several studies have found that factors such as age, marital status, gender, monthly income, educational level, occupation, religion, diabetes knowledge, self-efficacy, diabetes-related complications, diabetes duration, insulin treatment, family support, diabetes distress, and metabolic factors such as HbA1c, hyperlipidemia, and BMI are considered predictors of HRQoL among adults with Type 2 diabetes mellitus.20 -24 Other studies have found that physical exercise also has a direct positive impact on HRQoL.23 -25 In addition, self-care behaviors, including healthy eating, medication adherence, frequent glucose checks, problem-solving, coping strategies, and risk reduction, have been identified as positive predictors of HRQoL. 26
Importantly, focusing on psychological and educational support may minimize the negative effect of insulin therapy on QoL. 27 Additionally, the mobility and sexual life of individuals with diabetes are affected with increasing age. 28
HRQoL was shown to be low among refugees living with diabetes compared to individuals living without diabetes. The physical and psychological domains were the most affected. 29 These findings came in line with another longitudinal study, in which a considerable portion of individuals with diabetes were found to suffer from symptoms of depression and anxiety and hence lowered HRQoL. 30 Depression is also more common with diabetes and also lead to low QoL. 31
It’s important to note that psychological problems and lowering HRQoL involve a reciprocal relationship; developing psychological symptoms reduces HRQoL. Therefore, lowering HRQoL acts to make patients attain psychological issues. Many studies have emphasized the importance of psychosocial care and regular screening.30,31 Therefore, HRQoL’s level improvement among individuals with diabetes is crucial. 30 Therefore, it is reasonable to suggest that QoL measurement should become a routine part of the clinical management of individuals living with diabetes. 32 Some studies relate each patient’s satisfaction with their therapy and diabetes medication adherence to their QoL. For instance, despite the problem of “therapeutic inertia” among physician which can hinder the achievement of therapeutic plan goals and delaying the addition of insulin therapy, the study showed good overall treatment satisfaction. 33 Furthermore, in 2016, a study in Indonesia found a positive correlation between patients’ adherence and QoL, 34 Our study represents the first clinical trial in Sudan to evaluate the impact of diabetes education on quality of life and treatment satisfaction of individuals with type 2 diabetes mellitus. In the context of diabetes education, our study represents pioneering work for clinical pharmacists working in Sudan, particularly in terms of educating individuals with type 2 diabetes, given the scarcity of clinical research in this field. Additionally, this study addresses the unique cultural, economic, and healthcare challenges in Sudan, as most studies have been conducted in other developing countries. Importantly, this study specifically evaluates the clinical pharmacist’s influence in diabetes management through a double-blind, randomized controlled trial, providing robust evidence of the effectiveness of the intervention, especially in areas where the clinical pharmacist’s role in diabetes management continues to grow. Furthermore, this study’s dual focus on treatment satisfaction and quality of life offers a comprehensive understanding of how pharmacist-led education impacts various facets of patient well-being. This holistic approach may yield a deeper understanding than studies that focus on a single outcome. The study is unique as it helps identify specific barriers to diabetes education in low-resource settings like Sudan and explores how diabetes education can be adapted to different circumstances, particularly in situations where there is a severe shortage of diabetes specialists in low-resource countries globally.
Materials and Methods
Study Setting
The current study was a randomized, double-blind, controlled trial with 1:1 allocation. The trial registration number is PACTR202311766174946 which was registered by pan African clinical trials registry. The study was done at a diabetes clinic located at Omdurman Military Hospital (OMH), Khartoum, Sudan. Individuals with T2DM attending the diabetes clinic at OMH over 12 months from January 2021 to January 2022 were selected.
Inclusion and Exclusion Criteria
Patients with type 2 diabetes mellitus who were aged 18 to 75 years (adults and older adults) and attending the diabetes clinic were included in the study. Any pregnant patients with diabetes, patients currently using medications (like diabetogenic immunosuppressants or antidepressants), that may affect blood glucose levels at the time of the study and any patients who were unable to communicate were excluded from the study
Samples and Sampling Method
The total sample size was 364, based on the equation used. 35 The interventional and control group participants were assigned randomly by simple random sampling technique. The control group were managed per usual care by their physicians. Outside the intervention, both groups were treated equally. Patients in the interventional group were managed by usual care plus education done by the researcher (Figure 1)

Flow chart illustrates the selection and the number of participants throughout the study period.
Collection of Data
Pre-structured standardized questionnaire were used to assess treatment satisfaction and QoL for the controls and intervention groups. The questionnaires consisted of 4 sections; section 1 included the socio-demographic data (including phone numbers, gender, age, marital status, residence, and educational level) section 2 included the medication history of the participants section 3 assessed the patient treatment satisfaction while section 4 assessed the patients QoL. Data were collected through direct interviews with patients and telephone calls.
Methods of Calculating Scores of Treatment Satisfaction and Patients’ QoL
Treatment satisfaction score
The treatment satisfaction section consisted of 8 questions with Likert scale containing 7 points that were ranged from 0 to 6, with 0 indicating worst satisfaction and 6 indicating the best satisfaction. The score was done for 6 questions, while the other 2 questions that addressed the perceived burden of hypoglycemia and hyperglycemia were scored independently. Hence treatment satisfaction scores were ranged from 0 to 36 and the higher scores indicates better satisfaction. The total score of the other 2 questions, which addressed the perceived burden of hypoglycemia and hyperglycemia, ranged from 0 to 12, with 0 indicating the most perceived burden of hypoglycemia and hyperglycemia and 12 indicating low perception of the burden of hypoglycemia and hyperglycemia.36,37
QoL score
We used the short-form health survey (SF-12) scale of QoL. It consisted of 12 questions with different responses. The overall QoL score ranged from 12 to 47, with the lower score indicating the worst QoL while higher scores indicating better QoL. The QoL scale was further divided into subscales physical health components (PCS), which measure physical HRQoL and mental health components (MCS) which measure mental HRQoL. The total score of Physical health components was 20, and it was obtained by summation of the scores of items (1, 2, 3, 4, 5, and 8) of SF-12 short. The total score of mental health components was 27, and it was obtained by summation of the scores of items (6, 7, 9, 10, 11, and 12) of SF-12. 38 we used the Arabic version of the questionnaire. 39
Primary Outcome Measures
The primary outcomes was the improvement or deterioration in quality of life and treatment satisfaction scores among the interventional and control groups at the study end when compared to baseline.
Blinding
Information was not withheld from the investigators but the trial participants (patients) and the physicians. Individuals in the interventional group are told they are going to be part of a study on diabetes education, but they are not told if they are in the control group or if a clinical pharmacist will be educating them. This ensures that their responses are not influenced by their awareness of the type of intervention. To further prevent variations that could alert patients to their group assignment, the diabetes education sessions for the intervention group may also be standardized in terms of content and delivery.
Without knowing the patients’ group assignments, physicians treated all of them with the standard of care that they usually provided. The clinical pharmacists conducting the education are different from researchers who assess the outcomes like patients’ quality of life and treatment satisfaction.
Intervention
The selection of the study participants, baseline information including filling of the questionnaires and intervention were done in the first 5 months of the study period. Intervention was done through direct counseling during clinical pharmacists’ visits and sending 12 educational videos. The clinical pharmacist visits were scheduled monthly throughout the first 5 months. The initial visits took about 15 to 20 min. The educational videos covered all information about diabetes mellitus in general, medications’ use, lifestyle changes, and self-care activities. Education were scheduled more frequently during the early months of the interventional period to ensure patient engagement and provide enough opportunities and time to address all patients’ goals and concerns. The questionnaires were filled at baseline and at the end of the study in the 12th month.
Data Analysis
We analyzed data by using the Statistical Package for the Social Sciences; SPSS version 28. Descriptive and inferential statistics were done in this study. An independent-sample T-test was used to compare the means of the continuous variables among categorical groups). Paired sample T-test was performed to determine any significant difference between the outcome variables at 2 points.
Ethical Approval
The ethical approval was obtained from Omdurman Islamic University (OIU/FPGS-Jan-2020) and Omdurman Military Hospital (GDMS/April-2021). Voluntary participation from the selected participants was taken. Written informed consent was obtained from the participants before being recruited into the study after explaining the main aim of the study. The facts and basis of the study, risks and benefits anticipated, the confidentiality and voluntary nature of the study were demonstrated to the participants by the principal investigator.
Results
Baseline Information
Of 364 participants, females were represented 76.4%). The average age of the experimental group was 54.5 (±10) years and it was 56 (±9.8) years for the controls. The median (IQR) duration of DM per years for the participants was 8 (4-14) years.78% of the experimental group were on metformin, while 81.3% of the controls were taking it. Hypertension was the major associated co-morbidity among the 2 groups. Calcium channel blockers (CCBs) were the main antihypertensive medications taken by both groups (Table 1).
Baseline and Clinical Data of the Studied Population (n = 364).

Abbreviation: SD, standard deviation.
Treatments Satisfaction Among the Participants at Baseline
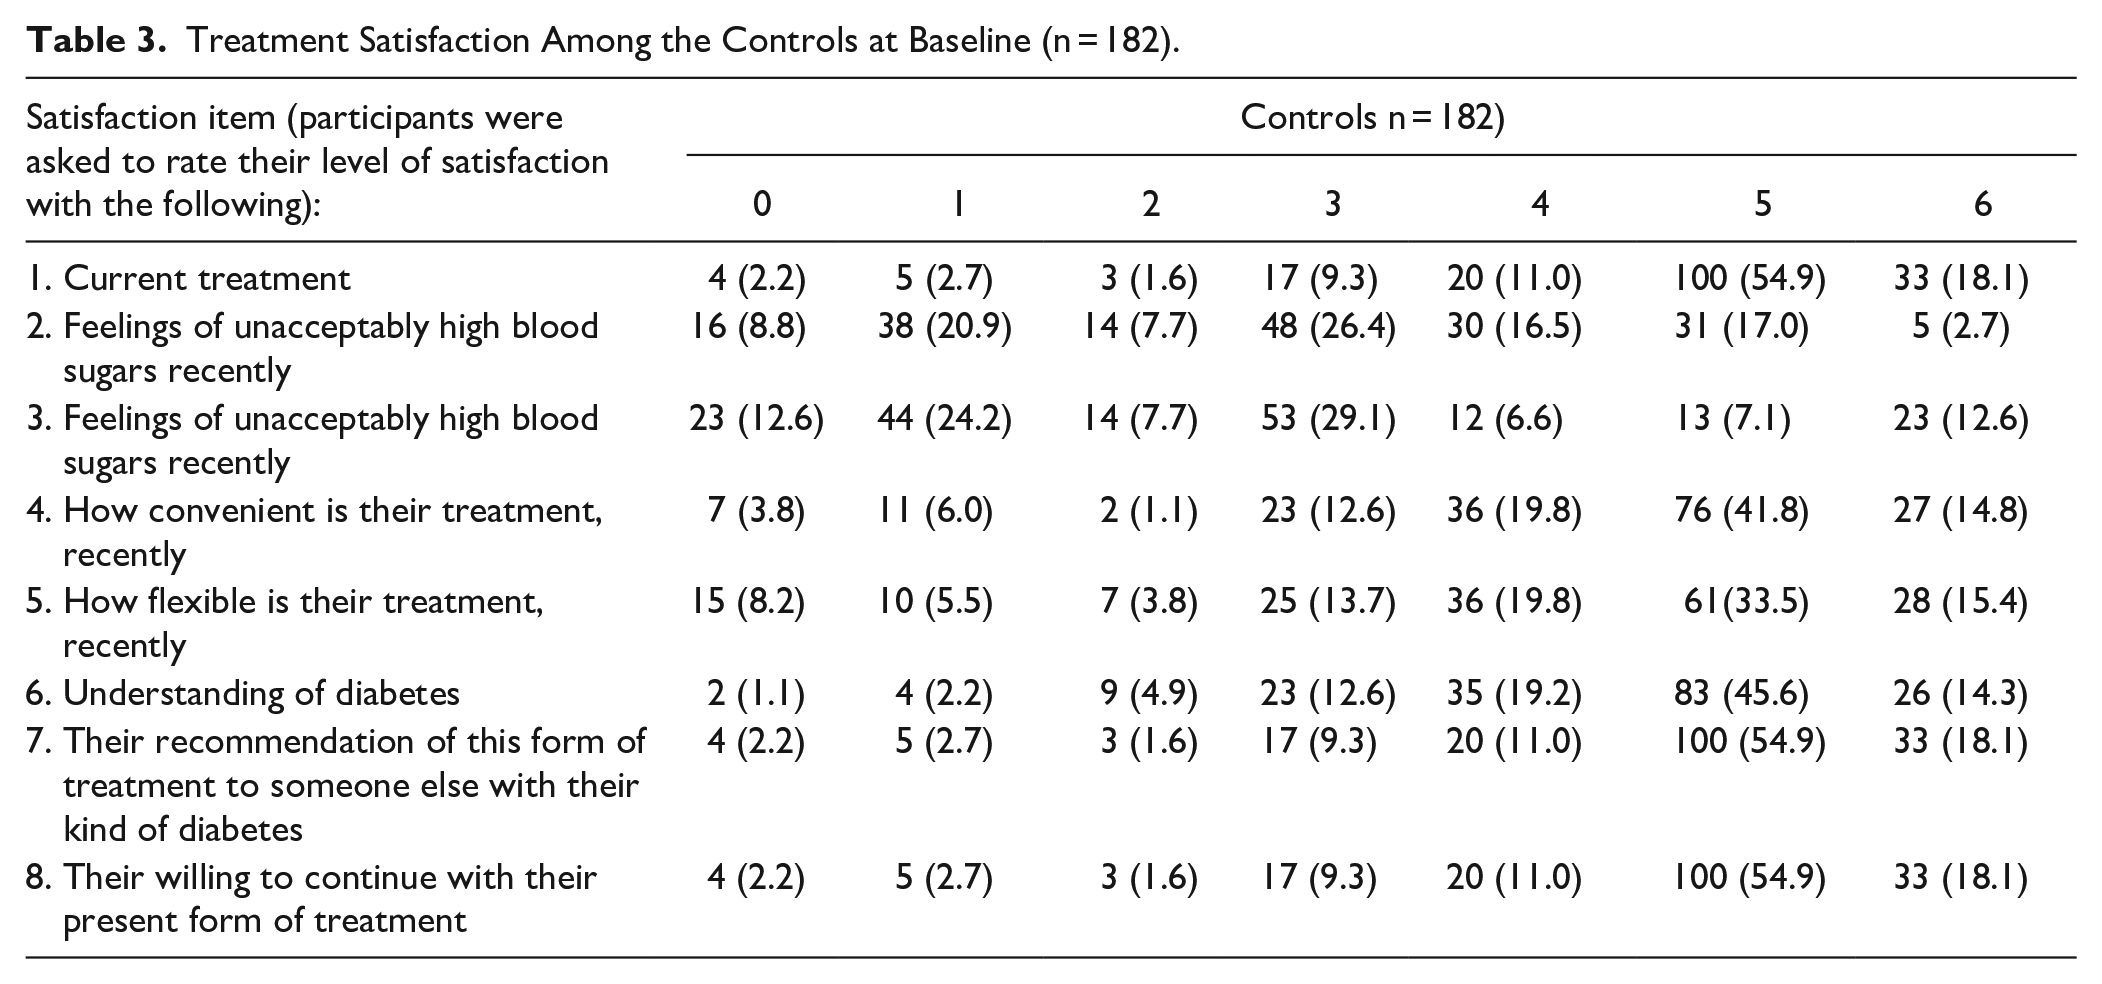
About two-thirds (67.6%, n = 123) of the experimental group and 73% (n = 133) of the controls were satisfied with their current treatment. The level of satisfaction with current treatment and understanding of diabetes mellitus was higher in the controls when compared to the experimental group. In addition, 9.3% (n = 17) of the experimental group and 8.8% (n = 16) of the controls did not feel that their blood sugars have been unacceptably high recently. The median satisfaction score in this study was 27 (IQR = 24-30; Tables 2 and 3).
Treatment Satisfaction Among the Experimental Group at Baseline (n = 182).

Treatment Satisfaction Among the Controls at Baseline (n = 182).
Treatments Satisfaction Among the Participants at 12 Months Period
A majority (72.1%) of the interventional group were satisfied with their current treatment, while about two-thirds (67.6 %) were satisfied with their understanding of diabetes mellitus. Overall, the levels of satisfaction with current treatment and understanding of diabetes mellitus were higher in the experimental group when compared to the controls. Only 16.8% (n = 30) of the experimental group and 8.5% (n = 15) of the controls did not feel that their blood sugars have been unacceptably high recently (Tables 2 and 3).
Quality of Life of the Participants at Baseline
Approximately 38.5% of the experimental group reported that their health status is very good compared to 39.5% of the controls. About 64.8% and 67.6% of the experimental group said their health status is not limited by performing moderate physical activities. About 50.8% of the experimental group and control reported that pain did not interfere with their normal work in the past 4 weeks. Generally, physical health and emotional problems did not affect more than 64% of the experimental group and controls. About 46.7% and 44.5% of the experimental group and controls reported that during the past 4 weeks, most of the time, they felt peaceful and calm, respectively. About 35.9% and 37.9% of them, most of the time, felt that they had a lot of energy, respectively. This study’s mean the overall quality of life score was 28.5 (±3.23), with min-max values (18-37). The mean physical component of the QoL score was 12.3 (±1.8), with min-max values being (7-17), while the mean of the physical component of the QoL score was 16.1 (±2.8), with min-max values of 6 to 24 (Table 4).
Comparisons of Health-related QoL Between the Study Groups at Baseline (n = 364).

Quality of Life of the Participants at 12 Months Period
At the end of this study, more than half (52%, n = 93) of the experimental group reported that their health was very good compared with 31.6 % (n = 56) of the controls. Abour 55.9% (n = 100) and 49.2% (n = 87) of the experimental group and controls reported that their health was not limited by performing moderate physical activities. Generally, physical activity and emotional feelings were not affected in more than 70% of the experimental group and more than 60% of the controls. About 45.3% and 44.6% of the experimental group and controls reported that they felt peaceful and calm during the past 4 weeks most of the time, respectively. About one-third of experimental group and controls reported that most of the time, they felt that they had a lot of energy, respectively (Table 4).
HbA1c Level With Treatment Satisfaction and QoL Comparison in the Experimental Group and Controls at 2 Different Times
An-Independent sample T test results revealed that in controls, the average satisfaction score was 26.4 (±6) at baseline and it was 26(±5.7) at the study end. In the experimental group, the average treatment satisfaction score was 26.1 (±5.8) at baseline and it was 27.1(±4.5) at the study end and there was a statistically significant difference between the change of average satisfaction score from baseline to 12 months in the experimental group compared the controls (P < .001). A meaningful increase in treatment satisfaction could enhance patients’ commitment to their diabetes management plan, potentially leading to better health outcomes. Increased satisfaction could indirectly or directly contribute to fewer complications if it leads to better management of diabetes. However, there are statistically insignificant differences between the change of average of overall QoL score from baseline to 12 months between the 2 groups (P = .157; Table 5).
Comparison of Treatment Satisfaction and Health Related QoL’ Scores and HbA1c in Both Groups at Baseline and 12 months Follow Up.
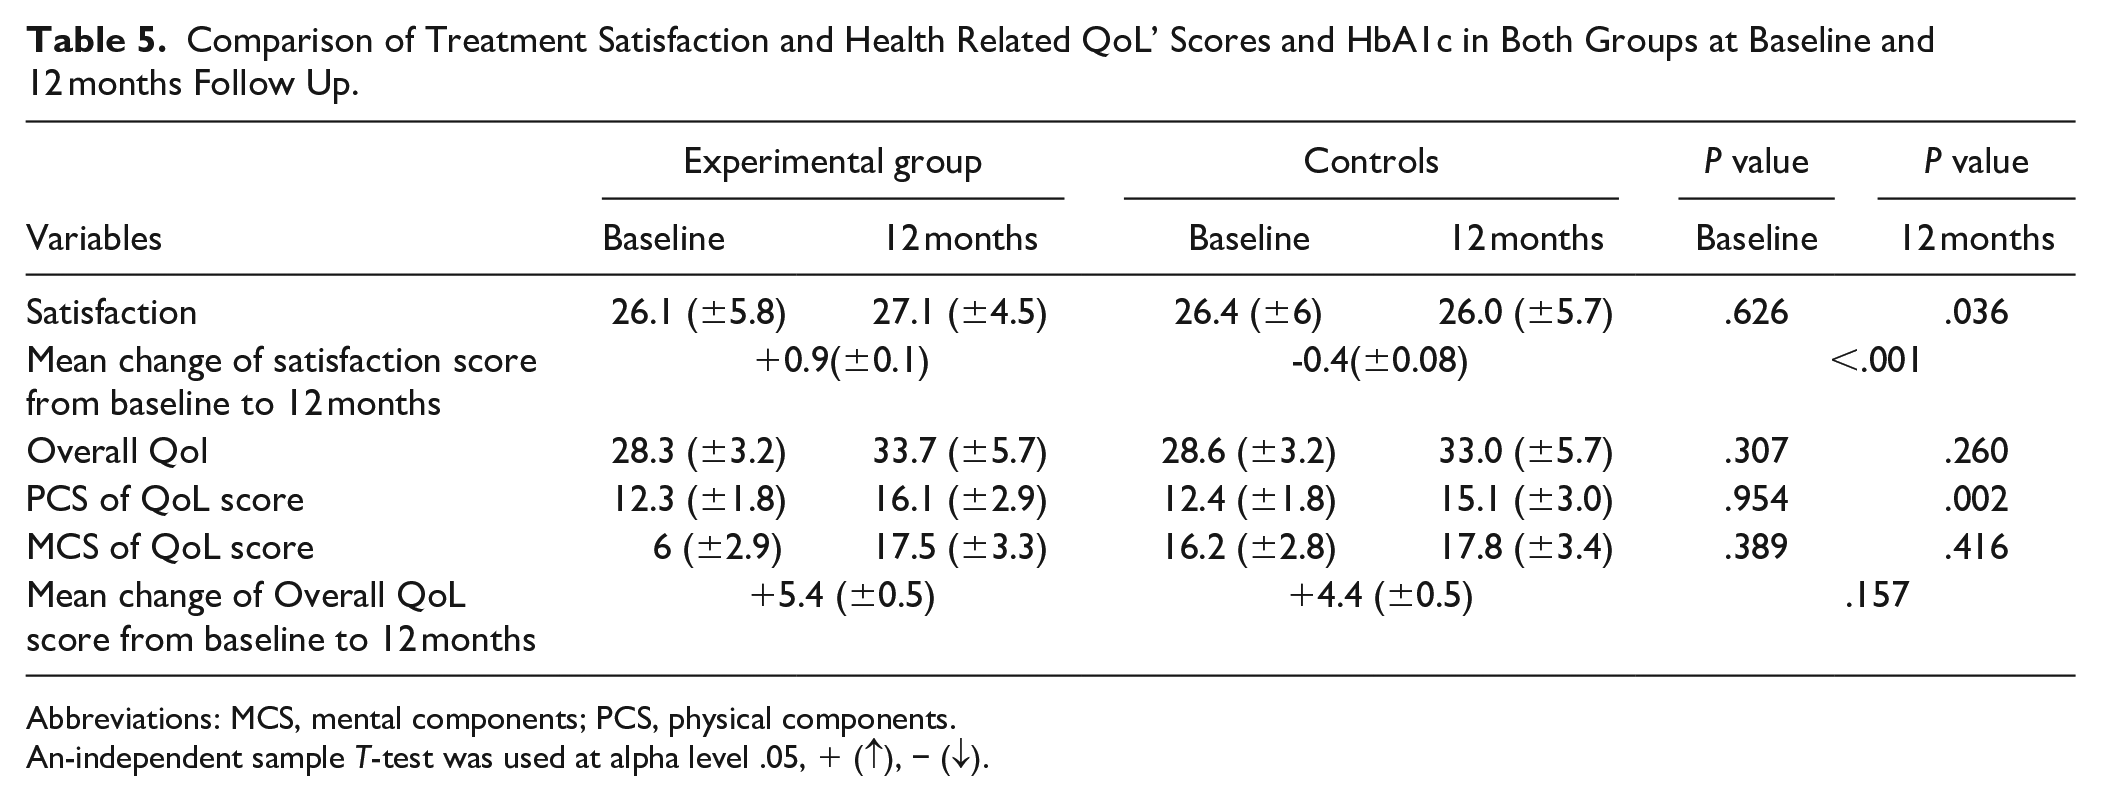
Abbreviations: MCS, mental components; PCS, physical components.
An-independent sample T-test was used at alpha level .05, + (↑), − (↓).
Discussion
This study evaluated the impact of Diabetes Education on the quality of life and treatment satisfaction of patients living with type II Diabetes Mellitus at Omdurman Military Hospital. Pharmacists can substantially impact diabetes care. They can screen patients who have a high risk for diabetes, such as those who have a strong family history of DM, set and monitor the goals of treatment, and assess the health status of patients. Worth pointing out that a family history of DM is a strong, independent and easily considered risk factor for T2DM. More than two-thirds of the participants had a family history of diabetes (69.2% of experimental group and 66.5% of controls); such result is consistent with Bukhsh et al 40 study. They found that 59.2% of the participants had a family history of DM. However, another study in Sudan showed different findings as 47% of the individuals living with diabetes respondents, had a family history of T2DM. 41 Similarly, Al Mazroui et al 42 showed that 44.2% and 37.5% of the experimental group and controls had a family history of diabetes, respectively. 42 Patients’ satisfaction with their treatment directly impacts the control of their disease. The current study showed no statistically significant difference between the average of overall treatment satisfaction score at baseline between the experimental group and controls, but it showed a significant difference between them at the study end.
Moreover, there was no correlation between treatment satisfactions among the experimental group at baseline. At the same time, there was a positive correlation at the study end, indicating that a higher treatment satisfaction score was shown among the experimental group than in the controls, which significantly impacted patients’ education on treatment satisfaction. Rothman et al 43 found that the change in the mean satisfaction score among the experimental group was 4 folds than that of controls. This result is similar to Sriram et al, 44 they found a statistically significant difference between the intervention group and controls at the study end (P = .01). Hence, these findings are suggested to reflect the education provided by the clinical pharmacist. Quality of life is a predictor of and well-being. Many individuals with diabetes get stressed and do less self-care management as diabetes can negatively affect the patients’ QoL.15,16 Depression is a significant predictor of hospitalization, death as well as physical and metabolic factors like the presence of complications, increased BMI and HbAlc level.
In the current study, the average QoL score was increased by 5.4 at the study end for the interventional group compared to baseline. For the controls, it was increased by 4.4 (P = .157). Additionally, there was no correlation between QoL among the interventional and control group at baseline (P = .307) and at the study end (P = .260). This result indicates no significant difference between the mean values nor the mean change of QoL score among the experimental group and controls at baseline or even at the study end. This result is dissimilar to the findings of other studies,44 -46 which showed a significant difference between the mean QoL from the baseline to the study end among the interventional group. However, there was no significant difference among the controls. From these findings, we can conclude that the educational sessions provided for the participants had no direct impact on their overall QoL. The timing in which the study was conducted; during the COVID-19 pandemic might be the main reason behind the non-significant improvement in QoL, which could directly impact the QoL of the general population and patients with diabetes.
Limitations of the Study
(i) The study was conducted in Khartoum, the capital of Sudan in one diabetes clinic. Further, larger randomized clinical trials involving individuals with type 2 diabetes from different regions of Sudan are needed before the conclusions of this study can be applied to the entire country.
(ii) Our study only assessed the short-term outcomes (12 months); hence, it could not determine whether these beneficial effects would be consistent during a more extended study period.
(iii) The study’s estimation of the quality of life was done according to the patients’ self-reporting; this might lead to overestimating the parameters. Using observational methods and more than one approach to self-reporting will be more effective. However, we have tried to overcome this effect by using standardized self-reporting scales measures that can achieve the objectives adequately.
(iv) The impact of COVID-19 added extra work for the team working on this trial, as regular follow-ups via phone were required to ensure consistency in medication adherence.
Strengths of the Study
The representative sample size, and 1 year follow-up duration of our study have made it one of the most unique and novel studies. Moreover, In terms of dropouts, we experienced a very low dropout rate as it did not overcome 2% (8 participants; 5 controls and 3 cases) of the total population.
Conclusion
The education provided improved self-reported treatment-satisfaction. At the study end, there were statistically insignificant differences in QoL between the 2 groups compared to baseline. This study could pave the way for future replication through larger randomized clinical trials with recruitment from different regions of Sudan. Additionally, future studies assessing the impact of counselling programs delivered by well-practiced and trained clinical pharmacists could significantly improve patients’ health by increasing their knowledge about diabetes. These programs may also directly enhance patients’ attitudes and practices. Such programs could be valuable tools for making decisions regarding disease monitoring and for enhancing community-cantered management of diabetes. More studies are required to evaluate the impact of clinical pharmacy education on quality of life and establish its cost-effectiveness in diabetes service as stakeholders seek cost-effective diabetes management strategies.
Footnotes
Acknowledgements
Nil.
Declaration of Conflicting Interests
The author(s) declared no potential conflicts of interest with respect to the research, authorship, and/or publication of this article.
Funding
The author(s) received no financial support for the research, authorship, and/or publication of this article.
Data Availability
The data of this results will be available upon request.