
Abstract
Introduction/Objectives:
Patients living with chronic diseases require more medical attention, including more visits to primary care. However, primary care providers are overburdened, and this specialty is attracting fewer new providers than before. Clinical pharmacists can augment these efforts by improving disease state control. In this cohort study, we aimed to demonstrate a retail pharmacy hired and trained clinical pharmacist within a value-based primary care clinic network can improve hypertension (HTN) and type 2 diabetes mellitus (T2DM) control.
Methods:
In this cohort study, a pharmacist, enabled by a collaborative drug therapy management agreement, prescribed and titrated therapies for HTN and T2DM. Primary outcomes were pre- to post-index changes in hemoglobinA1c, systolic, and diastolic blood pressure (BP) measures.
Results:
The HTN cohort consisted of 43 patients and the T2DM cohort consisted of 125 patients. The difference-in-differences (β) in the HTN group was −10.2 mmHg (P < .01) for systolic BP and −2.0 mmHg (P = .42) for diastolic BP. The β in the T2DM group was −1.16% (P < .001).
Conclusions:
Statistically significant reductions in systolic BP and hemoglobinA1c were observed in the pharmacist-managed group compared with matched controls. These results demonstrate that pharmacist integration into a value based primary care clinic may improve measures of chronic disease associated with morbidity and mortality.
Keywords
Introduction
Chronic disease is common, costly, and complicated. The number of patients with chronic diseases has increased, with approximately one-third of patients worldwide living with >1 chronic disease. 1 Chronic diseases account for more than 90% of the $4.1 trillion in annual healthcare costs in the United States.2,3 Care for patients managing complex chronic diseases requires more medical attention, including more visits to primary care, multiple specialists, and a greater number of prescriptions. 4
Primary care providers (PCPs) have faced the brunt of this additional tidal wave of chronic disease. In an evidence-based review, the Veteran’s Administration determined that a panel size of 1200 was appropriate for a full-time physician. 5 However, even in 2012, the average US panel size was about 2300 patients. Estimates suggest that PCPs need to spend 21.7 h/day to provide recommended care for a panel of 2500 patients. 6 Research shows that utilization of PCPs is associated with decreased hospitalizations, greater patient satisfaction, and improved health equity. However, PCPs are tasked with increasing administrative demands, higher patient loads, and a greater number of comorbid conditions in patients than ever before, causing this specialty to attract fewer new providers than other specialties.7 -11 With population growth and aging, there is an expected shortage of around 86 000 physicians by 2036. 12
In the 1960s, Advanced practice providers (APPs), such as physician assistants and nurse practitioners, emerged to blunt physician shortages. These providers have been shown to increase patient access and provide similar quality of care in routine conditions.13,14 However, PCPs remain overburdened, with high rates of burnout and provider dissatisfaction, and many patients still lack access to primary care.15,16
In addition to navigating these challenges, providers and payers are shifting to a value-based care (VBC) model to lower costs and improve health outcomes. In VBC models, payment for services is in part determined by patient outcomes or total costs of care, whereas traditional fee-for-service models determine payment based on the number and types of services provided. This approach supports the delivery of evidence-based and preventive whole-person care. 17
Evidence has accumulated that clinical pharmacists can augment the efforts of PCPs, improving disease state control, medication optimization, and reducing emergency department (ED) visits and hospitalizations in certain disease states. However, these results have been inconsistent.18 -20 With increasing rates of cardiometabolic disease driving increases in mortality and morbidity, novel care models are necessary to increase access and ensure high-quality care is provided longitudinally.21 -23 Utilization of collaborative drug therapy management (CDTM) agreements between pharmacists and physicians offer an opportunity to improve patient access to care and clinical outcomes. Clinical pharmacists trained and supported by retail pharmacies, particularly pharmacies with a national footprint, are in a unique position to increase patient access to care by partnering with local primary care clinics around the country.
We aimed to impact the quality of chronic disease care delivery across an outpatient population within a VBC clinic. Specifically, we believe that by integrating a clinical pharmacist trained in chronic disease management and enabled by CDTM agreements, population health analytics, and chronic disease management algorithms, we can improve hemoglobin A1c (HbA1c) in patients with type 2 diabetes mellitus (T2DM) and systolic and diastolic blood pressure (BP) in patients with hypertension (HTN).
Methods
This cohort study was conducted for 12 months from December 1, 2022 to December 1, 2023. Clinical pharmacists, trained and supported by a retail pharmacy and healthcare organization, engaged in a VBC model. Under CDTM agreements, a clinical pharmacist was integrated into 4 of 58 outpatient clinical sites across a primary care network in Phoenix, Arizona. The clinical pharmacist was supported by a remote retail pharmacist team who developed chronic disease management algorithms based on clinical guidelines to support medication management decision-making. These clinical algorithms were reviewed and validated by physician leaders in the pharmacy organization.
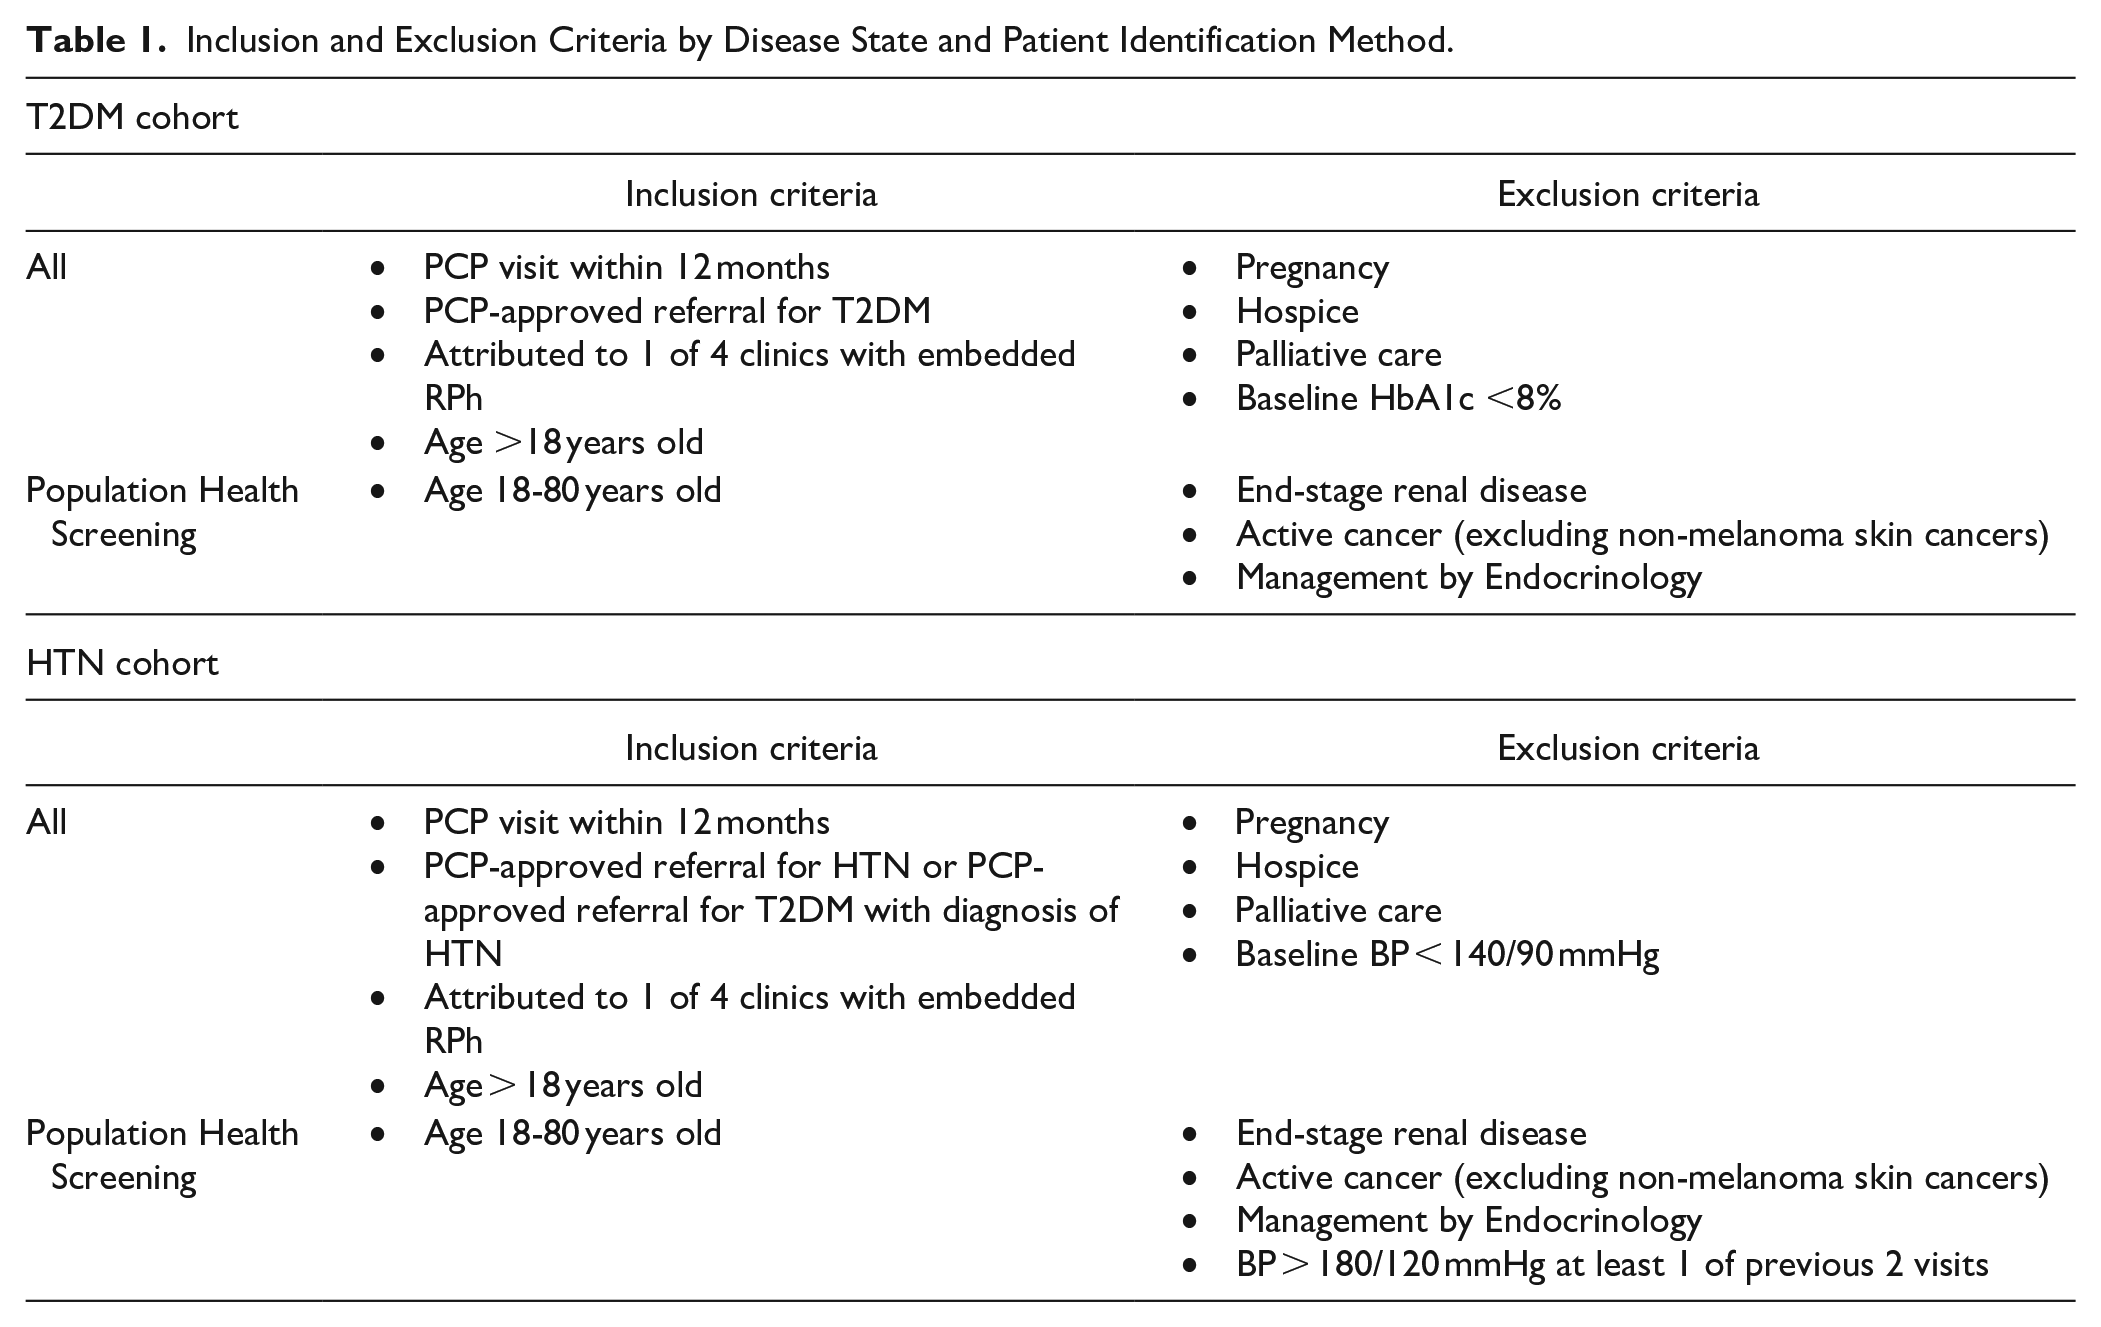
The PCPs referred patients to the clinical pharmacist for T2DM and/or HTN co-management. In addition, the clinical pharmacist, backed by a remote retail pharmacist team, identified additional eligible patients through population health screening. Primary care clinic leadership provided a report of patients from all 4 clinics with a diagnosis of diabetes and at least one of the following additional criteria: HbA1c 8.5% or greater, BP 140/90 mmHg or greater, or eligible for statin therapy. The remote retail pharmacist was granted EMR access and supported the clinical pharmacist by chart reviewing each patient using inclusion and exclusion criteria (Table 1). Each week, the remote pharmacist provided a list of patients eligible for T2DM and/or HTN co-management separated by PCP attribution. The clinical pharmacist, who established a trusting relationship with the PCPs, messaged them through the EMR to request T2DM and/or HTN referral for their attributed eligible patients. Upon receiving approval of the referral, the clinical pharmacist initiated care with the patient. If the PCP did not respond, care was not initiated. PCPs declined referrals for 3 out of 11 T2DM patients, 26 out of 175 HTN patients, and 5 out of 48 patients identified for both T2DM and HTN. PCPs were not required to provide justification for declined referrals.
Inclusion and Exclusion Criteria by Disease State and Patient Identification Method.
Patients enrolled in pharmacy services received medication education and management, quality gap closure, and adherence initiatives focused on improving measures of chronic disease control through in-person and telehealth visits. Pharmacist responsibilities included collecting and reviewing patient drug use histories; ordering and assessing routine drug therapy-related vitals and laboratory tests; initiating, monitoring, adjusting, and discontinuing drug therapy; and providing comprehensive disease state education to patients and caregivers. Due to the relationship with the retail pharmacy, the clinical pharmacist had access to the pharmacy database. The pharmacy database provided the unique ability to directly identify critical medication-related issues such as poor adherence based on claims history and high out-of-pocket medication costs for clinic patients using this organization as their preferred pharmacy. For clinic patients of alternative pharmacy organizations, the clinical pharmacist was able to collaborate with other retail pharmacists to obtain information needed to identify and resolve medication-related issues. The pharmacist documented all care delivered and communicated essential information through electronic medical record (EMR) messaging to the patient’s primary care provider.
Inclusion criteria for the intervention group included a PCP visit within the past 12 months and PCP approved-referral for pharmacist management. Exclusion criteria included pregnancy, hospice, and palliative care. The remainder of the inclusion and exclusion criteria differed by source of eligibility identification and chronic disease cohort (Table 1). Criteria were less stringent for patients referred directly via PCP to limit restrictions placed on providers during the referral process.
Control patients were selected from the pool of active adult patients within the Phoenix market health system, with recorded T2DM and/or HTN during the study timeframe. Members of the control cohort did not have an encounter with a clinical pharmacist during this period. Due to the impracticality of randomizing patients to the quality improvement program, we employed propensity score matching to create matched cohorts of patients in the exposure and control groups. 24 Propensity scores were calculated using logistic regression, with covariates including demographics, clinical attributes, and measures proximal to January 1, 2023. Additional variables are age, race/ethnicity, sex, preferred language, marital status, smoking status, the presence of major chronic diseases, and enrollment in VBC programs. Each patient in the exposure group was matched to 2 control patients with similar propensity scores utilizing a greedy nearest neighbor matching algorithm. This matching process was conducted independently for the T2DM and HTN cohorts. We calculated descriptive statistics for exposure and control patients and compared continuous and categorical variables accordingly.
The extracted dataset comprised demographic details, diagnosis, vital signs, clinical test outcomes, and variables related to health insurance coverage. Primary outcomes were pre- to post-index changes in HbA1c, systolic, and diastolic BP measures. We used linear mixed effects models that included covariates, indicators for time (pre- and post-index date,) group status (cases vs controls), and interaction between time and group (primary predictor). Random effects were added to adjust for data clustering within each pair of matched cases and controls and data clustering within each patient.
Baseline characteristics include age, sex, smoking status, race/ethnicity, preferred language, marital status, comorbidities, and enrollment in VBC programs within the past 1 year. Baseline characteristics also included HbA1c for the T2DM cohort and BP for the HTN cohort.
Selection bias was mitigated by recruiting patients both from population health efforts and from provider referrals. Information bias was limited by conducting the study over 1 year and only including those with follow-up data in our analyses.
The quantitative data was derived from the EMR-claims linked files. The integrated dataset is based on complete de-identified data from ambulatory care EMR linked with available pharmacy and medical claims data. Similar to other linked datasets of claims and EMR, 25 the measures from medical records are limited to structured information, such as sociodemographics, diagnoses, services, vital signs and biometrics, lab results, and prescriptions.26 -28
To assess the impact of the program on HbA1c and SBP/DBP levels, we utilized difference-in-differences (DID) analyses. 29 The DID design mitigates potential unobservable confounders, such as system-wide initiatives, assuming equal exposure and impact on the exposed and control groups. Only a subset of matched patients with both pre-index and post-index clinical measures were included in the DID analysis. We employed linear mixed effects models with indicators for time (post-index vs pre-index), patient group (exposure vs control), and their interaction within the analytical sample. The models also incorporated random effects to account for data clustering within each matched pair and individually within patients. DID analyses were performed separately for patients diagnosed with T2DM and HTN.
The Advarra Institutional Review Board approved the study’s protocol as Exempt. EMR data were systematically retrieved for patients categorized within both the exposure and control (usual care) cohorts. 30 As a quality improvement program, this project was not registered with clinicaltrials.gov.
STROBE reporting guidelines were utilized. 31
Results
There were over 90 000 and 140 000 patients with T2DM and/or HTN, respectively, within the outpatient setting. Out of 662 patients identified for possible pharmacist T2DM management, 391 were eligible, 205 were managed, 125 were included in the study cohort, and 87 had repeat data within the study window. Out of 612 patients identified for possible pharmacist HTN management, 111 were eligible, 83 were managed, 43 were included in the study cohort, and 42 had repeat data within the study window (Supplemental Figure S1).
The study included a total of 504 patients. There are 168 in the intervention group and 336 in the control group. For the final analysis with both pre-index and post-index data available, there were 129 in the intervention group and 122 in the control. Prior to matching, there were statistically significant differences between patients in the quality improvement program and other patients in the health system.
Study sample sizes for the T2DM and HTN cohorts were 375 and 129, respectively. Descriptive statistics for each of the matched cohorts are shown in Table 2. The exposure group in patients with T2DM (N = 125) has a mean age of 65.5 years (SD = 1.0) and includes 60 (48.0%) males and 65 (52.0%) females. The control group had 250 patients, with a mean age of 64.8 years (SD = 0.9), and a similar distribution of sex as the exposure group. Racial/ethnic composition shows 50.4% Non-Hispanic White in the exposure group, compared to 50.8% in the control group, with the remaining divided between other races and unknown. A majority of both groups are English speakers and married. VBC enrollment is 36.0% in the exposure group versus 36.8% in the control group. Only a small percentage (2%-7%) of both cohorts are classified as frail, while smoking status shows a majority (87%-93%) are former or never smokers. The exposure group has a mean A1c of 9.0% (SD = 0.2), with the control group having a higher mean HbA1c of 10.0% (SD = 1.0). Comorbidities are high in both groups, with a substantial majority (>75%) having 3 or more comorbidities. For patients with HTN, the exposure group has a slightly higher mean SBP of 145.5 mmHg (SD = 20.0) compared to the control group’s mean SBP of 141.8 mmHg (SD = 18.5). Various demographic and health-related characteristics for both the exposure and control groups in HTN patients are similar to the T2DM cohort. There was no significant difference between average follow-up time in the exposure and control groups in either the T2DM or HTN cohorts. For patients with T2DM, average follow-up time was 177 days (162, 192; P = .16) for the exposure group and 188 days (171, 205) for the control group. For patients with HTN, average follow-up time was 57 days (50, 64) for the exposure group and 51 days (42, 60; P = .08) for the control group.
Characteristics of Study Cohorts.

The results are shown in Table 3. Having at least 1 clinical pharmacist visit was associated with a significant reduction in HbA1c (β = −1.16%; 95% CI, (−1.69% to −0.62%; P < .001) among patients with T2DM; unadjusted results showed a −1.6% (−1.2%, −1.9%) reduction in HbA1c in the exposure group and a −0.3% (0, −0.7%) reduction in the control group. The clinical pharmacy model was also associated with a significant reduction in SBP (β = −10.2 mmHg; 95%CI, −17.7 to −2.7) mmHg; P < .01) among patients with HTN; unadjusted results showed a −16.6 mmHg (−11.6 and −21.4 mmHg) reduction in SBP in the exposure group and a −6.3 mmHg (−0.3 and −12.4 mmHg) reduction in the control group. We did not find a significant association between exposure and DBP among individuals with HTN (β = −2.0 mmHg; 95%CI, −6.7 to 2.8 mmHg; P = .42); unadjusted results showed a −5.4 mmHg (−2.1 and −8.7 mmHg) reduction in DBP in the exposure group and a −4 mmHg (−0.7 and −7.3 mmHg) reduction in the control group. There were no patient adverse events, provider complaints, or concerns regarding the program throughout the study period.
Association of Ambulatory Pharmacist Care with Change in HbA1c in Patients with Diabetes (N = 173) and Blood Pressure in Patients with Hypertension (N = 78).

Abbreviations: DBP, diastolic blood pressure; DID, difference-in-differences; HbA1c, hemoglobin A1c; SBP, systolic blood pressure.
The β coefficients were generated using difference-in-differences analysis for time (pre- vs post-index date), group (exposure vs control), and the interaction between time and group among the propensity score-matched samples with before and after observations.
Discussion
This study demonstrates significant improvements in HbA1c and BP when pharmacists are leveraged as extenders to provide high-quality care for at-risk individuals between provider appointments. Improvements in these markers of health also translate to significant improvements in future risk of atherosclerotic cardiovascular disease, including reduced risk of heart attack and stroke.32,33 These results support the implementation of clinical pharmacist chronic disease management programs to drive superior outcomes in VBC paradigms.
The impact clinical pharmacists have in the primary care setting is well documented. Studies suggest clinical pharmacists can augment the efforts of PCPs by improving disease state control, optimizing medications, and even reducing ED visits and hospitalizations in certain disease states. However, sparse data are available for clinical pharmacists hired in the retail pharmacy setting. Novel in this study is that patients co-managed by a retail pharmacy organization and a primary care network may reap the benefits from resources that both organizations offer. This has significant implications for the role of retail pharmacies and pharmacists, access to clinical care, and chronic disease management and should encourage further study and expansion of these programs.
DID analyses rely on the assumption that in the absence of the intervention, the outcome trends for the exposure and control groups would be parallel over time. This assumption was challenging to verify in this study and may not hold if external factors differentially affect the groups. The propensity score matching is contingent on having a comprehensive set of observable variables that influence both the group status and the outcome. If important covariates are unobserved or omitted, the resulting matches may be poor, leading to biased estimates. We were unable to assess how variations in access to clinical pharmacists affected the relationship between exposure and study outcomes. Furthermore, we conducted the propensity score matching using data points nearest to January 1, 2023 for computing efficiency, which may differ from those recorded on the index date. Because of the short follow-up, the adjusted analysis included a small subset of patients with clinical measures before and after the index date. Despite these limitations, our study contributes valuable insights into the effectiveness of pharmacist strategies in managing patients with T2DM and HTN within VBC settings. Based on the limited study window, many patients did not have both before and after values available within the study period, limiting the patients available for final analysis.
Though utilization of primary care providers is associated with decreased hospitalizations, greater patient satisfaction, and improved health equity, there are disparities in access to primary care services, with time and transportation among the most common challenges. 34 One way to bridge the gap in care, as well as markedly improve metrics of health care control, is to integrate clinical pharmacists into VBC clinics. While this has been done in prior studies, there may be enhanced value to having clinical pharmacists with direct connectivity to the dispensing retail pharmacy given the litany of obstacles that may lead to a patient never receiving an intended medication along with the data vacuum that exists between the clinic and dispensing pharmacy. Connecting these 2 entities more tightly via co-management of a shared pharmacist resource improves teamwork and reduces fragmentation within the system.
This study expands on the utility of pharmacist collaboration with regular care to improve metrics of chronic disease control in the cardiometabolic domain. The VBC paradigm is primed to benefit from improvements in chronic disease control by preventing disease progression and acute care utilization. This study demonstrates that integration of pharmacists in these care models can meaningfully improve disease control known to be associated with morbidity, mortality, and cost. It also encourages further deployment of retail pharmacists and integration with clinical care teams to improve measures of chronic disease.
Conclusions
Though the incidence of chronic disease is increasing, a shortage of PCPs and disparities in access present a challenge to meeting the needs of patients. Clinical pharmacists have shown success in providing care to patients with T2DM and HTN and can be expanded into new areas of chronic disease management to help fill this gap in care. Combining the resources of a retail pharmacy and primary care network with national footprints and advanced-trained pharmacists can increase patient access to care and provide a solution to the overburdened healthcare system. These results have encouraged further development of this model, with the goal of scaling and integrating retail pharmacists into direct patient care. Further study at a greater scale will be beneficial to validate these results.
Supplemental Material
sj-docx-1-jpc-10.1177_21501319241312041 – Supplemental material for Integrating Ambulatory Care Pharmacists Into Value-Based Primary Care: A Scalable Solution to Chronic Disease
Supplemental material, sj-docx-1-jpc-10.1177_21501319241312041 for Integrating Ambulatory Care Pharmacists Into Value-Based Primary Care: A Scalable Solution to Chronic Disease by Alexander J. Blood, Harry Saag, Adam Chesler, Dalia Ameripour, Max Gutierrez, Van Nguyen, Cassandra Richardson, Clive Fields, Jen Clair, Aaron Yao and Sashi Moodley in Journal of Primary Care & Community Health
Footnotes
Declaration of Conflicting Interests
The author(s) declared the following potential conflicts of interest with respect to the research, authorship, and/or publication of this article: Dr. Blood reports grant support from the NHLBI, Boehringer Ingelheim, Eli Lilly and Company, Novo Nordisk, General Electric Health, consulting fees from Alnylam Pharmaceuticals, Arsenal Capital Partners, Color Health, Corcept Therapeutics, Medscape, Milestone Therapeutics, Nference, Node.Health, Novo Nordisk, Walgreens Health, and Withings; equity holdings in Knownwell Health and Porter Health.
Funding
The author(s) disclosed receipt of the following financial support for the research, authorship, and/or publication of this article: This work was supported by Walgreens and Village Medical.
Ethical Approval and Informed Consent Statements
The Pearl Institutional Review Board waived the need for ethics approval and patient consent for the collection, analysis and publication of the data for this study according to FDA 21 CFR 56.104 and 45CFR46.104(b)(4): (4) Secondary Research Uses of Data or Specimens on 10/06/2022.
Data Availability Statement
De-identified data will be made available with IRB approval and upon reasonable request.
Supplemental Material
Supplemental material for this article is available online.
References
Supplementary Material
Please find the following supplemental material available below.
For Open Access articles published under a Creative Commons License, all supplemental material carries the same license as the article it is associated with.
For non-Open Access articles published, all supplemental material carries a non-exclusive license, and permission requests for re-use of supplemental material or any part of supplemental material shall be sent directly to the copyright owner as specified in the copyright notice associated with the article.