
Abstract
Introduction/Objectives:
Many health systems screen patients for social determinants of health and refer patients with social needs to community service organizations for assistance. However, few studies have examined how social determinants of health change over time in the same individuals.
Methods:
We examined patients screened by The MetroHealth System in Cleveland, Ohio for 11 social determinants of health, including food insecurity, financial strain, transportation, housing stability, utilities affordability, other housing problems, intimate partner violence, social connection, physical activity, daily stress, and digital connectivity. We determined changes in these social determinants among patients screened at baseline and again after 6 to 18 months of follow-up. We further examined correlates of changes in food insecurity, because it is a common need among our patients and leads to numerous referrals to community organizations for assistance.
Results:
A substantial majority of patients had no change in each social determinant. For example, among 18 038 patients screened twice for food insecurity, 13 913 (77.1%) did not screen positive for food insecurity at baseline and follow-up and 1726 (9.6%) screened positive for food insecurity at both times. A total of 1080 (6.0%) did not screen positive for food insecurity at baseline but screened positive at follow-up while 1319 (7.3%) screened positive for food insecurity at baseline but not at follow-up. Among patients screening positive for food insecurity at baseline, screening negative at follow-up was independently associated with being age ≥60 years (odds ratio [OR] = 1.46, 95% confidence interval [CI] = 1.02-2.10), not screening positive for financial strain (OR = 1.64, CI = 1.27-2.13), not screening positive for housing problems (OR = 1.65, CI = 1.28-2.13), and not screening positive for intimate partner violence (OR = 1.45, OR = 1.02-2.08). A longer duration between baseline and follow-up screening was also independently associated with not screening positive for food insecurity at follow-up. Being referred for food assistance was not associated with absence of food insecurity at follow-up (OR = 0.71, CI = 0.47-1.08).
Conclusions:
Most patients report no change in specific social determinants of health over 6 to 18 months. Examining changes may identify subgroups at greatest risk for persistence of adverse determinants and help to evaluate the impact of assistance efforts.
Keywords
Introduction
Because social determinants of health influence healthcare cost, quality, and outcomes, many health systems screen patients for social determinants and refer patients with social needs to community service organizations for assistance.1,2 Examples of topics addressed in screening include food insecurity, financial strain, housing problems, and intimate partner violence. However, few studies have examined how social determinants of health change over time in the same individuals.3-8 Understanding the persistence of adverse social determinants may help to better target interventions to assist patients.
Our health system began systematically screening patients in 2019. As a result, many patients have been screened more than once. We therefore sought to examine changes in social determinants among patients screened at baseline and again after 6 to 18 months. The focus of this aim includes multiple social determinants related to food insecurity, financial strain, transportation, housing stability, utilities affordability, other housing problems, intimate partner violence, social connection, physical activity, daily stress, and digital connectivity. We further explored correlates of changes in food insecurity, including patient demographic factors, time between screenings, and referral for assistance. We focused on food insecurity because it is a common need among our patients and leads to numerous referrals to community organizations for assistance. We also found in previous work that food insecurity co-occurs with other social determinants, particularly financial strain, transportation, housing stability, utilities affordability, other housing problems, social connection, physical activity, and daily stress. 9 Our project aims are (i) to determine the proportion of patients with changes in each social determinant over time and (ii) to determine the factors independently associated with changes in food insecurity.
Methods
The MetroHealth System in Cleveland, Ohio screens adult patients for several social determinants of health using previously validated survey questions. The questions ask about food insecurity, financial strain, transportation, housing stability, utilities affordability, other housing problems, intimate partner violence, social connection, physical activity, daily stress, and digital connectivity. For example, 2 questions were used to assess food insecurity: (i) within the past 12 months, you worried that your food would run out before you got the money to buy more, and (ii) within the past 12 months, the food you bought just didn’t last and you didn’t have money to get more. 10 Patients answered using a 3-point Likert scale (never true, sometimes true, or often true), and patients who answered sometimes or often true for either questions were categorized as having food insecurity. Our entire social determinants of health questionnaire has been previously published in this journal. 11
Screening occurs through (i) an online patient portal, (ii) contact with a staff person at an outpatient visit or hospital-sponsored community event, or (iii) mailed questionnaires. The staff involved in screening include community health workers, social workers, care coordinators, and nurses. Patients with social needs who request help are referred to community service organizations for assistance through an electronic referral platform. Referrals are generally initiated by community health workers or social workers. Approximately 200 community organizations participate in the electronic referral platform, for example Greater Cleveland Food Bank (food assistance), Senior Transportation Assistance (transportation services), and Benjamin Rose Institute on Aging (housing and shelter, utility bill payment assistance). Community organizations use the same platform to report referral outcomes as resolved or unresolved. Community organizations are responsible for determining if a referral is resolved or not. Resolved is defined as the community organization provided the requested service or the patient was able to resolve the problem on their own. Unresolved is defined as patient was unable to be contacted by the community organization or declined assistance. Patient screenings are repeated approximately every 6 to 18 months by a staff member when patients are scheduled for outpatient visits or attend a hospital-sponsored community event. If patients have not completed a screening questionnaire in the previous 12 months, they are requested to complete a questionnaire through an online patient portal (or by mail if they have not created an online portal account).
We reviewed all patients who were screened more than once between May 2019 and March 2023. We used descriptive statistics (mean, standard deviation, and percentage) to examine patient characteristics. We determined the proportion of patients with changes in each social determinant from the first (baseline) questionnaire to a second (follow-up) questionnaire 6 to 18 months later. We also conducted a subgroup analysis limited to patients screened after December 31, 2020 (to avoid the immediate impacts of COVID-19 pandemic) who had at least 12 months between baseline and follow-up screens (to allow sufficient time to examine changes in social determinants).
Subsequent analyses focused on all patients with food insecurity at baseline. We used the chi square test to examine the univariate relationship between patient/referral variables and not experiencing food insecurity at follow-up among these patients. We used logistic regression to examine the multivariate relationship between patient/referral variables and not experiencing food insecurity at follow-up. Specific predictor variables for these analyses included patient demographic factors, baseline social determinants of health, time between baseline and follow-up screening questionnaires, whether patients were referred for food assistance, and whether referrals were resolved.
This project was categorized by the MetroHealth Institutional Review Board as a quality improvement initiative that did not require further Institutional Review Board oversight. All analyses were conducted using JMP Pro 17, SAS Institute, Cary, North Carolina.
Results
A total of 54 345 patients were screened at least once during the project interval. Of these, 24 702 (45.5%) were screened at baseline and again 6 to 18 months later. Their mean age was 51.2 years, a majority were female, and most were White or Black (Table 1). The most common social determinants of health were social isolation (45.2%), housing instability (34.0%), and financial strain (22.9%).
Patient Characteristics (n = 24 702). a

Results are number (percentage) for categorical variables and mean (standard deviation) for continuous variables.
Denominators are less than 24 702 because some patients did not answer all questions at baseline.
Homeless, lived in more than 3 places in the last year, or unable to pay mortgage or rent on time.
Such as pests; mold; lead paint or pipes; water leaks; and smoke detectors, oven, or stove not working.
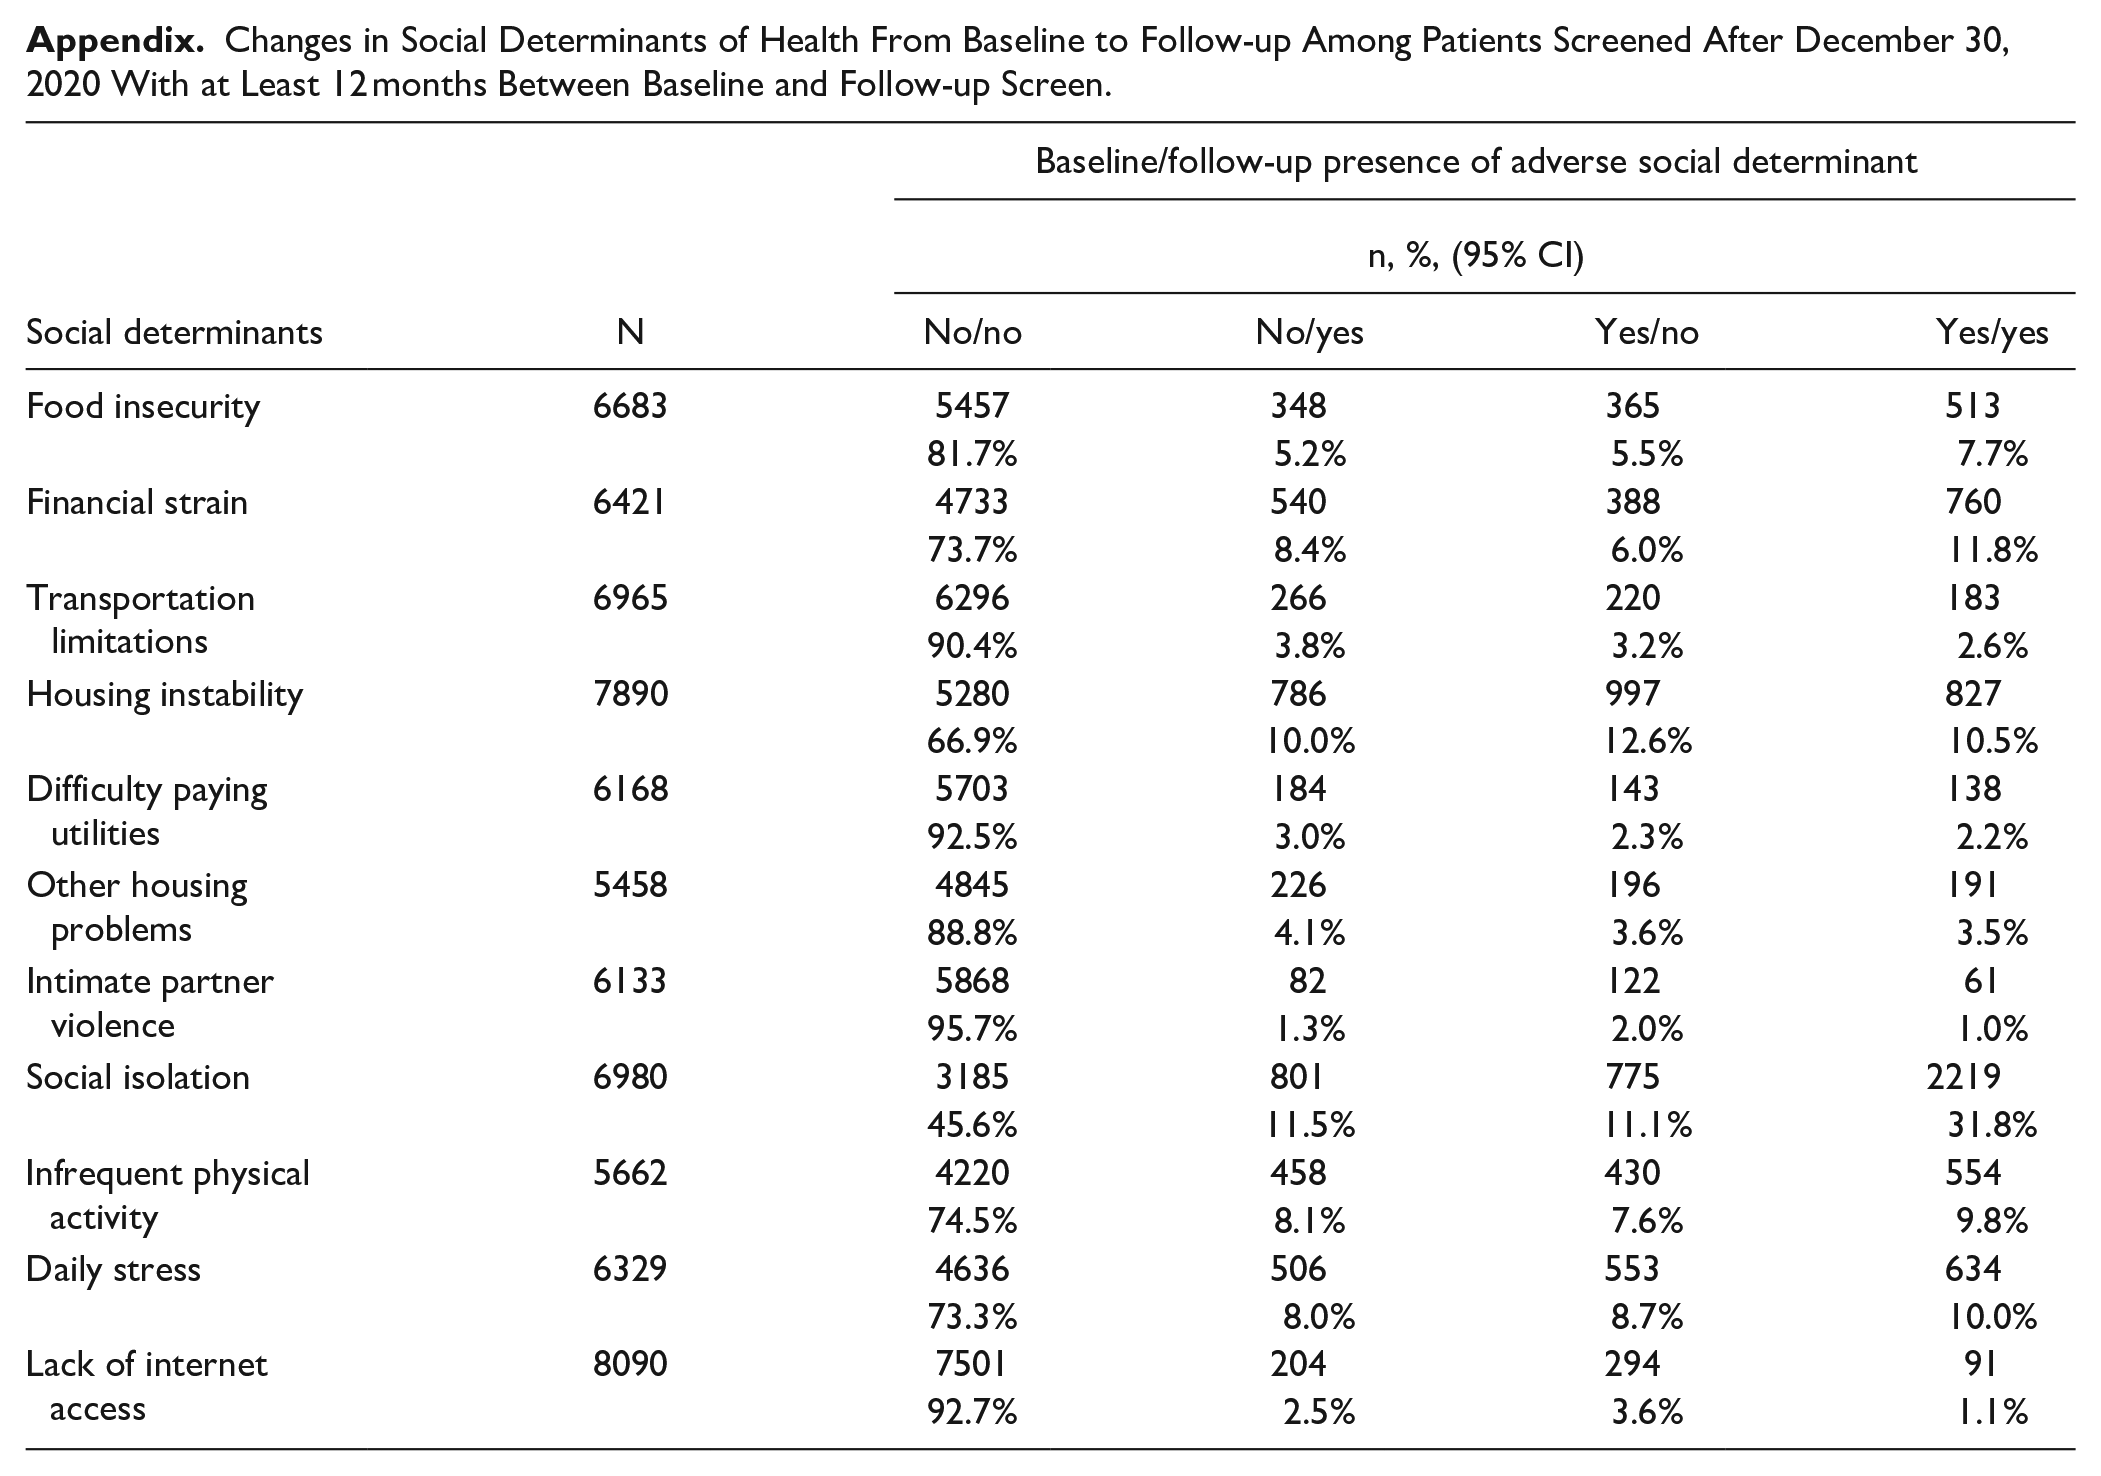
The number of patients with each social determinant at baseline and follow-up is listed in Table 2. For each social determinant, the largest proportion of patients were those who did not screen positive at both time points. For example, among 18 038 patients screened twice for food insecurity, 13 913 (77.1%) did not screen positive for food insecurity at baseline and follow-up and 1726 (9.6%) screened positive at both times. A total of 1080 (6.0%) did not screen positive for food insecurity at baseline but did screen positive at follow-up while 1319 (7.3%) screened positive at baseline but not at follow-up. Examining whether confidence intervals overlap or not provides further insight into changes. More patients overcame food insecurity (7.3%, 95% confidence interval [CI] = 6.9%-7.7%) than developed new food insecurity (6.0%, CI = 5.6-6.3%). Favorable changes were also noted for housing instability (18.2% vs 10.9%), intimate partner violence (2.4% vs 1.4%), and daily stress (9.3% vs 8.4%). Subgroup analyses limited to patients screened after December 31, 2020 who had at least 12 months between baseline and follow-up screens revealed similar patterns (Appendix).
Changes in Social Determinants of Health From Baseline to Follow-up.

Numbers are less than in Table 1 because some patients did not answer all questions at follow-up.
Among 3045 patients who screened positive for food insecurity at baseline, 1319 (43.3%) did not screen positive at follow-up (Table 3). On univariate analysis, not screening positive at follow-up was associated with age, type of health insurance, annual income, and several social determinants of health. For example, not screening positive for food insecurity at follow-up was associated with not screening positive for financial insecurity (57.4% vs 38.7%, P < .001). On multivariate analysis (Table 3), not screening positive for food insecurity at follow-up was independently associated with being age ≥60 years (odds ratio [OR] = 1.46, 95% confidence interval [CI] = 1.02-2.10), not screening positive for financial strain (OR = 1.64, CI = 1.27-2.13), not screening positive for housing problems (OR = 1.65, CI = 1.28-2.13), and not screening positive for intimate partner violence (OR = 1.45, 95% CI = 1.02-2.08). A longer duration between baseline and follow-up screening was also independently associated with not experiencing food insecurity at follow-up. Neither being referred for food assistance nor having a resolved referral were associated with not experiencing food insecurity at follow-up.
No Food Insecurity at Follow-up Among Patients With Food Insecurity at Baseline (n = 3045).
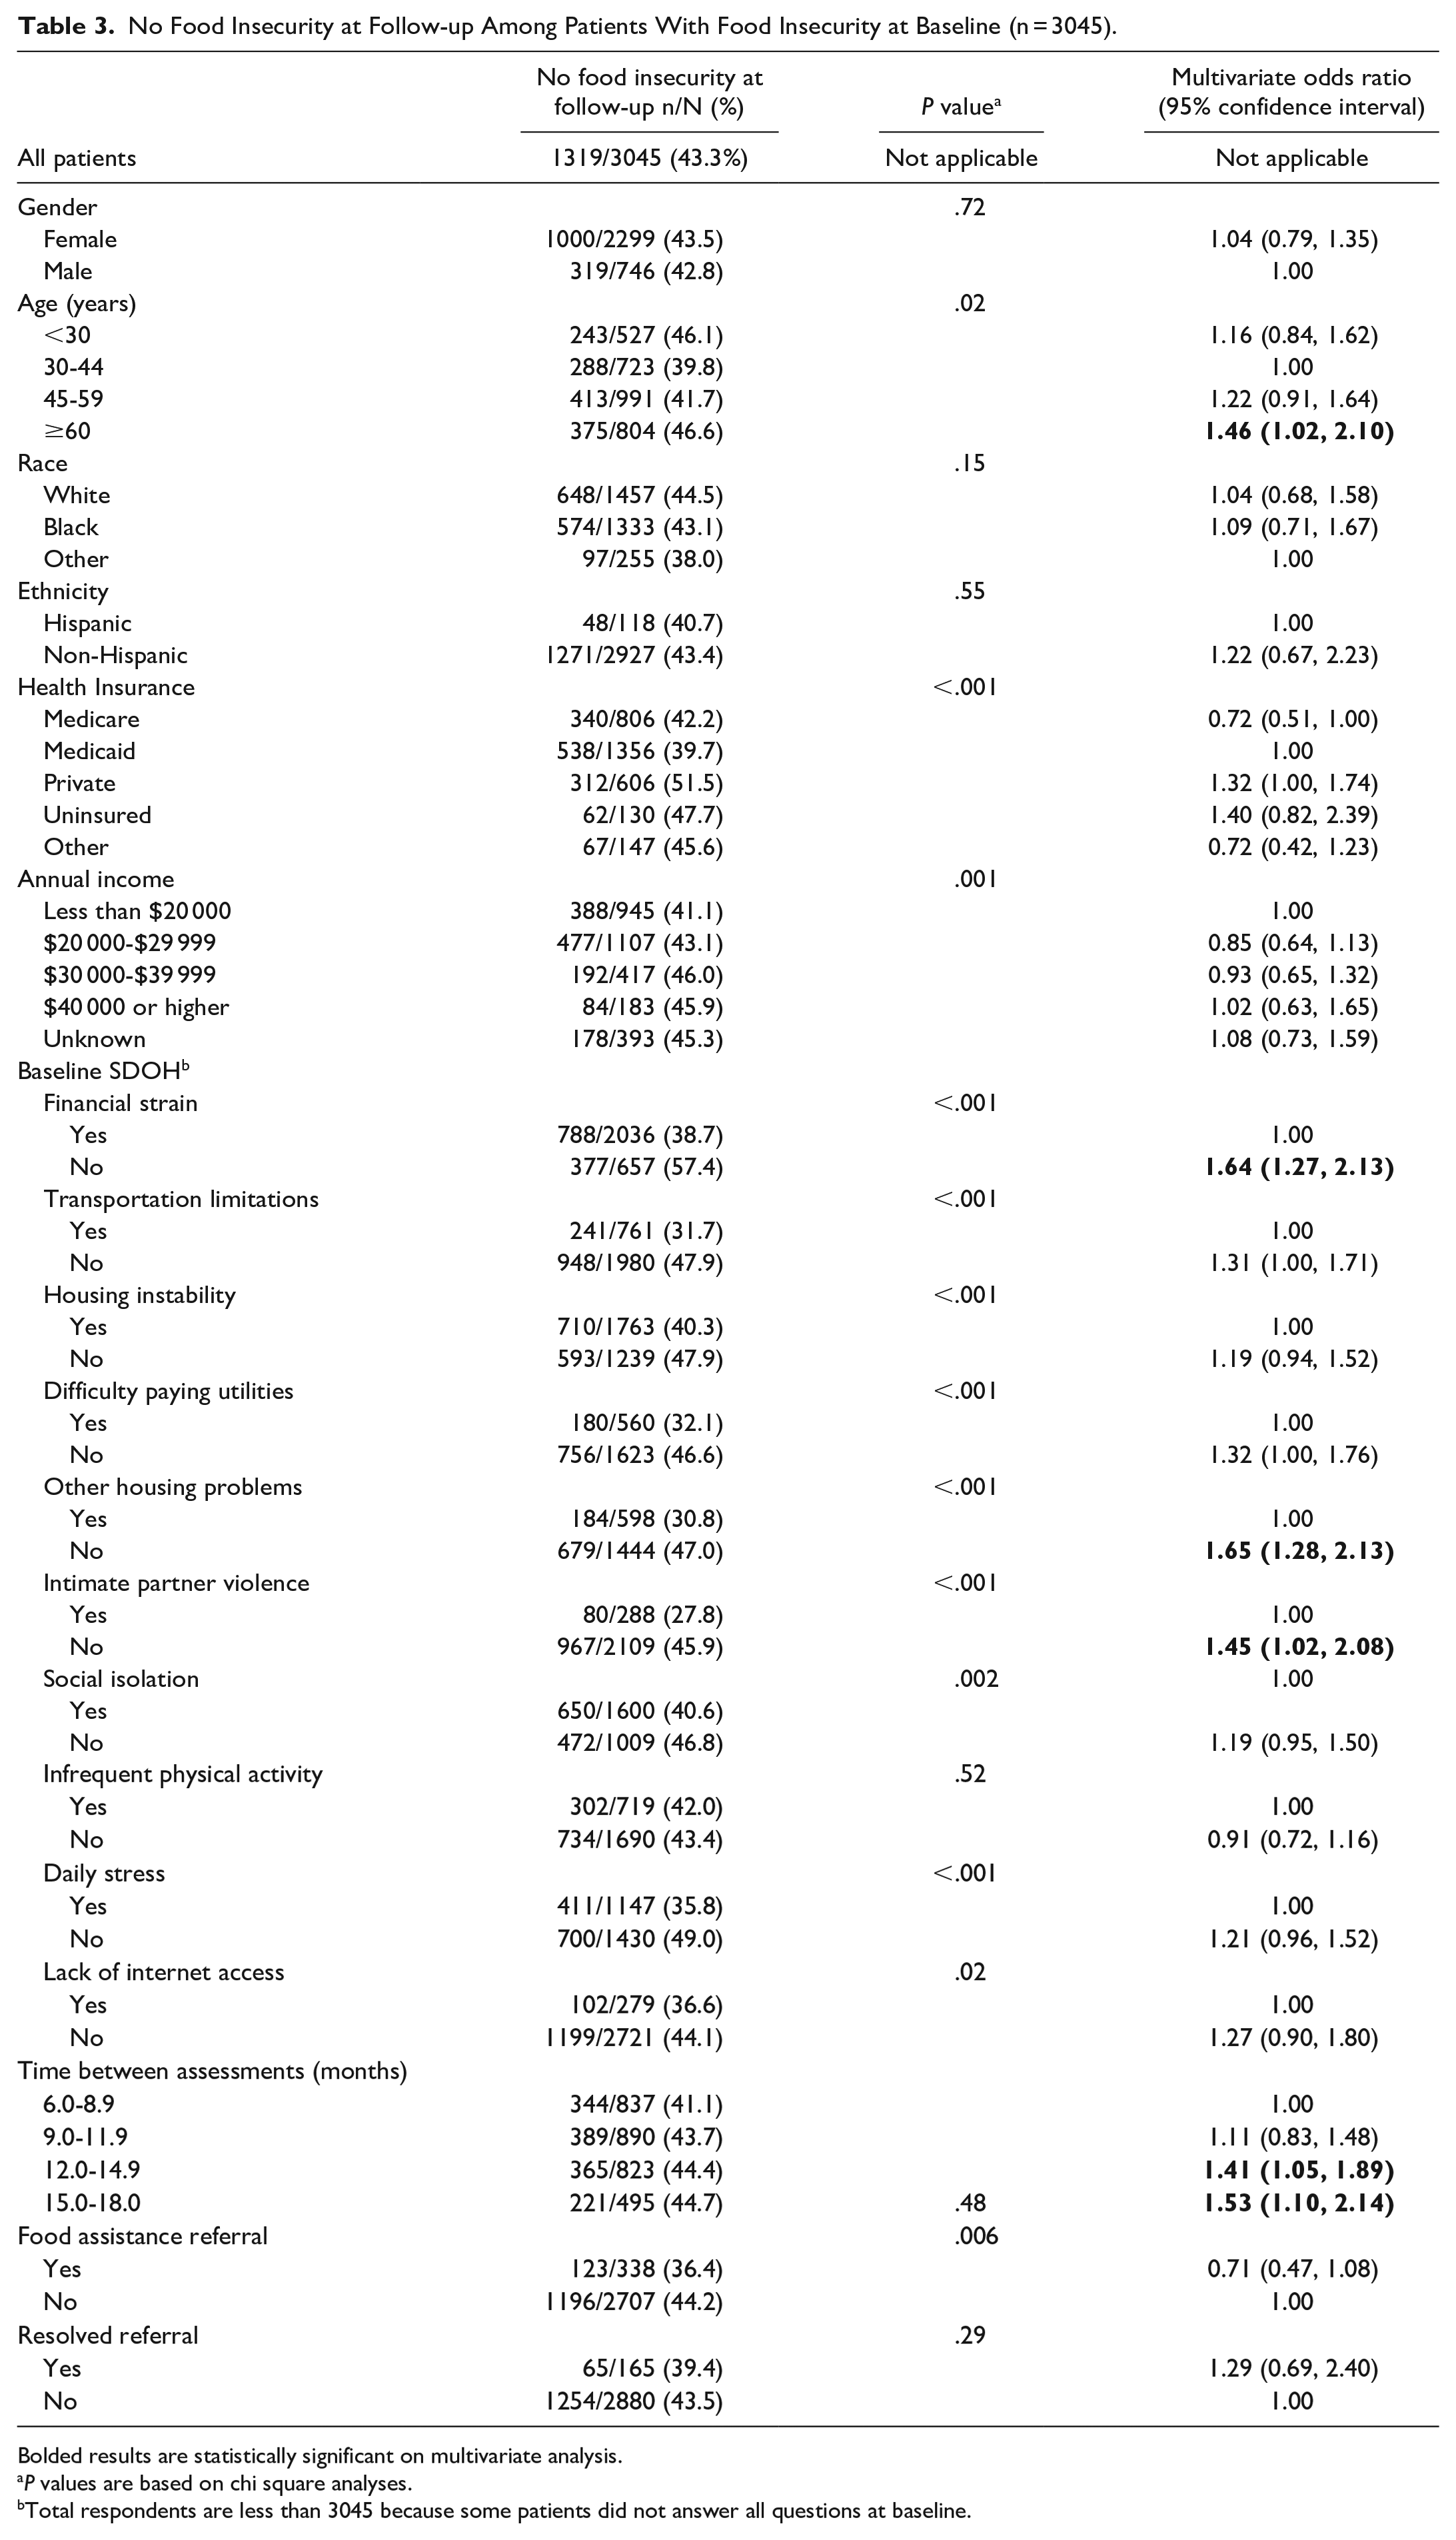
Bolded results are statistically significant on multivariate analysis.
P values are based on chi square analyses.
Total respondents are less than 3045 because some patients did not answer all questions at baseline.
Discussion
The goals of this project are to determine changes in social determinants of health over time and to determine the factors independently associated with changes in food insecurity. For each social determinant of health, we found that most patients did not screen positive at both baseline and follow-up. Smaller numbers of patients screened positive at both time points or had a change from baseline to follow-up. Social determinants with favorable changes included food insecurity, housing instability, intimate partner violence, and daily stress. Overcoming the adverse determinant of food insecurity was independently associated with a number of patient factors but not with referral for assistance or resolved referral. These factors include 3 other social determinants: financial strain, housing problems, and intimate partner violence. Financial strain and housing problems likely indicate broader financial difficulty while previous studies have noted an association between economic stress and interpersonal violence.12,13
The trends over time in social determinants that we identified at a single health system in Ohio may or may not be similar to trends in other regional or national samples. A study of nationally representative samples of American adults noted that there were small decreases in the prevalence of 4 social determinants from 2017 to 2019, including inability to pay rent or mortgage, inability to pay utility bills, food insecurity, and moving due to eviction or foreclosure. 3 Another study of Georgia refugee communities found that a majority of participants reported difficulty paying for food, housing, and healthcare. There was little change in these measures over a 1 year period. 4 By contrast, a small Connecticut study of overweight or obese adolescents and their caregivers found that self-reported food insecurity increased during the COVID-19 pandemic. 5 Three reports, all based on data from the national Early Childhood Longitudinal Study, also examined changes in food insecurity over time.6-8 From 2010 to 2011, 9.2% of families had persistent food insecurity while 9.4% had new or worse food insecurity. In addition, 12.8% of families had food insecurity in 2010 that resolved or lessened by 2011. 8
We recommend that health systems monitor changes over time in their patients’ social determinants of health to better distinguish between vulnerable patients (those with persistent or new adverse social determinants) and more resilient patients (those without adverse social determinants). This will provide 3 types of useful information. First, health systems will be able to determine overall progress in addressing specific social determinants. For example, we found that 43.3% of patients who screened positive for food insecurity at baseline did not screen positive at follow-up (Table 3). However, this means that 56.7% of these patients had persistent food insecurity. Second, health systems will be able to identify subgroups at greatest risk of persistence. In this analysis, patients with other adverse social determinants (ie, financial strain, housing problems, intimate partner violence) were more likely to report continued food insecurity at follow-up. Third, health systems will be able to evaluate the impact of referral and assistance efforts. We found that only a modest number of patients with food insecurity at baseline were referred for assistance. Furthermore, having a resolved referral was not associated with absence of food insecurity at follow-up.
Our multivariate results found no relationship between resolution of food insecurity and referral for assistance or resolved referral. Why do adverse social determinants of health among patients often persist despite screening, referral, and assistance efforts? Some patients decline to be referred to community organizations for assistance or are unable to connect with such organizations despite being referred. 11 Even when patients connect with community organizations, the help they receive may be insufficient, of the wrong type, or of too short a duration. Carefully tracking patients as they progress through the referral and assistance process, obtaining the perspectives of patients and community organizations, and utilizing community health workers as navigators could be useful ways to understand and improve outcomes. Tracking patients and obtaining the perspectives of patients and community organizations may help to identify gaps in the referral and assistance process. Utilizing navigators may help to ensure that patient needs are adequately addressed by community organizations, to determine if patients have additional needs, and to make additional referrals as appropriate. Assistance delivered to specific patients also does not address societal structural factors which contribute to individual social needs such as poverty, racism, and segregated neighborhoods. To address upstream problems, health systems should advocate for measures such as livable wages, adequate funding of public education, early childhood programs, earned income tax credits, public transportation expansion, affordable housing, and safer alcohol sales.14,15 It is worth noting that several terms, including social determinants, social drivers, and health-related social needs, are sometimes used interchangeably. Regardless of the terminology, it is important to distinguish between individual-level needs and upstream structural factors.15,16
Strengths of our project include a large and diverse patient sample and standardized assessment of social determinants. Another strength of this effort is our ability to track all referrals and obtain feedback from community organizations about the results of each referral. Several limitations must be considered in interpreting our findings. The study relied on self-reported data. We focused on a single health system. The results may not apply to the majority of our health system’s patients who have only been screened once. The number of patients with resolved referrals was small which may have limited our ability to find a statistically significant benefit on multivariate analysis (Table 3). The food insecurity questions ask about the previous 12 months. As a result, patients who were food insecure at baseline and have a follow-up screening less than 12 months later may still answer that they had worries about food during the past 12 months regardless of their current status. We do not have information on the type of assistance provided by community organizations, on other assistance that patients may have obtained on their own, or on patients’ perspectives regarding the usefulness of assistance. We examined correlates of changes in food insecurity but did not examine correlates for other social determinants of health. The COVID-19 pandemic may have influenced some social determinants due to disruptions in employment or availability of government relief programs. We do not have information on other social determinants of health such as education, racism, pollution, language, and literacy.
Footnotes
Appendix
Changes in Social Determinants of Health From Baseline to Follow-up Among Patients Screened After December 30, 2020 With at Least 12 months Between Baseline and Follow-up Screen.
| Social determinants | N | Baseline/follow-up presence of adverse social determinant | |||
|---|---|---|---|---|---|
| n, %, (95% CI) | |||||
| No/no | No/yes | Yes/no | Yes/yes | ||
| Food insecurity | 6683 | 5457 | 348 | 365 | 513 |
| 81.7% | 5.2% | 5.5% | 7.7% | ||
| Financial strain | 6421 | 4733 | 540 | 388 | 760 |
| 73.7% | 8.4% | 6.0% | 11.8% | ||
| Transportation limitations | 6965 | 6296 | 266 | 220 | 183 |
| 90.4% | 3.8% | 3.2% | 2.6% | ||
| Housing instability | 7890 | 5280 | 786 | 997 | 827 |
| 66.9% | 10.0% | 12.6% | 10.5% | ||
| Difficulty paying utilities | 6168 | 5703 | 184 | 143 | 138 |
| 92.5% | 3.0% | 2.3% | 2.2% | ||
| Other housing problems | 5458 | 4845 | 226 | 196 | 191 |
| 88.8% | 4.1% | 3.6% | 3.5% | ||
| Intimate partner violence | 6133 | 5868 | 82 | 122 | 61 |
| 95.7% | 1.3% | 2.0% | 1.0% | ||
| Social isolation | 6980 | 3185 | 801 | 775 | 2219 |
| 45.6% | 11.5% | 11.1% | 31.8% | ||
| Infrequent physical activity | 5662 | 4220 | 458 | 430 | 554 |
| 74.5% | 8.1% | 7.6% | 9.8% | ||
| Daily stress | 6329 | 4636 | 506 | 553 | 634 |
| 73.3% | 8.0% | 8.7% | 10.0% | ||
| Lack of internet access | 8090 | 7501 | 204 | 294 | 91 |
| 92.7% | 2.5% | 3.6% | 1.1% | ||
Declaration of Conflicting Interests
The author(s) declared no potential conflicts of interest with respect to the research, authorship, and/or publication of this article.
Funding
The author(s) received no financial support for the research, authorship, and/or publication of this article.