
Abstract
We examined healthcare costs at HonorHealth, a community-based academic health center comprised of 5 hospitals and numerous ambulatory care facilities. Patient encounters that resulted in admission in 2019 were included in the study. Mean costs in 2019 for high costs and high needs (HCHN) patients were compared with all remaining patients using a framework developed by the National Academy of Medicine. HCHN patients were older (71 vs 52 years), with a lower percentage of females (41.7% vs 59.8%), more frequently White (90.1% vs 87.5%), less frequently married (52.4% vs 54.5%), with a longer length of stay (6.5 vs 3.0 days) and higher mean charges ($134 743 vs $16 414). The mean cost per patient in the HCHN group decreased by age group ($192, 963, $165 200, $144 584, $134 795, and $108 356) for 0 to 18, 19 to 44, 45 to 64, 65 to 84, and 85+ years, respectively. HCHN patients were more publicly insured (49% vs 38%). Targeted interventions to treat HCHN may lead to lower healthcare costs and improved health outcomes within this system.
Introduction
Healthcare spending continues to be far higher in the United States than in other high-income countries, however, Americans still experience worse health outcomes compared to their peers around world. 1 A large percentage of these costs are attributable to a strikingly small but heterogeneous group of patients: high-need patients, defined as patients with multiple chronic conditions (MCC) with or without functional limitations.2 -4 Between 2009 and 2011, 6 million adults accounted for the top 10% of healthcare spending in the U.S.; of these, the majority (57%) were categorized as people with MCC without functional limitations. 5
In response to this imperative, healthcare systems are focusing their efforts to enhance care for high-cost, high-need (HCHN) patients, with the goal of improving patient health outcomes while reducing healthcare spending. However, solely focusing on cost as a determinant for patient intervention may prove to be inadequate, as it overlooks the unique personal characteristics and diverse needs of individuals. Therefore, a more nuanced understanding of the relationship between high costs and high needs is necessary.6 -8
High costs may, in part, be attributed to a lack of access to primary care, poor control of chronic disease, and the need for care coordination.4,8 -10 Further, neighborhoods with greater social needs exhibit higher spending on potentially preventable healthcare such as preventable emergency department visits, preventable hospitalizations, and unplanned 30-day hospital readmissions. Structural and economic barriers adversely influence the health and well-being of people living in under-resourced communities, leading to disproportionate rates of chronic disease, utilization of emergency healthcare services, and mortality.11 -13 The majority (56%) of patients have a co-existing behavioral health condition.14,15
The National Academy of Medicine (NAM) outlines 6 clinical taxonomies for high-need patients: children with complex needs, non-elderly disabled, multiple chronic, major complex chronic, frail elderly, and advancing illness.16,17 In this study, a community-based health system comprised of 5 hospitals serving disparate communities used the NAM framework to,13,16 (1) identify the high-cost patient population and (2) segment high-need patient populations with major complex chronic conditions within the high-cost category.14,17 Examining the demographics and needs of the HCHN population can shed light on affected individuals and guide strategic interventions to improve patient lives and reduce the cost burden.
Data from this article were previously presented at AcademyHealth 13th Annual Conference on the Science of Dissemination and Implementation in Health; AcademyHealth Health Datapalooza/National Health Policy Conference
Materials and Methods
Study Design
We used the framework and taxonomy introduced by Joynt et al 17 and conceptualized by NAM in 2017 to identify high-cost, high-need patient populations. High-cost patients were identified as those in the top 10% of annual healthcare spending for the hospital system, based on mean total charges. High-need was defined as patients with multiple chronic conditions, based on ICD-10 codes. Multiple chronic conditions could include acute myocardial infarction, ischemic heart disease, chronic kidney disease, congestive heart failure, dementia, chronic lung disease, psychiatric disease, cardiac arrhythmia, and diabetes. Major complex chronic (MCC) is defined as ≥2 of the top 10 patient diagnoses, per high-cost group including congestive heart failure, vascular disease, chronic obstructive pulmonary disease, specified heart arrhythmias, renal failure, diabetes without complication, cardiorespiratory failure and shock, polyneuropathy, major complications of medical care and trauma, and angina pectoris/old myocardial infarction. 14
Inclusion and Exclusion Criteria
The study sample included all patients aged 0 to 85+ years with at least 1 inpatient hospital admission between January 1, 2019, and December 31, 2019. Patient data were extracted from the health system data platform and de-identified prior to analysis, except for zip code. Zip code was used as a proxy for social needs. Emergency department admissions were excluded. Partial or incomplete data files were excluded. We excluded patients who met the criteria for other categories in the taxonomy (ie, frail elderly). Patients with multiple admissions were evaluated based on each encounter with the hospital system. The data evaluated (ie, length of stay) refers to each patient encounter.
Data analysis
Data were extracted and cleaned by one of the authors (EK) using the institutional health data platform. Patient data were stratified by demographic characteristics (gender, race/ethnicity, payer status, and age), length of stay (LOS), mean total charges per patient, and social variables (marital status). The authors used GraphPad Prism Statistics for Windows, Version 10 (Dotmatics, Boston, MA) and Statistics Kingdom (Melbourne, Australia) to analyze the data and perform statistical significance tests. 18 Statistical analysis was performed using Welch’s t-test. Due to large discrepancy in sample sizes (15 486 and 565 161), an unequal variance was assumed. Significance was determined only if P < .001 was achieved. Due to the effects of large sample sizes on significance, the mean difference, a Cohen’s d, and a Cohen’s h were used to accompany Welch’s t-test and measure effect size. 19 Cohen’s d and h are classified by varying degrees of effect size: very small (d or h < 0.2), small (0.2 < d or h > 0.5), medium (0.5 < d or h > 0.8), and large (d or h > 0.8). 20 The HonorHealth Institutional Review Board determined this project was exempt from IRB review, #1714848.
Results
Between January 1, 2019, and December 31, 2019, there were 580 629 total patient encounters across 5 hospital locations, of which 58 062 met the criteria for high-cost, and 15 468 met the criteria for high-cost and high-need status (HCHN). Patient characteristics were compared between HCHN patient encounters (n = 15 468) and all remaining patient encounters (n = 565 161).
The mean age was significantly greater in the HCHN patient population (M = 70.56 years, SD = 13.29 years) when compared to all other patients (M = 51.89 years, SD = 22.61 years), P < .001. It was determined that there was a large effect size for age difference (d = 1.01, MD = 18.68 years, CI [18.46-18.89]). The mean length of stay (LOS) was significantly greater for HCHN patient encounters (M = 6.53 days, SD = 6.49 days) when compared to all other patients (M = 3.03 days, SD = 6.50 days), P < .001. It was determined that there was a medium effect size for LOS difference (d = 0.54, MD = 3.51 days, CI [3.40-3.61]). The mean total charges were significantly greater in the HCHN patient population (M =$ 134 743, SD = $124 088) when compared to all other patients (M = $16 414, SD = $39 677), P < .001. It was determined that there was a large effect size (d = 1.28, MD = $118 329, CI [116 366-120 292]; Table 1).
Overview Comparison of HCHN Patient Encounters to All Other Patients, 2019.
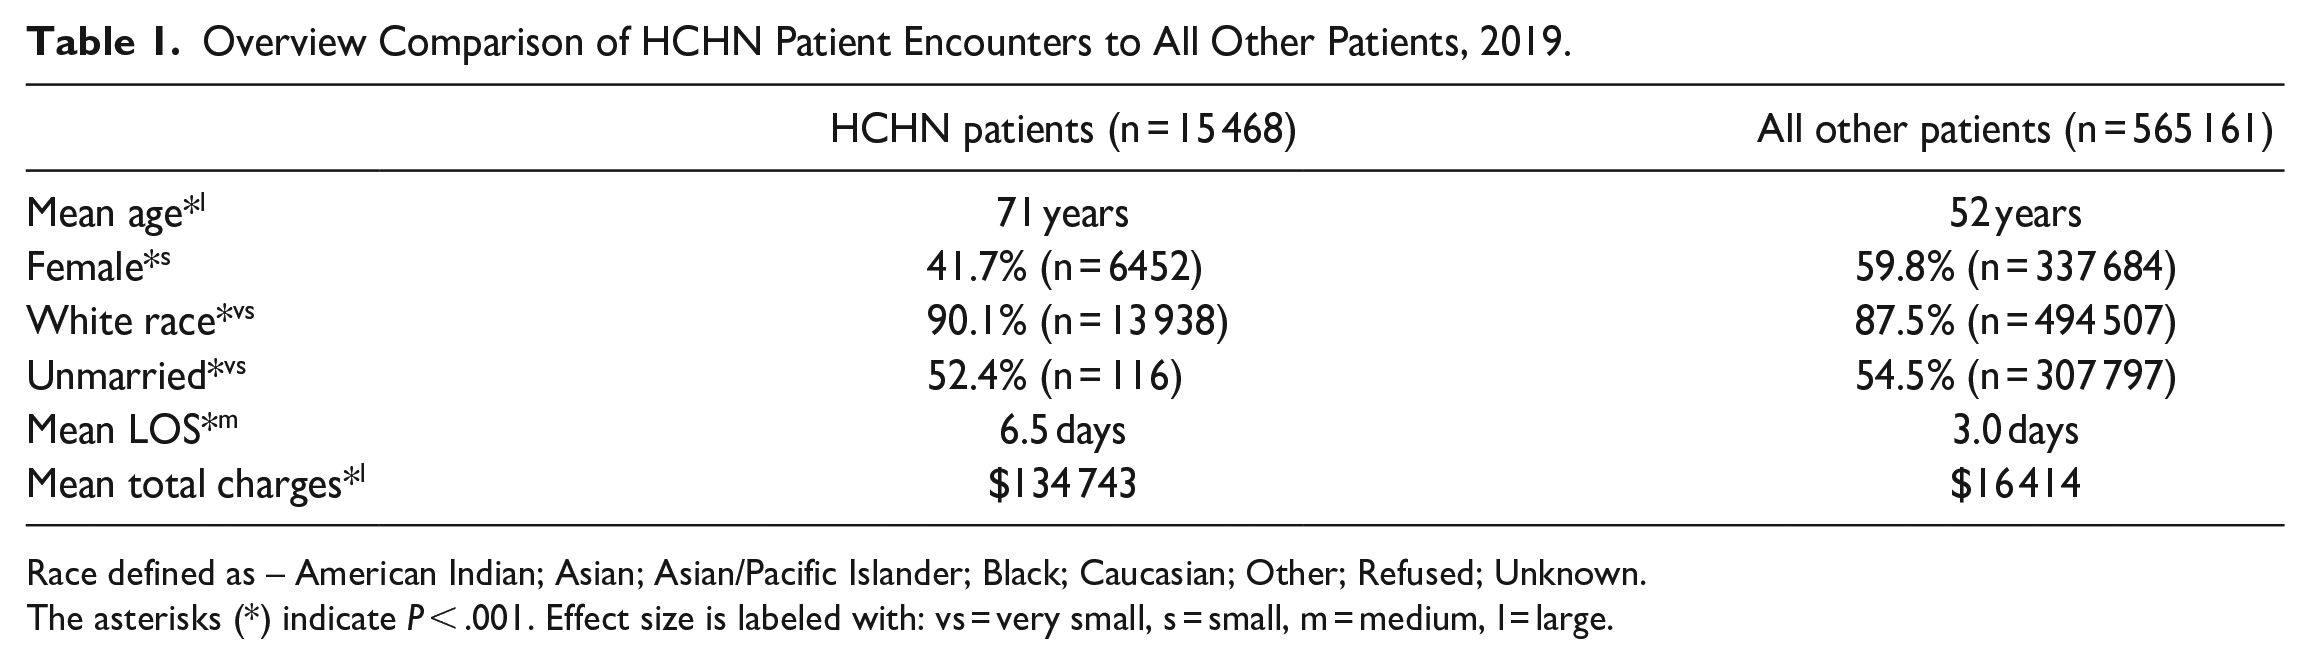
Race defined as – American Indian; Asian; Asian/Pacific Islander; Black; Caucasian; Other; Refused; Unknown.
The asterisks (*) indicate P < .001. Effect size is labeled with: vs = very small, s = small, m = medium, l = large.
For HCHN patient encounters, the population was predominantly White (n = 13 938; 90.1%), male (n = 9016; 58.3%), and unmarried (n = 8116; 52.4%). For the remaining patient encounters, the population was predominantly White (n = 494 507; 87.5%), female (n = 337 684; 59.8%), and not married (n = 307 797; 54.5%; Table 1).
The mean number of chronic conditions per HCHN patient encounter was 3.1. The greatest percentage of HCHN patient encounters were seen by hospital location 4 (n = 4076; 26%), while the majority of all other patient encounters were seen by hospital location 1 (n = 158 609; 28%; Table 2).
Stratified Characteristics of HCHN Patient Encounters (n = 15 468), Compared to All Other Patient Encounters (n = 565 161), 2019.

Race defined as – American Indian; Asian; Asian/Pacific Islander; Black; Caucasian; Other; Refused; Unknown.
The asterisks (*) indicate P < .001. Effect size is labeled with: vs = very small, s = small, m = medium, l = large.
HCHN patient encounters between 0 and 18 years (n = 4) accounted for the highest mean total charges (M = $192 963, SD = $156 974). HCHN patient encounters between 19 and 44 years (n = 599) accounted for the next highest mean total charges (M = $165 200, SD = $249 744). The mean of total charges for HCHN patient encounters significantly decreased from each age group, starting from the 19 to 44 years age group up to the 85+ years age group (P < .001). All other patient encounters between 65 and 84 years (n = 151 739) accounted for the highest mean total charges (M = $19 669, SD = $42 345). Mean total charges were significantly greater in HCHN patient encounters compared to all other patients in all age groups except for 0 to 18 years (P < .001; Figure 1).

Mean total charges for HCHN patient encounters and all other patient encounters, by age group, 2019.
For HCHN patient encounters, Medicare was the payer type with the largest distribution (n = 6074; 39%). Out of all other patient encounters, Managed Care, both commercial and publicly funded, was the payer type with the largest distribution (n = 190 540; 34%; Figure 2).

Principal payer type for HCHN patient encounters, compared to total patients, 2019.
Discussion
In this project, the HCHN patient population was determined to be predominantly White, male, older, unmarried, and publicly insured (Table 1). HCHN patient encounters experienced longer LOS (6.5 vs 3.0 days) compared to all other inpatient encounters. HCHN patients experienced an average of 3.1 chronic conditions (Table 2). In contrast to some literature, this project found that men account for most HCHN patients. 16 The total inpatient population in 2019 was predominantly women (59%), and state gender demographics are equivalent to national demographics. Thus, chronic illness and gender distribution may require further investigation.
This is the first assessment of patients with complex needs across this healthcare system. The average total patient costs for HCHN patients are 8-fold greater than that of the total patient population ($134 743 vs $16 414; Table 1). Roughly half of HCHN patient encounters are publicly insured by Medicare or Medicaid, compared to the all other patient encounters (49% vs 38%; Figure 2).
These findings are consistent with prior studies that recognize the need for population-based interventions, the intersection between social needs and healthcare, and the disconnect between health insurance and access to comprehensive healthcare.16,17 These initial findings suggest further work in assessing this population by teasing out population subgroups by payer status, evaluating patients who qualify for Medicaid and Medicare (“dual eligible”), and specifying high-risk co-morbidities in the analyses, such as substance use disorder.14,15 Our research will facilitate focused, cost-effective population health interventions to address inequities.21,22
The workforce implications associated with caring for patients with complex needs are significant and call for integrated, team-based models. Current reimbursement models are not optimally designed for innovative community-based care teams, social and behavioral interventions, and integrated data platforms for streamlining care coordination. Linking changes to health professions education, clinical practice, and policy change is a daunting but necessary task. 16
Limitations
Limitations include not controlling access to other sources of care, since patient data only included admittance to the 5 HonorHealth hospitals and did not include patient visits to physicians outside of the hospital system. Similar limitations are reflected in patient populations seen in other studies. 17 These limitations likely reflect the challenges faced by vulnerable patients and populations in accessing care due to structural, societal, and economic barriers. 8 Other limitations include a small cohort of patients between 0 and 18 years which skewed high-cost data. This may, in part, reflect the cost of care for children with complex needs; in future projects, we may delineate age cohorts to include patients >18 years to encompass adult chronic disease processes. 15 Finally, the race and ethnicity variables included in the health system data did not accurately represent national minimum standards, thereby limiting the demographic analyses of the patient population.23,24 Capturing accurate race data can be difficult due to lack of responses and patient reluctance to share personal information. 25 By making responses to the race/ethnicity question mandatory (with options for “other” and “choose not to answer”), the data became more accurate. For further improvement, questions should be expanded to include new subcategories (ie, Hispanic). Because of these limitations, the results present a sample that does not fully reflect the community or population served.
Conclusion
These findings will help this, and other community-based health systems develop an operational framework to guide interventions to improve the delivery of care to high-need populations. The next steps include incorporating additional behavioral health and social risk factors and mapping them to specific hospital locations. This adapted model may be implemented by other health systems working toward scalable initiatives to develop an integrated medical, social, and behavioral model of intervention. These data may lead to innovative and sustainable solutions that integrate reliable data platforms, connect clinicians with community partners, and result in measurable outcomes to positively impact population health.
Footnotes
Declaration of Conflicting Interests
The author(s) declared no potential conflicts of interest with respect to the research, authorship, and/or publication of this article.
Funding
The author(s) received no financial support for the research, authorship, and/or publication of this article.