
Abstract
Introduction
Type 2 diabetes mellitus, which affects 346 million people worldwide, is a major personal, social, and economic burden.1,2 Diabetes is an important comorbidity for other chronic illnesses commonly encountered in primary care. 3 Considerable research addresses community health diet and exercise strategies to prevent diabetes. Exercise is an especially attractive intervention because it is cost-free and offers potential health benefits beyond diabetes prevention. 4 Exercise is believed to help prevent diabetes by increasing insulin sensitivity (ie, the responsiveness of insulin-sensitive tissues to the metabolic actions of insulin). 5 Reduced insulin sensitivity, or insulin resistance, precedes type 2 diabetes on the continuum from normoglycemia to clinically diagnosed diabetes. Insulin resistance is marked by decreased insulin-stimulated glucose uptake in skeletal muscle and adipose tissue. 6 Exercise training is thought to affect insulin sensitivity via mechanisms related to carbohydrate and fat oxidation in skeletal muscle, vascular endothelial function, and synthesis of proteins involved in carbohydrate and fat metabolism.7,8
The possible positive health consequences of exercise in preventing diabetes have led to numerous primary studies testing exercise interventions. The proliferation of such studies has prompted some researchers to summarize existing knowledge, primarily through narrative summaries which cannot calculate the magnitude of effect or conduct moderator analyses to determine if effect sizes are linked with characteristics of the sample or intervention.7-10 Previous related meta-analyses have synthesized exercise intervention trials among adults with diabetes or to prevent gestational diabetes.11-20
Few meta-analyses have addressed diabetes prevention in nonpregnant adults. Four meta-analyses synthesized 2 to 9 primary studies of combined exercise and diet interventions on fasting glucose and incidence of diabetes outcomes among adults with elevated fasting glucose or impaired glucose tolerance test.21-24 One meta-analysis of only 2 primary studies focused on adults at high risk for diabetes and found that exercise did not significantly reduce diabetes incidence. 5 No previous meta-analysis has addressed exercise interventions conducted with healthy adults; nor have previous studies examined insulin sensitivity and resistance as outcomes. No previous synthesis has examined supervised exercise interventions with verified exercise dose. This project moves past previous syntheses to address the following questions: (a) What is the overall effect of supervised exercise interventions on insulin sensitivity in healthy adults when exercise subjects are compared to control subjects? (b) In treatment versus control comparisons, do intervention effects vary depending on sample characteristics of age, gender, preintervention body mass index, or preintervention insulin sensitivity? (c) In treatment versus control comparisons, do intervention effects vary depending on intervention characteristics of behavioral target (exercise vs exercise plus diet), exercise intensity, exercise duration per session, exercise session frequency, exercise total dose, and exercise mode (endurance vs endurance plus resistance)?
Methods
Standard systematic review and meta-analysis procedures were used to identify and retrieve potential studies, determine eligibility, code data, analyze primary study results, and interpret findings. PRISMA guidelines were used to conduct the study and report this project. 25 This study is part of a larger comprehensive meta-analysis examining physical activity interventions in healthy adults. The study protocol was not registered.
Sample
Inclusion Criteria
Eligible studies were English-language reports of insulin sensitivity and resistance outcomes following exercise interventions conducted with healthy adults. We included studies of exercise sessions supervised by research staff to verify exercise behavior and studies that measured insulin sensitivity, including fasting insulin as a surrogate index for insulin sensitivity, within 7 days after completing supervised exercise sessions.6,26 The hyperinsulinemic euglycemic glucose clamp is the gold standard for measuring insulin sensitivity/resistance.26,27 Unfortunately, the hyperinsulinemic euglycemic glucose clamp is rarely used in exercise studies because it is costly, invasive, and time-intensive.26,28 Surrogate markers of insulin sensitivity are commonly used and recommended for use in some forms of research and clinical practice.26,27,29 Fasting insulin is a commonly used surrogate marker of insulin resistance. 26 We excluded were studies that exclusively reported glucose levels, because these values can be poor indicators of insulin sensitivity. 6 We excluded projects that measured insulin sensitivity during or immediately after an exercise bout, because insulin sensitivity increases acutely with exercise.28,30
To reduce bias, we included both published and unpublished studies because the most consistent difference between published and unpublished research is the statistical significance of findings.31,32 Meta-analyses that include only published studies may overestimate effect sizes. Publication status is an inadequate proxy for study quality. We did not use primary study quality assessments as inclusion criteria, because extant study quality scales lack evidence of validity, mix report quality with study quality, and contain items not relevant to this area of science. 33 Primary study quality attributes were coded and reported. This project focused on treatment-versus-control effect sizes because these provide the most valid information. Given the limitations of single-group designs, we analyzed single-group pre–post comparisons as ancillary information that should be interpreted cautiously. Our findings emphasize the more valid 2-group comparisons.
Small-sample studies were included because it is important to synthesize across the range of research. Small studies might lack statistical power to detect differences, but because meta-analyses do not rely on primary study hypothesis tests these studies can contribute to synthesis findings. Studies were weighted such that small-sample studies had proportionally less influence on results.
Search Strategies
To enlarge the scope of studies beyond previous reviews and thus avoid biases introduced by narrow searches, we employed multiple search strategies. 34 Information sources included computerized databases, research registers, ancestry searches, author searches, and hand searches. An expert reference librarian conducted searches in 11 computerized databases (MEDLINE, Dissertation Abstracts, Sport Discus, EMBASE, PsychINFO, Healthstar, Cochrane Controlled Trials Register, Combined Health Information Database, Nursing and Allied Health Database, Database of Abstracts of Reviews of Effectiveness, Educational Resources Information Center) using broad search terms (sample MEDLINE intervention terms: clinical trial, intervention, treatment outcome, program, program development, program evaluation, outcome & process assessment, adherence, behavior therapy, compliance, counseling, evaluation, evaluation study, evidence-based medicine, health care evaluation, health behavior, health education, health promotion, patient education, self care, validation study; physical activity terms: exercise, physical activity, physical fitness, exertion, exercise therapy, physical education and training, walking). Search terms such as diabetes, insulin sensitivity, and insulin resistance were not used because this project was part of a larger comprehensive meta-analysis and limiting use of specific terms such as insulin helped ensure potential studies were not missed due to insufficient keyword terms applied to some potential primary studies. Initial searches were conducted in 2008 as part of the parent project, with automated monthly updates from computerized databases used to identify more recent studies. Research registers searched included the National Institutes of Health Research Portfolio Online Reporting Tool and mRCT, which has 14 active registers and 16 archived registers. 35 Ancestry searches of eligible primary studies and review articles were conducted. Computerized author searches were completed for corresponding authors of eligible studies. Hand searches of 114 journals were conducted. 35 Although time consuming, these diverse comprehensive search procedures are important because no single approach locates most eligible studies, and the pattern of bias varies among search mechanisms.34,36 These comprehensive search strategies yielded 54,642 research reports that we considered for inclusion.
Study Selection
A staged eligibility determination process was used to identify eligible studies for the parent project and for this meta-analysis. The staged process was used to ensure all eligible studies for any part of the parent project reached the coding phase. First, title and abstracts were reviewed for visual heralds suggesting a potentially eligible study. Second, full reports were examined to determine whether the study included an exercise intervention in healthy adults. Third, potential primary studies were examined for any eligible outcome for the parent study. Fourth, studies were sorted to identify those with insulin sensitivity outcomes. Finally, potential primary studies were evaluated for adequate data to calculate an insulin sensitivity effect size. A flowchart of potential studies movement through the project is available in supplementary material.
Data Collection Instrument and Process
A coding frame was developed, pilot tested with 50 primary studies in the parent project, and refined to record primary study results and characteristics of participants, research methods, and interventions as well as source attributes.37,38 Source characteristics included dissemination vehicle (eg, published article, dissertation, presentation at conference), presence of funding, and year of distribution. Sample mean age, gender, ethnic distribution, and anthropometric values such as preintervention body mass index were recorded. From primary reports we extracted intervention characteristics such as behavioral target (exercise only vs exercise plus other behaviors), aerobic only exercise versus aerobic plus resistance exercise, and exercise dose (minutes/session, number of sessions/week, total minutes of exercise). Research methods were coded, such as sample size, group allocation, percentage attrition, and insulin sensitivity measure.
We also extracted insulin sensitivity data. Pre- and postintervention means and standard deviations (SDs) for treatment and control groups were coded. If these data were not available, we coded other statistics that could be converted to the d index of effect size (eg, t statistic). If multiple research reports described the same study, all available reports were used to secure the required data. To prevent redundant data, we cross-checked all author names for all eligible studies to detect potentially overlapping samples.
Two extensively trained coders extracted data independently then compared coded values to achieve 100% agreement. A third doctorally prepared coder confirmed effect size data. Remaining discrepancies were resolved by the principal investigator.
Risk of Bias
Intensive and extensive search strategies were employed to avoid the bias introduced by including studies with larger effect sizes, which are often easier to locate. Search strategies included attempts to locate unpublished studies to reduce bias. Potential bias from selective reporting within studies was managed by coding a priori determined insulin sensitivity measures. Publication bias was assessed using multiple methods described below. Design bias was partially addressed by reporting effect sizes separately for 2-group postintervention comparisons, 2-group pre–post comparisons, and treatment single-group comparisons. Control single-group comparisons were used to explore potential bias from participation in research studies. Potentially biased measures were managed by excluding studies that reported fasting glucose values as measures of insulin sensitivity.
Statistical Analyses
The ability to combine outcomes across studies with different measures of the same construct is an important strength of meta-analyses. This is possible because the effect size is scale-free because of standardization.39,40 The standardized mean difference (d index) effect size used in this study reflects the difference in means between treatment and control subjects in terms of their shared SD. 40 Meta-analyses commonly combine primary research that did not use the same measurement operations for the outcome variable. 40 Effect size numerical values can be interpreted in a consistent manner across studies because of standardization. 40 We calculated a standardized mean difference effect size for each comparison.41,42 For 2-group postintervention comparisons, the effect size represents the difference between treatment and control groups’ means divided by the pooled SD, all from postintervention scores. For studies that provided pre- and postintervention data for both treatment and control subjects, a 2-group pre–post effect size was calculated as the treatment pre–post effect size minus the control pre–post effect size. Each of the treatment and control pre–post effect sizes is a single-group effect size calculated as the group’s difference between postintervention and preintervention means divided by its preintervention SD. A positive effect size represents a better mean for treatment subjects than for control subjects (for 2-group comparisons) or at postintervention than preintervention (for pre–post comparisons). Effect sizes were adjusted for bias. 41 We calculated single-group effect sizes for both treatment and control groups. Control group data were analyzed because possible changes could be useful for interpreting treatment pre-post comparisons. A given group’s preintervention and post-intervention insulin sensitivity scores probably are correlated. Primary study authors were contacted to request information about this correlation, but few provided it. We never combined single-group and 2-group effect sizes, which are reported separately in this article. Single-group effect sizes provide information to supplement the more valid 2-group findings.
To give more influence to larger sample studies, we weighted each effect size by the inverse of its sampling variance. Random-effects analyses were used to acknowledge that effect sizes vary due to subject-level sampling error and also from other sources of study-level variations, such as sample or intervention characteristics. 43 Ninety-five percent confidence intervals were constructed. Forest plots were developed to graphically depict findings. To facilitate interpretation, we converted effect sizes to the original metric of fasting insulin, the most common insulin sensitivity measure in the primary studies. 40
We detected outliers statistically by omitting each effect size one at a time and checking for substantially reduced measures of heterogeneity or large externally standardized residuals. Multiple approaches, including estimates of the number of omitted studies, tests of funnel-plot asymmetry, and selection function procedures were used to explore potential publication bias.44-48
Homogeneity was assessed with a conventional homogeneity statistic (Q). 49 We used I2, an index of between-studies heterogeneity relative to within-study sampling error, to assess the impact of (in)consistency among trials. Statistical and clinical heterogeneity is common in studies that are not virtual replications. 50 Heterogeneity was expected and handled in 4 ways.11,51 Heterogeneity was (a) taken into account using random-effects analyses, (b) quantified as estimates of between-studies variance and I2, (c) explored using moderator analyses, and (d) viewed as part of the context in which we interpreted results.
We conducted prespecified exploratory moderator analyses to determine if effect sizes were associated with primary study attributes. We examined behavioral target, exercise mode, and type of insulin sensitivity categorical moderators using a meta-analytic analogue of analysis of variance. A meta-analytic analogue of meta-regression was used for the continuous variables of baseline fasting insulin mean and SD scores, preintervention body mass index mean and SD scores, mean age, proportion female, exercise session duration, exercise session frequency, and the total minutes of supervise exercise. Each of these yields an estimate and test of the moderator effect (eg, difference between mean effect sizes, unstandardized regression slope).
Results
Comprehensive searching located 115 comparisons from 78 reports that included 2509 participants.52-129 Most studies were disseminated as published articles (s = 77; s denotes the number of reports, k indicates the number of comparisons); one dissertation was included. Recent studies were common, with 39 reports disseminated in 2000 or more recently. Most reports (s = 71) indicated some funding for the research.
The 2-group postintervention and 2-group pre–post intervention comparisons included 1100 participants (733 treatment, 367 control) subjects in 34 comparisons. Treatment pre–post comparisons included 2142 participants. Control pre–post comparisons included 367 participants.
Primary Study Characteristics and Quality Attributes
Primary study characteristics are presented in Table 1. Median sample size was 22 participants (range = 5-154). Participant attributes were inconsistently reported (Table 1). The median of mean age was 43 years. Only 14 of the 78 reports provided minority participation rates. The median proportion of females was 48%.
Characteristics of Primary Studies Included in Insulin Sensitivity Meta-Analyses. a

Abbreviations: k, number of studies providing data on characteristic; Q1, first quartile, Q3, third quartile.
Includes all studies that contributed to primary analyses at least one effect size for any type of comparison. Samples within studies were aggregated by summing sample sizes and using weighted mean of other characteristics (weighted by sample size).
Includes only comparisons with both treatment sample and comparison sample.
The median attrition was 18%. Thirty of the 34 two-group comparisons individually randomized participants to treatment and control groups. We excluded some potentially eligible comparisons because they used fasting glucose to measure insulin resistance (k = 42). The median of mean preintervention fasting insulin was 8 mU/L.
Not all studies provided adequate details about the intervention (Table 1). For example, only 68 reported the duration of exercise sessions. The median of mean minutes per supervised exercise session was 51 minutes. The median of mean session frequency was 3 sessions per week. The median of mean total number of supervised exercise sessions was 51.
Overall Effects of Interventions
Table 2 shows the effects of interventions on effect sizes. The mean effect size was 0.38 for 2-group postintervention comparisons and 0.43 for 2-group pre–post comparisons. Forest plots of 2-group postintervention comparisons and of 2-group pre–post comparisons are available in the electronic supplementary material. A mean effect size of 0.28 was documented for treatment pre–post comparisons. These effect sizes indicate that, on average, interventions did increase insulin sensitivity. In contrast, control subjects experienced a small decrease in insulin sensitivity, as evidenced by a mean effect size of −0.10.
Intervention Effect by Type of Comparison: Random-Effects Estimates and Tests. a
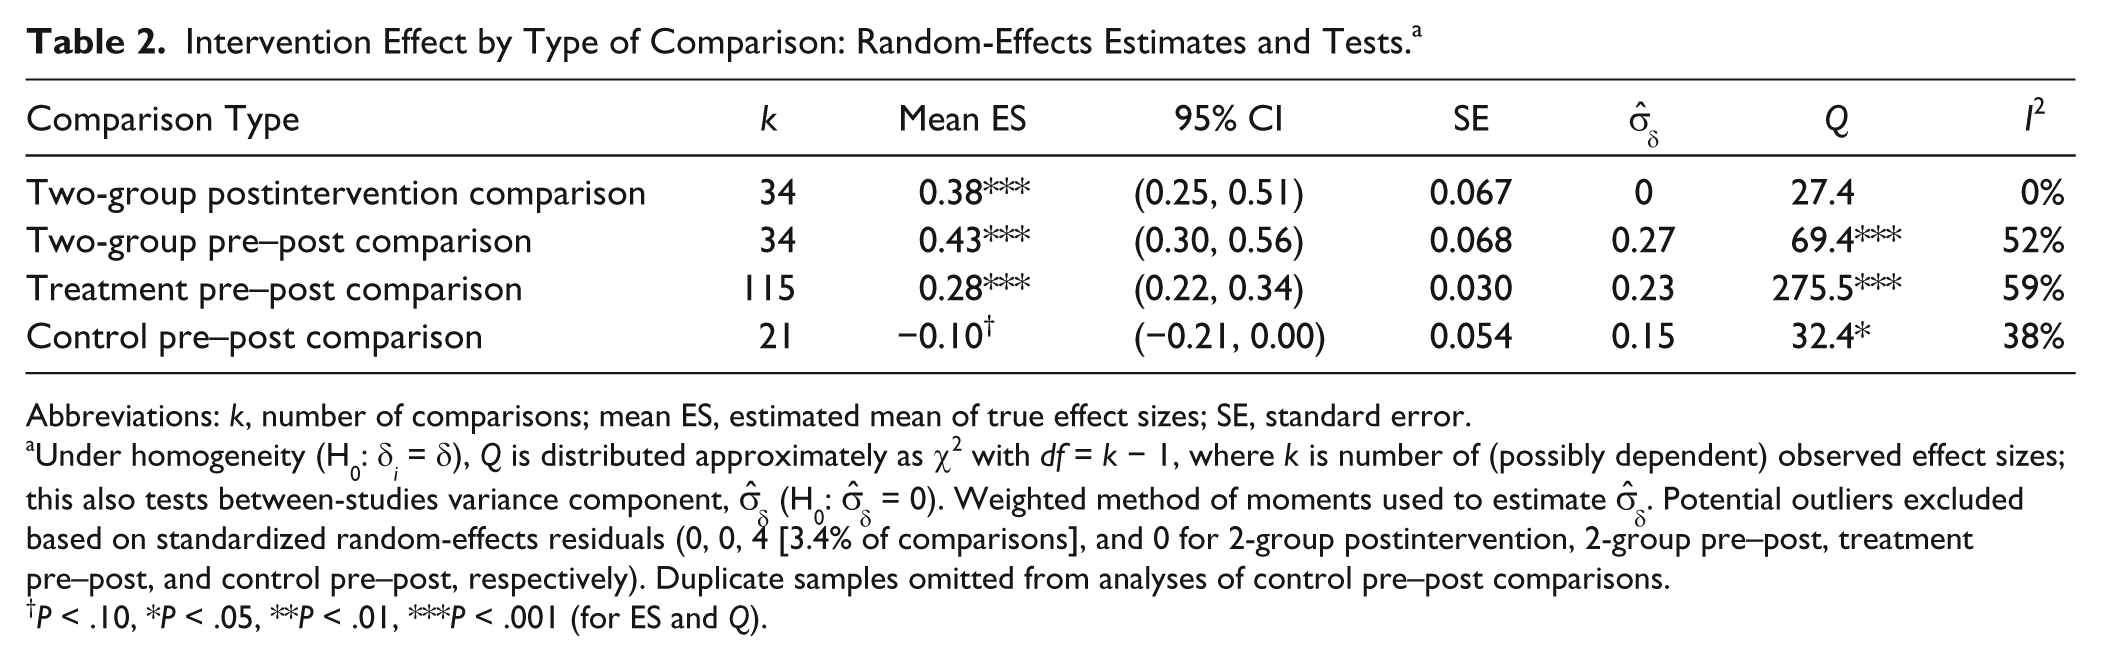
Abbreviations: k, number of comparisons; mean ES, estimated mean of true effect sizes; SE, standard error.
Under homogeneity (H0: δ
i
= δ), Q is distributed approximately as χ2 with df = k − 1, where k is number of (possibly dependent) observed effect sizes; this also tests between-studies variance component,
P < .10, *P < .05, **P < .01, ***P < .001 (for ES and Q).
To facilitate interpretation, we converted the summary effect size to a value of fasting insulin, which was the most commonly reported original metric: The 2-group postintervention mean effect size of 0.38 is consistent with treatment participants’ ending studies with a mean fasting insulin of 6.8 mU/L if controls end with 7.9 mU/L.
Findings from heterogeneity analyses (Q, I2, and estimate of between-studies variance) suggest variation in true effect sizes among studies included in 2-group pre–post, treatment pre–post, and control pre–post comparisons (Table 2). In particular, 2-group and treatment pre–post effect sizes exhibited substantial heterogeneity. Two-group postintervention effect sizes were not significantly heterogeneous and exhibited no between-studies variance. Evidence for or against publication bias was weak because of few studies for comparisons.
Exploratory Moderator Analyses
Exploratory moderator analyses addressed sample attributes and intervention characteristics. Tables reporting the moderator analyses are available from the corresponding author and in supplementary material. Some analyses contained few studies (ie, behavioral target, exercise mode, body mass index); findings for these moderators should be interpreted cautiously, as should findings for aggregate participant variables used as moderators.
130
The difference in mean effect size between interventions, including both aerobic and resistance exercise (effect size = 0.26, k = 4) and exclusively aerobic exercise (effect size = 0.44; k = 30) was not statistically significant. The 5 studies combining exercise and diet interventions (effect size = 0.51) did not have a statistically significantly larger mean effect size than the 29 studies exclusively targeting exercise (effect size = 0.39). Neither mean preintervention fasting insulin level (
Exercise dose variables (minutes/session [
An additional post hoc sensitivity analyses was conducted to explore if effect sizes varied between studies with fasting insulin and those with other insulin resistance measures. For a given type of comparison we conducted 2 separate random-effects analyses to obtain 2 estimates of the mean effect size: one for insulin resistance measures and another for fasting insulin measures. That permitted the between-studies variance to differ between measures but required estimating one more parameter than a conventional analysis of variance–type moderator analysis with a residual between-studies variance. We applied standard-normal procedures to those results to estimate and test the difference between the 2 measures’ mean effect sizes. Unfortunately, most studies measured fasting insulin (k = 27) so we had scant data for direct/indirect measures of insulin sensitivity (k = 7). Comparisons of effect sizes between the measures yielded inconsistent findings, which suggest a possible lower effect size for studies with fasting insulin measures in some analyses. Given the small sample size and these analyses were unplanned post hoc comparisons, the findings should be viewed as exploratory to prompt further research.
Discussion
Diabetes is a growing problem among primary care patients. Given the type 2 diabetes epidemic and the link between insulin resistance and diabetes, interventions that increase insulin sensitivity are important.131,132 This comprehensive meta-analysis documented moderate improvements (mean effect size 0.38 and 0.43) in insulin sensitivity among healthy adults after supervised exercise interventions. No previous meta-analyses have analyzed insulin sensitivity outcomes, so these findings cannot be directly compared with those from similar quantitative syntheses. Meta-analyses of supervised exercise interventions among adults with type 2 diabetes reported standardized mean difference effect sizes of 0.28 to 0.43 for HbA1c outcomes.11-13 The present findings add important new information about the magnitude of improvements in insulin sensitivity among healthy adults and go beyond previous meta-analyses that documented improved glycemic control among type 2 diabetes samples after exercise interventions.
The moderate improvement in insulin sensitivity among adults without insulin resistance is clinically significant for primary care. Low insulin levels, as have been documented in the people of Kitava in the Trobriand Islands of Papua New Guinea, might partly explain their relative absence of overweight, hypertension, and cardiovascular disease. Their fasting insulin levels, ranging from 3.4 to 3.9 IU/mL, are approximately half that of age-matched Swedes who already had overweight and borderline hypertension. 133 The benefit of decreasing insulin resistance as measured by fasting insulin is evident in its role of moving the patient back toward normal along the continuum ranging from normoglycemia to type 2 diabetes. There may be other benefit as well because increases of as little as 15 pmol/L (similar to 2.16 mU/L) have been associated with a 2-fold increase in the risk of coronary heart disease, which also gives context for the magnitude of the effect of exercise. 134 Moreover, the possibility of a modest decline in insulin sensitivity among healthy control subjects, even over these time-limited interventions, could be important. 131 The larger mean effect size for the 2-group pre–post (vs 2-group postintervention) comparison may partly reflect deterioration among control subjects over the study interval. Improved insulin sensitivity may partially account for reduced diabetes incidence following lifestyle changes.5,21,22,24 Exercise may affect multiple mechanisms to reduce insulin resistance.8,135 This study documented that exercise is a valuable primary care and community health strategy for healthy adults to improve insulin sensitivity and lower the risk for diabetes conferred by insulin resistance.
The results of the moderator analyses are exploratory. Given the homogeneity of the effect sizes, there was little heterogeneity for which to account. Also, in some analyses, low power due to few studies made detecting moderators’ effects difficult (eg, exercise mode, behavior target of exercise vs. exercise plus diet). Our findings that do not confirm the body of research that has demonstrated greater improvement in insulin sensitivity with high-intensity compared with moderate-intensity exercise, with endurance plus resistance training, and with exercise training that includes energy restriction were unexpected.9,135,136 Dose variation was unrelated to effect sizes, but most studies had similar minutes per session, sessions per week, and total number of sessions. Primary studies with greater variations in dose and studies which systematically vary components of dose would be useful. In the current analysis, the median frequency of 3 sessions per week may be insufficient to cause larger improvement in insulin sensitivity outcomes because the effect of exercise on insulin signaling in skeletal muscle is relatively short-lived, lasting up to 48 hours.135,137 Determining dose response will require intervention research that reaches or exceeds current U. S. physical activity guidelines (ie, at least 30 minutes of moderate-intensity aerobic activity on most, and preferably all, days of the week plus 2 or more days a week of muscle strengthening exercises). 138 Primary research examining outcomes over longer periods of regular exercise behavior would also help.
Identifying how participant characteristics relate to outcomes is a valuable component of meta-analyses. Our findings suggest that exercise interventions may be similarly effective across body mass index and preintervention fasting insulin variations, though O’Gorman and Krook 7 reported differing exercise training effects on resting fat oxidation among obese, type 2 diabetic, and lean populations. In our study, effects did not differ by mean age or gender proportion. As mentioned above, low power in some analyses as well as limited heterogeneity in exercise dose across interventions may have concealed true effect size differences. In addition, including only studies of healthy adults could account for this finding. Fasting insulin levels could be a significant modifier of effects by including studies of subjects with significant insulin resistance. Other characteristics, such as genetic factors and distribution of adiposity, likely influenced responsiveness of individual changes in insulin sensitivity to exercise.7-9 Future primary research should consistently report participant characteristics or report individual participant data so future moderator analyses can examine these sample attributes.
Limitations of primary studies can diminish confidence in findings and create challenges for meta-analyses. A persistent problem in synthesizing studies has been their inadequate reporting of intervention details, such as dose variables in this study. 139 Variations in measures used to assess insulin sensitivity are another limitation. Measurement of insulin varies among laboratories. 140 This meta-analysis used both fasting insulin and direct/indirect insulin sensitivity measures. The post hoc analysis, which suggested that effect sizes may be smaller in studies using fasting insulin levels, is preliminary and should not be considered confirmatory. The findings should encourage more careful investigation of this type of difference in well-designed primary studies. The cause of any difference in measures is unknown. It is possible the properties of the two measures make them react differently to exercise interventions. A feasible alternative is that any differences are partly an artifactual difference due to something like differential reliability (eg, if fasting insulin scores contain more measurement error “noise” than insulin resistance, that could increase the former’s SD, thereby decreasing its effect size). Measurement of insulin sensitivity instead of fasting insulin would be preferable in future research. Further primary studies which report both fasting insulin and direct/indirect measures of insulin sensitivity would be valuable.
This is the first meta-analysis to quantitatively synthesize findings of studies testing exercise interventions to improve insulin resistance. The focus on exercise interventions with verified exercise dose is valuable. Our searches were comprehensive. The exploratory moderator analyses provided the first attempt to identify systematic variations among studies. To better understand the meaning of the effects, we converted effect sizes to an original metric.
Overall, with regard to insulin sensitivity outcomes, the data we synthesized support the efficacy of exercise interventions. These findings document the importance of primary care and community health intervention to increase physical activity to decrease diabetes risk. Future research should examine greater variations in exercise form and dose to clarify the necessary form and dose to achieve important public health goals. Long-term follow-up studies are needed to trace the linkages among exercise behavior, insulin sensitivity, and development of diabetes.
Footnotes
Declaration of Conflicting Interests
The author(s) declared no potential conflicts of interest with respect to the research, authorship, and/or publication of this article.
Funding
The author(s) disclosed receipt of the following financial support for the research, authorship, and/or publication of this article: Financial support provided by a grant from the National Institutes of Health (R01NR009656) to Vicki Conn, principal investigator. The content is solely the responsibility of the authors and does not necessarily represent the official views of the National Institutes of Health.