
Abstract
Introduction
The number of Americans with a chronic disease is expected to reach 157 million within the next decade. Of those, nearly 52% have more than one chronic condition, and low-income individuals are disproportionately affected. Together, chronic disease accounts for nearly 80% of health care expenditures in the United States. 1 Combating the growing chronic disease epidemic to improve population health and reduce health care spending requires an increased focus on health promotion and disease prevention, 2 which is part of the “triple aim” established by the Institute for Healthcare Improvement and adopted by the Centers for Medicare and Medicaid Services. 3
Access to comprehensive, patient-centered primary care results in better health outcomes,4-6 but primary care, while necessary, is not sufficient for combating chronic disease given that the underlying causes of these conditions are most amenable to public health interventions.2,7,8 Moreover, primary care physicians lack adequate resources to provide proper management of these complex patients. 9 Therefore, a robust strategy to combat chronic disease and improve population health requires both primary care and public health efforts, and these efforts are likely to achieve better results when the 2 fields integrate, which the Institute of Medicine defines as “the linkage of programs and activities to promote overall efficiency and effectiveness and achieve gains in population health.” 10 Integrating primary care and public health has the potential to reduce the duplication of services, capitalize on the sharing of existing resources, and facilitate the sharing of data, which will lead to better health outcomes, lower costs, and reduced health disparities over time.1-3,11
Support of federally qualified health centers (FQHCs) by state public health agencies represents one potential mechanism for integrating primary care and public health to improve population health by combating chronic disease. FQHCs are an integral part of the health care safety net that serves our nation’s most medically underserved populations. Administered by the Federal Bureau of Primary Health Care, FQHCs are federally funded facilities legally mandated to provide primary care to all without regard for their ability to pay using an income-sensitive sliding fee scale. Consequently, FQHCs serve a low-income, often uninsured population with higher rates of chronic disease than the general population. 3 Currently, there are 1200 FQHC grantees nationwide providing care for approximately 20 million patients annually and demand for their services is expected to double under the Affordable Care Act. 12 FQHCs frequently lack the resources necessary to meet that demand on their own, making integration an attractive option. In particular, collaborative activities between state public health agencies and FQHCs may influence the delivery of primary care by FQHCs, leading to variations in health outcomes for certain chronic conditions.
There are a number of ways in which state public health agencies may provide support for FQHCs, which in turn might enable FQHCs to improve the quality and efficiency of care they provide to patients with chronic disease. 13 For instance, in some states, the public health agency provides financial support to FQHCs. These additional financial resources have the potential to increase FQHC capacity by permitting the hiring of a dedicated staff person to provide care management services, or simply hiring additional clinical staff to allow for more patients to be seen, and/or for more time to be spent seeing each patient. In other instances, public health agencies send and receive electronic health record data with FQHCs. This has the potential to help FQHCs identify high-risk patients, monitor performance, and respond accordingly. Successful evidence of state public health agencies supporting care management initiatives has been documented. 14 And in still other cases, public health agencies collaborate directly with FQHCs on specific shared projects. Similar to financial support, direct collaboration may also increase FQHC capacity. While small-scale demonstration projects have been able to document that such mechanisms can lead to improvement in both diabetes 15 and hypertension, 16 there is limited evidence to support the effectiveness of these and other similar efforts on a larger scale, and there is conflicting evidence, which finds that increased state agency support is actually associated with decreased efforts by local health departments to ensure access to care. 17
There is recent evidence that state public health agencies are highly engaged in supporting school-based health centers, 18 and that community health centers are becoming increasingly involved in integrated public health activities. 19 However, prior studies on the topic have been limited in a variety of ways, including a study with a response rate below 18%, 20 a single county case study, 21 and a case study of a small number of highly successful FQHCs unlikely to be representative of all FQHCs. 11 In each case, these limitations raise questions about the generalizability of the data. Our study addresses these limitations and gaps in the literature using nationally representative data with a high response rate to conduct quantitative analyses. To our knowledge, this is the first study to model variation in the quality of care for chronic disease at FQHCs as a function of state health agency support.
Methods
Data Sources and Key Measures
To investigate the relationship between chronic disease outcomes at FQHCs and state public health agency support of FQHCs, we merged data on state public health agencies from the 2010 Association of State and Territorial Health Officials (ASTHO) Public Health Survey with county-level data on primary care supply from the 2011 Area Resource File (ARF) and nationally comprehensive data on FQHCs from the 2010 Uniform Data System (UDS). The UDS contains the FIPS code for each FQHC grantee, which we used to merge in ARF data at the county level. Then, the 2-digit portion of the FIPS code was used to merge in the ASTHO data by state.
Our primary outcomes of interest, which come from the UDS data, are the proportion of an FQHC’s hypertensive patients whose blood pressure is controlled, and the proportion of an FQHC’s diabetic patients whose diabetes is controlled (HbA1c <7%). Our key explanatory variables are derived from the ASTHO data and include several measures of state health agency activity. In particular, our analyses include a variable indicating state health agency engagement with FQHCs and a variable indicating the transmittal of electronic health data between state health agencies and FQHCs. The first variable captures 3 dimensions of state health agency engagement: (a) exchanging information with FQHCs, (b) providing financial resources to FQHCs, and (c) working together with FQHCs on activities or projects. Only states that indicated that they engaged in all three activities were labeled as fully engaged. The second variable captures electronic health record exchange between state health agencies and FQHCs. This binary variable has a value of 1 only if a state health agency reports both receiving data from, and sending data to, FQHCs.
The initial analytic sample contained data on the 1331 FQHCs in operation across the 50 United States and the District of Columbia in 2010. We then excluded the 90 FQHCs without community health center funding (ie, FQHCs with migrant, homeless, and/or public housing health center funding only). Data on our outcomes of interest were missing for 6 FQHCs (HbA1c) and 8 FQHCs (hypertension). However, the results of 2 logistic regression models to predict the likelihood of missing data as a function of available nonmissing data were entirely insignificant, suggesting that there are no systematic differences between the few FQHCs with missing data and the rest of our sample. Therefore, we dropped these FQHCs from our sample and conducted complete case analyses. Our final sample size is 1235 for the diabetes model and 1233 for the hypertension model.
Analytic Strategy
First, we examined the pairwise correlation among all variables. The results indicated the existence of mild collinearity, with only 2 associations above 0.5, and all associations were as expected. Then, we estimated 2 different econometric models that explain variation in health outcomes for diabetic and hypertensive FQHC patients as a function of the state public health agency’s level of collaboration with FQHCs in the past year. The general equation estimated can be written as

where Yi represents 1 of 2 different FQHC-specific outcomes. Collaborate1 and Collaborate2 are binary variables each indicating different collaborative activities between the FQHC and the public health agency in the state where it is located. X is a matrix of county-specific control variables, α0 is a constant intercept, and ε i is an error term specific to each FQHC.
We modeled the following 2 outcomes for each FQHC:
Proportion of hypertensive patients with controlled hypertension (continuous)
Proportion of diabetic patients with controlled diabetes (HbA1c <7%) (continuous)
We estimated ordinary least squares regressions for both of these continuous outcomes. In both models, there are 2 key explanatory variables designed to capture collaborative efforts between the state public health agency and FQHCs in the state. Both variables are binary indicators of the following:
Whether the state agency exchanges information with FQHCs, works together on activities or projects with FQHCs, and provides financial resources to FQHCs
Whether the state agency sends and receives electronic health data to and from FQHCs
The coefficients β1 and β2 are the parameters we used to test our hypothesis that in states that collaborate with FQHCs, those FQHCs will have higher proportions of hypertensive and diabetic patients whose disease is well controlled. We conducted both t tests on the individual parameters and an F test on the joint construct represented by both parameters. In addition, we controlled for a variety of other factors expected to be correlated with our outcomes of interest using UDS and ARF data.
Using data from the UDS, we controlled for the amount of federal and nonfederal grant funding per patient at each FQHC and include a binary variable indicating whether an FQHC receives any grant funding under one of the non–community health center FQHC programs (ie, health care for the homeless, public housing, school-based health center, and migrant health center). Finally, we controlled for FQHC patient mix by gender, racial minority, income as a percentage of the federal poverty level, and insurance status.
Using data from the ARF, we controlled for the county supply of primary care physicians per capita, and midlevel providers per capita (including nurse practitioners, physician assistants, and advanced practice nurses). These variables were included to control for supply-side factors that have been associated with improved health outcomes. We also used the ARF to classify counties as metropolitan and nonmetropolitan using rural–urban continuum codes.
Results
Summary statistics are shown in Table 1. Across all FQHCs, the average proportion of hypertensive patients with controlled hypertension is nearly two thirds (63.4%), while fewer than half of diabetics (41.3%) have their disease well-controlled (HbA1c <7%). Slightly more than two thirds of FQHCs (67.1%) are located in states whose public health agencies are fully engaged in FQHC-supporting activities, while slightly more than one third of FQHCs (34.6%) are located in states whose public health agencies both send and receive electronic health record data with FQHCs.
Sample Summary Statistics.

Abbreviations: APRN, advanced practice registered nurse; CHC, community health center; EHR, electronic health record; FPL, federal poverty level; FQHC, federally qualified health center; NP, nurse practitioner; PA, physician assistant; SD, standard deviation; SHA, state health agency.
The results of the regression model for hypertension control are shown in Table 2. The model explained only 4.3% of the variation in our outcome of interest, suggesting that other factors, which we are unable to measure, are the most significant determinants of hypertension control. Chief among these is likely to be individual patient comorbidity and disease severity. Neither of our key explanatory variables was significant. In fact, the only 2 variables in our model that were significant are the proportion of patients who are racial minorities and the proportion of patients who are uninsured. For each 10 percentage point increase in each of these figures, the proportion of hypertensive patients with controlled disease decreases by 0.4 and 1.3 percentage points, respectively.
Results of Linear Regression of FQHC Hypertension Control. a
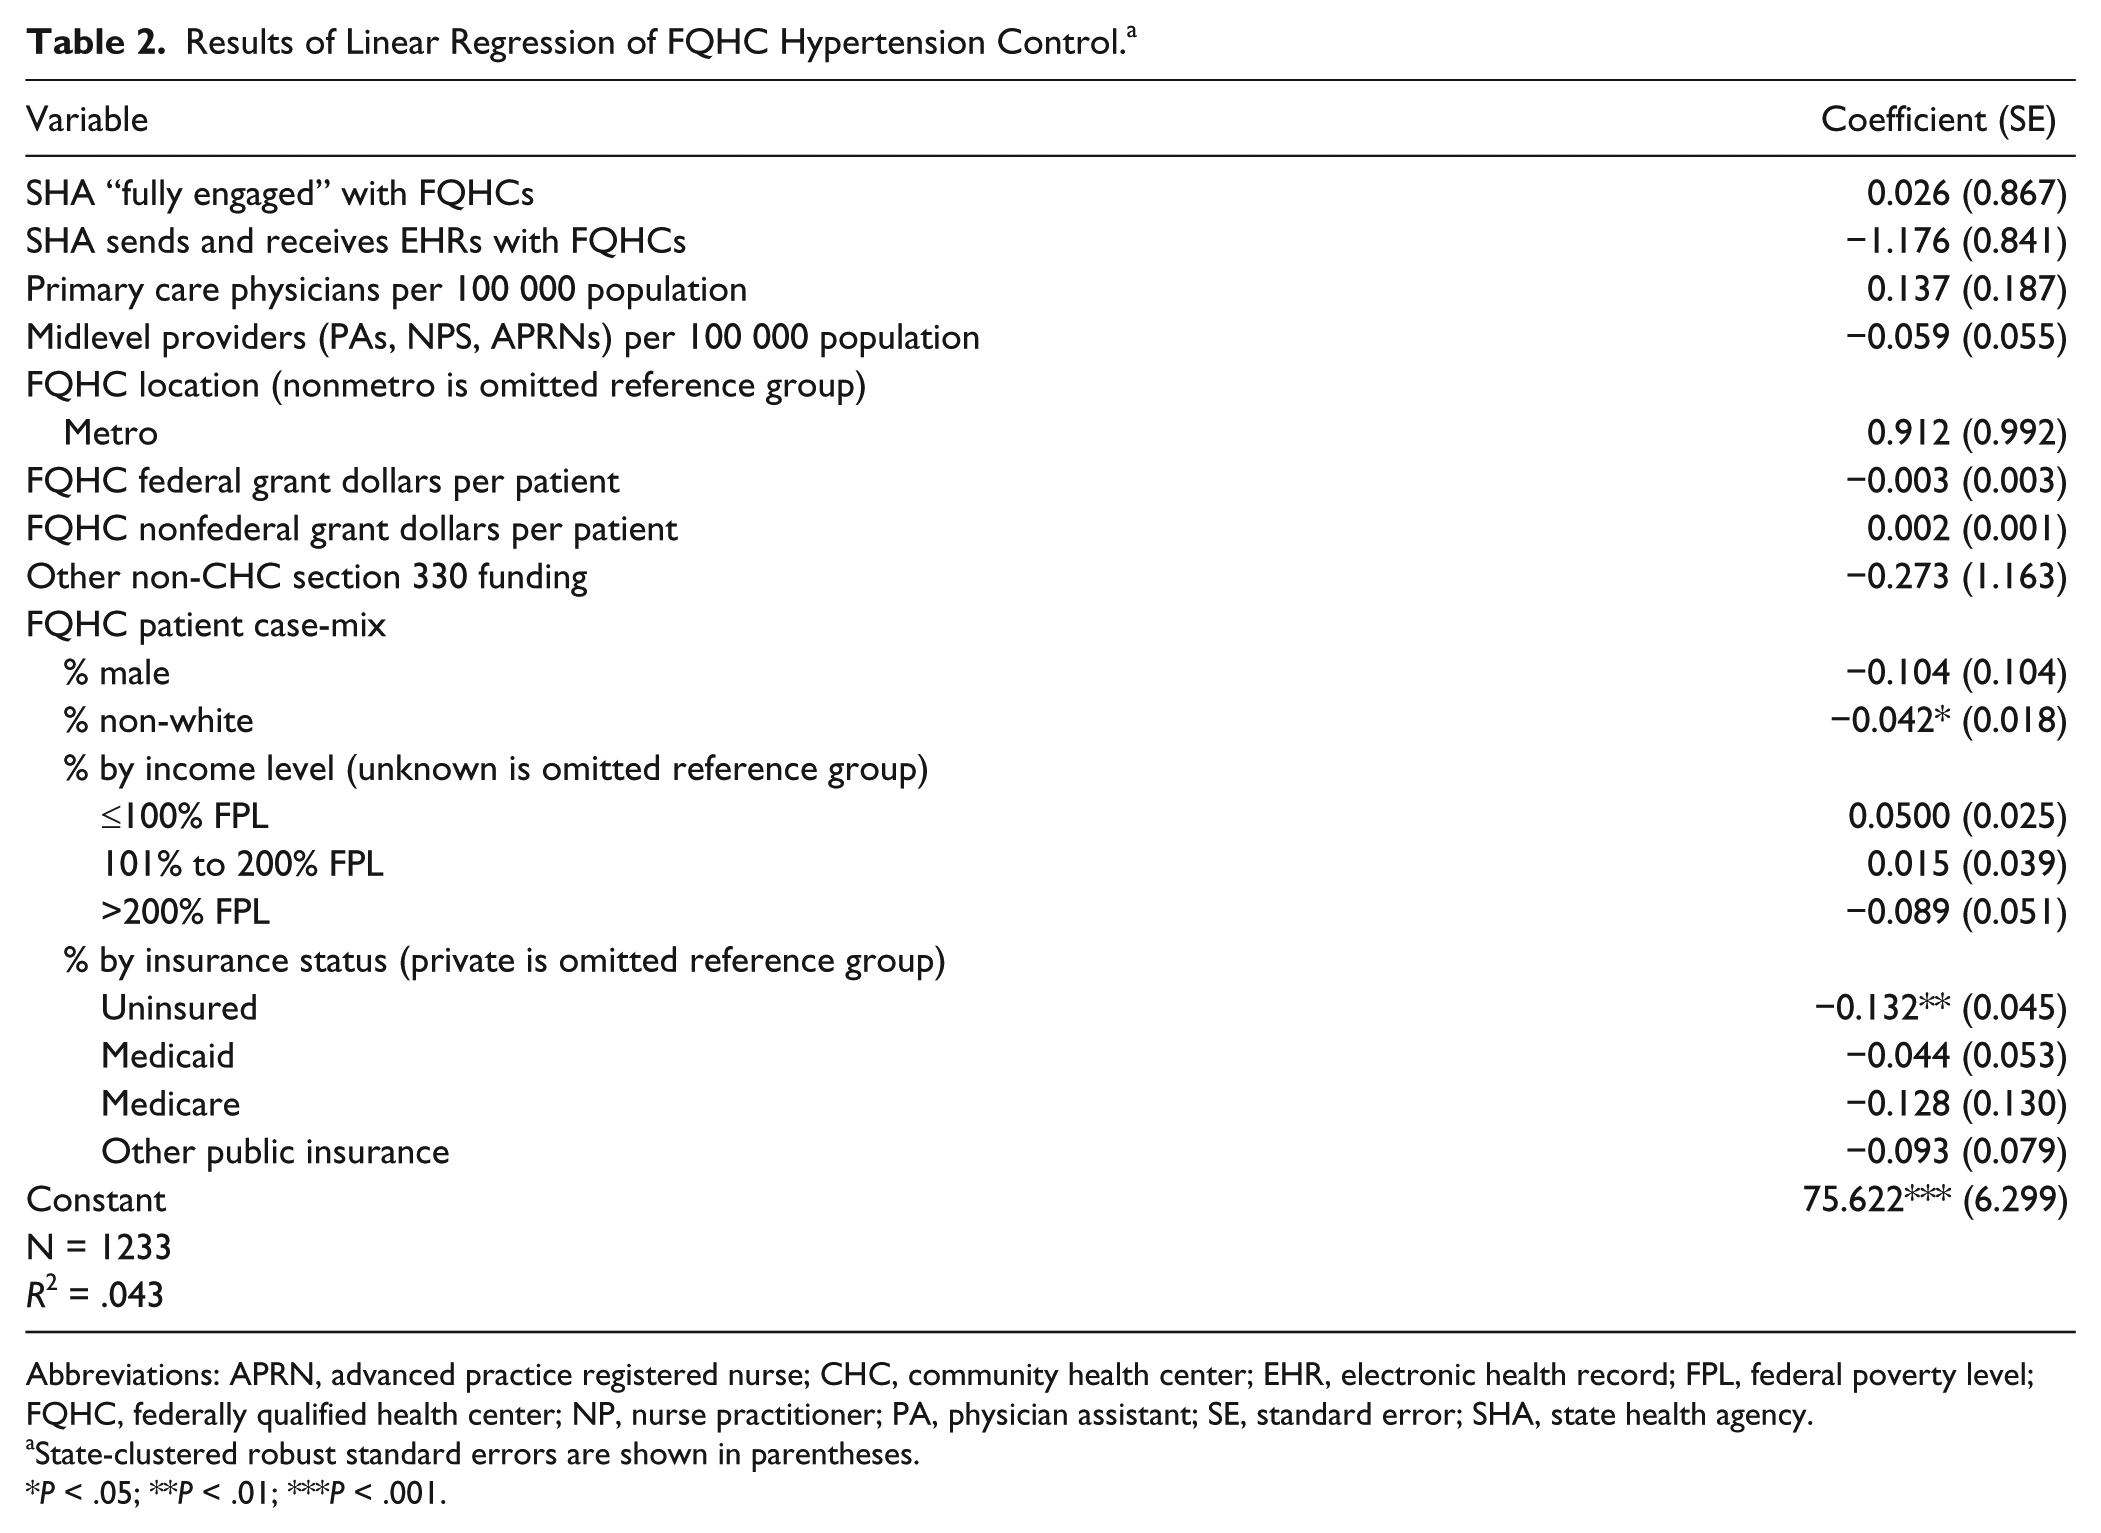
Abbreviations: APRN, advanced practice registered nurse; CHC, community health center; EHR, electronic health record; FPL, federal poverty level; FQHC, federally qualified health center; NP, nurse practitioner; PA, physician assistant; SE, standard error; SHA, state health agency.
State-clustered robust standard errors are shown in parentheses.
P < .05; **P < .01; ***P < .001.
The results of the regression model for diabetes control are shown in Table 3. This model was able to explain 18% of the variation in our outcome of interest. Again, neither of our key explanatory variables was significant. However, a number of other variables were significant, including: per capita supply of primary care physicians, the proportion of patients who are racial minorities, the proportion of patients who are uninsured, the proportion of patients who are enrolled in Medicare, and whether or not an FQHC has migrant, public housing, or health care for the homeless grant funding in addition to its community health center grant. Specifically, for every 10 additional primary care physicians per 100 000 population, diabetes control is expected to increase by 2.8 percentage points. Similar in magnitude, but opposite in direction, if an FQHC has other, non–community health center sources of section 330 grant funding, diabetes control is expected to decrease by 2.6 percentage points. A 10 percentage point increase in the proportion of patients who are racial minorities or uninsured is associated with an 0.39 or 1.1 percentage point decrease in diabetes control, respectively. By contrast, a 10 percentage point increase in the proportion of patients enrolled in Medicare is associated with a 3.8 percentage point increase in diabetes control.
Results of Linear Regression of FQHC Diabetes Control. a

Abbreviations: APRN, advanced practice registered nurse; CHC, community health center; EHR, electronic health record; FPL, federal poverty level; FQHC, federally qualified health center; NP, nurse practitioner; PA, physician assistant; SE, standard error; SHA, state health agency.
State-clustered robust standard errors are shown in parentheses.
P < .05; **P < .01; ***P < .001.
Discussion
The implementation of the Affordable Care Act (ACA) provides several opportunities to support the integration of primary care and public health, including a substantial increase in funding for FQHCs and a shift toward paying for value in health care.10,22 However, the results of our current study fail to provide any evidence that state public health agency support of FQHCs has any effect on chronic disease outcomes for FQHC patients. We recognize that the lack of significant findings may be attributed to the limitations inherent in our data. For example, the data do not permit us to measure state health agency support of specific FQHCs. If, in a state with 100 FQHCs, the state is fully engaged and sends and receives electronic health record data with a single FQHC, it would have a value of “1” for both key explanatory variables in the model, while 99% of the FQHCs in that state would not benefit from those activities. Therefore, it is impossible to conclude from our results that state support of FQHCs has no effect at the specific center level. To minimize this limitation, we do include nonfederal funding in the model to capture state support of specific FQHCs, and this variable is insignificant in all models. Thus, our results do suggest that either state support is not widespread across FQHCs within states or that state levels of support are simply not large enough to affect outcomes.
The 2 factors that were significant in both models were the proportion of racial minority patients and the proportion of uninsured patients. Both minority status and the lack of insurance are likely to be correlated with health status. It is likely that sicker patients will have a more difficult time achieving successful control of their hypertension and/or diabetes. Consequently, FQHCs with a greater proportion of such high acuity patients are likely to have worse chronic disease outcomes. However, our data do not permit us to risk-adjust based on individual patient health. While a strategy for increasing the proportion of racial majority patients at health centers makes little sense, it is worth considering how implementation of the ACA may affect the proportion of uninsured patients at FQHCs and what this might mean for chronic disease outcomes.
There are 2 primary ways in which the ACA aims to expand insurance coverage: implementation of private Health Insurance Exchanges and the expansion of Medicaid to all individuals at or below 138% of the federal poverty level. It is important to note that access to insurance coverage—through a state, federal, or state–federal partnership exchange—will be available to everyone, although this coverage may or may not be subsidized depending on other factors. In contrast, the Medicaid expansion was made optional by the Supreme Court’s ruling in National Federation of Independent Business v. Sebelius. To date, 21 states have opted not to expand the Medicaid program. 23 Consequently, the proportion of uninsured persons gaining coverage in these states will be much lower than it will be in those states that have elected to participate in the expansion.
As part of their mission, FQHCs provide a significant amount of care to the uninsured population. As insurance coverage increases, FQHCs stand to gain or lose significantly. If uninsured individuals continue to seek care at the FQHC even after they gain coverage, the proportion of patients cared for by FQHCs who are uninsured will decrease, and FQHCs will benefit from the injection of new sources of revenue. Moreover, in light of our findings, this should have a positive effect on hypertension and diabetes control among the FQHC patient population.
By contrast, if uninsured individuals stop seeking care at the FQHC and go elsewhere after they gain coverage, the proportion of patients cared for by FQHCs who are uninsured will increase, and FQHCs will find their capacity to offset the costs of uncompensated care significantly diminished. Consequently, given our findings, this is likely to have a negative effect on hypertension and diabetes control among the FHQC patient population. Ultimately, the impact of the ACA on chronic disease outcomes at FQHCs is likely to be driven both by the state in which the FQHC is located, and the care-seeking behavior of uninsured individuals who gain insurance coverage.
Our model of diabetes control also found that the per capita supply of primary care physicians in the county where the FQHC was located was positively associated with diabetes control. Although our data are not able to distinguish among primary care physicians employed by the FQHC and those practicing in other settings within the county, it is clear that efforts to increase primary care physician supply should have a positive effect on diabetes control. In the ACA, such efforts to incentivize primary care include the advent of teaching health centers, increased Medicaid reimbursement rates for primary care, and additional funding for both FQHCs and the National Health Service Corps. What is less clear is why primary care physician supply appears to have no effect on hypertension control.
Finally, it is striking that FQHCs that receive other section 330 funding in addition to their health center grant (ie, migrant, homeless, and public housing grantees) have, on average, lower rates of diabetic control. While we suspect that this may simply reflect that individuals served by these grantees are sicker, face greater obstacles to routine primary care access, or are less compliant with treatment plans, it is also possible that FQHCs with these programs face additional capacity constraints associated with their program activities.
While we remained convinced that there is significant unrealized potential for states, and even counties, to make important investments in their local FQHCs, we lack the data to support this position empirically. Further research is needed to examine the effects of the ACA—and the Medicaid expansion in particular—on chronic disease outcomes at FQHCs. Further research is also needed to examine specific collaborative efforts between state public health agencies and individual FQHCs to determine whether, and to what extent, FQHCs and their patients benefit from collaborating with the public health agency in their state.
Footnotes
Declaration of Conflicting Interests
The author(s) declared no potential conflicts of interest with respect to the research, authorship, and/or publication of this article.
Funding
The author(s) disclosed receipt of the following financial support for the research, authorship, and/or publication of this article: Support for this work was provided by a 2013 New Investigator Award provided by the University of Iowa College of Public Health.