
Abstract
Background:
The COVID-19 pandemic disrupted primary care and chronic disease management in the U.S., potentially affecting hypertension control differently across populations, particularly in patients with limited healthcare access. This study examined state-level patterns in uncontrolled hypertension among Federally Qualified Health Center (FQHC) patients during and after the pandemic.
Methods:
Using 2019 to 2022 Uniform Data System data, we analyzed state-level trends in uncontrolled hypertension rates among FQHC patients. Group-based trajectory modeling was applied to identify patterns across states for all patients and separately by race and ethnicity. We examined associations between trajectory groups and state-level COVID-19 mortality rates.
Results:
Four trajectory groups emerged for all races combined; the least favorable group (Group 4) included 5 states with consistently high uncontrolled hypertension rates. Among non-Hispanic Black patients, 24 states fell into the least favorable trajectory group. Most trajectory groups demonstrated recovery toward pre-pandemic levels by 2022, with mortality rates declining to 48.7 to 78.4 per 100,000 across groups.
Conclusions:
Although hypertension control largely rebounded to pre-pandemic levels by 2022, differences persisted across geographic and racial groups. Patients living in states with the least favorable trends may benefit from targeted strategies to enhance hypertension management. These findings highlight the critical need to sustain chronic disease care during public health crises and to address health outcomes driven by structural factors.
Keywords
Background
The COVID-19 pandemic profoundly disrupted primary care in the U.S., with in-person visits declining by as much as 60% in early 2020. 1 While telehealth partially bridged this gap, 2 chronic disease management was significantly impacted, particularly for conditions requiring regular monitoring like hypertension.3,4 Prior to the pandemic, approximately 45% of U.S. adults with hypertension had uncontrolled blood pressure, with markedly higher rates among non-Hispanic Black adults (54%) compared to non-Hispanic White adults (36%). 5 These pre-existing differences were exacerbated during the pandemic through multiple documented mechanisms: delayed preventive care, 6 reduced medication adherence, 7 and decreased access to blood pressure monitoring. 8
Federally Qualified Health Centers (FQHCs) play a critical role in delivering healthcare to low-income, uninsured, and underinsured populations, ensuring access to essential services for those most in need. In 2023, FQHCs served over 31 million patients, with 90% having incomes at or below 200% of the federal poverty level. Additionally, 40% of these patients identified as Hispanic, 17% as Black, and 4% as Asian, highlighting the array of population groups receiving care at these centers. 9 FQHCs have demonstrated success in reducing differences in health outcomes across patient populations and improving hypertension control among underserved populations. 10 However, these healthcare safety net providers faced unprecedented challenges during the pandemic. In a study based on 1037 FQHCs, almost all quality measures declined from 2019 to 2020 and most of them remained below pre-pandemic levels as of 2021; most FQHC visit types declined in 2020, while mental health and substance use visits increased in both 2020 and 2021. 11 This evidence indicates that FQHCs need sustained federal funding to expand service capacity, staffing, and patient outreach to adapt to the pandemic’s influence.
This study employed group-based trajectory modeling (GBTM), an established method for analyzing longitudinal patterns in health outcomes, 12 to examine state-level trends in uncontrolled hypertension among FQHC patients from 2019 through 2022. GBTM incorporates information from all time points and allows for examination of nonlinear (quadratic, cubic, and higher order) rate trends. GBTM has been successfully applied to chronic disease surveillance 13 and research about differences in health outcomes, 14 but has not previously been used to analyze state-level patterns of pandemic impacts on hypertension control. By utilizing data from the Health Center Program Uniform Data System (UDS), we sought to identify distinct trajectory patterns in uncontrolled hypertension across states, providing novel insights into geographic and key demographic patterns of pandemic impacts on hypertension control during the period before and during the pandemic. We then examined the association between uncontrolled hypertension trajectories and COVID-19 mortality rates in order to determine if states hit harder by the pandemic had worse rate patterns of uncontrolled hypertension.
Methods
Each calendar year, Federally Qualified Health Centers (FQHCs) are required to report a core set of information, including data on patient characteristics and health outcomes, as part of a standardized reporting system known as the Health Center Program Uniform Data System (UDS). We obtained FQHC-level data from the UDS for the years 2019 to 2022. The FQHC-level data were then aggregated to the state level.
The primary outcome was the prevalence of uncontrolled hypertension, defined as the percentage of patients with at least 1 visit during the calendar year whose most recent blood pressure was ≥140/90 mm Hg. Patients seen during the year without a documented measurement were also classified as uncontrolled. State-level prevalence was calculated for 6 groups: (1) all races combined, (2) non-Hispanic Black, (3) non-Hispanic White, (4) Hispanic, (5) Asian/Pacific Islander, and (6) American Indian/Alaska Native.
We sought to group and examine common trends in state-level percentages of uncontrolled hypertension for each of the racial groups. We used the Proc Traj procedure in SAS to conduct group-based trajectory modeling (GBTM) of state-level uncontrolled hypertension prevalence from 2019 to 2022, classifying states into groups with distinct temporal trends (see reference for details). 12 GBTM was performed for each of the 6 racial groups. Trajectory groups ranged from 1 to 3 or 4, where group 1 had the most favorable trajectory (lower percentages of uncontrolled hypertension), and the highest group had the least favorable trajectory (higher percentages of uncontrolled hypertension). The number of groups for each GBTM was determined primarily using the Bayesian Information Criterion (BIC). We first estimated a quadratic model with prevalence of uncontrolled hypertension as the dependent variable and time in years as the independent variable, beginning with a single group. We then incrementally increased the number of groups, evaluating model fit via BIC and ensuring each group included at least 3 states.
For the GBTM results of each racial group, we created a choropleth map of the trajectory groups of U.S. states using ArcGIS (Esri, Redland, CA), and we plotted the predicted trajectories of the percentage of uncontrolled hypertension identified by GBTM.
We obtained COVID-19 death data and total population counts from USA Facts, 15 and calculated state-level yearly COVID death rates for the years 2020, 2021, and 2022. The yearly COVID death rate was defined as the number of deaths due to COVID-19 during the calendar year per 100,000 people. Then, means and standard deviations of the yearly COVID death rates (based on all races) were calculated and reported by trajectory groups. We conducted analyses of variance to compare yearly COVID death rates by trajectory groups, and Tukey post hoc tests were used for pairwise comparisons. SAS, version 9.4, was used to perform all analyses.
Results
Overall, the trajectory patterns of uncontrolled hypertension were similar for all races from 2019 to 2022. Most states showed an increase during the pandemic (2019-2021), followed by a recovery to near pre-pandemic levels in 2022.
For the all-race population, 4 trajectory groups were identified (Figure 1). The trajectories were roughly parallel, sharing a trend that rates of uncontrolled hypertension first increased from 2019 to 2020 and then decreased from 2021 to 2022. Most states fell in groups 2 and 3; group 4, the least favorable group, contained 5 states (Mississippi, Wyoming, Alabama, Delaware, and Alaska; Figure 2). The highest yearly COVID-19 death rate was observed for group 3 in 2020 (mean = 120.4, SD = 53.7), group 4 in 2021 (mean = 191.8, SD = 53.0), and group 4 in 2022 (mean = 78.4, SD = 13.0), respectively (Table 1).

Trajectories of %uncontrolled hypertension among FQHC patients by racial groups, 2019 to 2022.
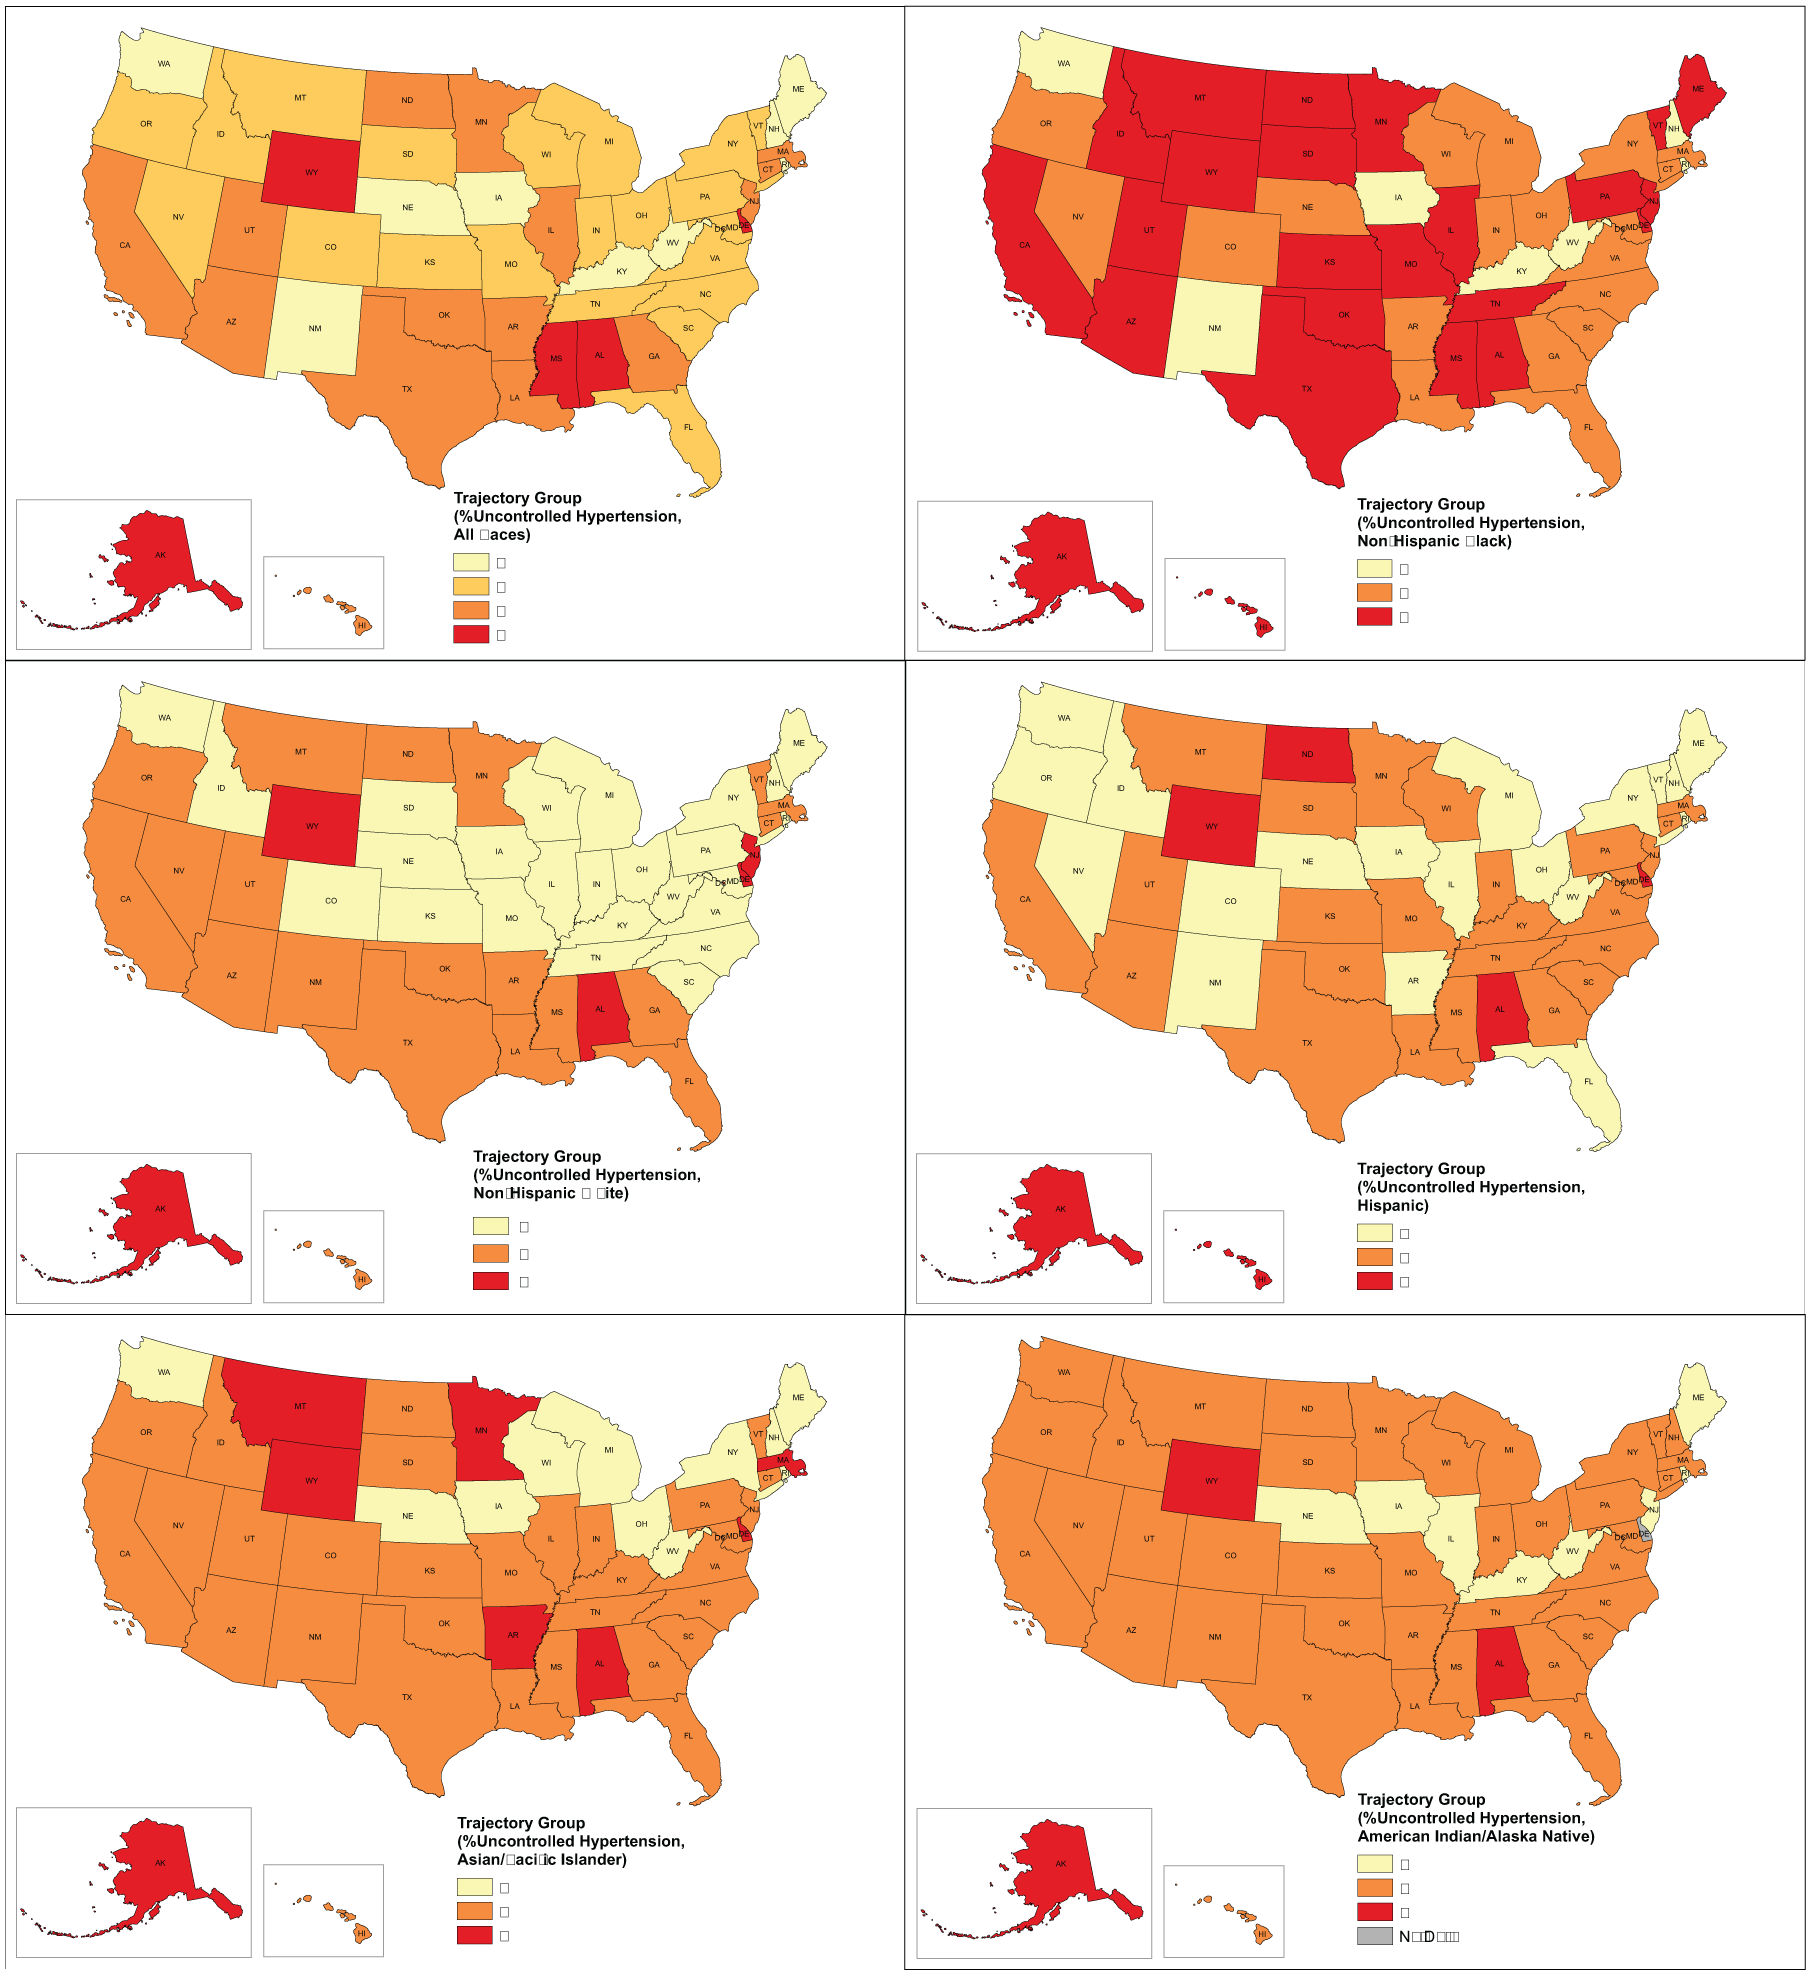
Geographic distribution of trajectory groups of %uncontrolled hypertension by racial groups, 2019 to 2022.
Yearly COVID Deaths per 100,000 Population by Trajectory Groups of %Uncontrolled Hypertension (All Races), 2020 to 2022.

Within each year, analysis of variance was conducted to compare yearly COVID death rates by trajectory groups; Tukey post hoc tests did not find comparison of any 2 groups to be significant.
For the non-Hispanic Black population, non-Hispanic White population, and the Hispanic population, 3 roughly parallel trajectory groups were identified, showing an increase in uncontrolled hypertension from 2019 to 2020 and followed by a decrease from 2021 to 2022 (Figure 1).
For the non-Hispanic Black population, the least favorable group, group 3, contained 24 states (Figure 2). The highest yearly COVID-19 death rate was observed for group 2 in 2020 (mean = 111.4, SD = 36.0), group 3 in 2021 (mean = 145.5, SD = 57.2), and group 1 in 2022 (mean = 98.8, SD = 34.6), respectively (Table 2).
Yearly COVID Deaths per 100,000 Population by Trajectory Groups of %Uncontrolled Hypertension (Non-Hispanic Black), 2020 to 2022.

Within each year, analysis of variance was conducted to compare yearly COVID death rates by trajectory groups; Tukey post hoc tests did not find comparison of any 2 groups to be significant.
For the non-Hispanic White population, Group 1 contained 25 states, while group 3 contained 6 (Figure 2). The highest yearly COVID-19 death rate was observed for group 2 in 2020 (mean = 104.2, SD = 50.8), group 3 in 2021 (mean = 156.8, SD = 74.1), and group 3 in 2022 (mean = 70.9, SD = 48.7), respectively (Table 3).
Yearly COVID Deaths Per 100,000 Population by Trajectory Groups of %Uncontrolled Hypertension (Non-Hispanic White), 2020 to 2022.
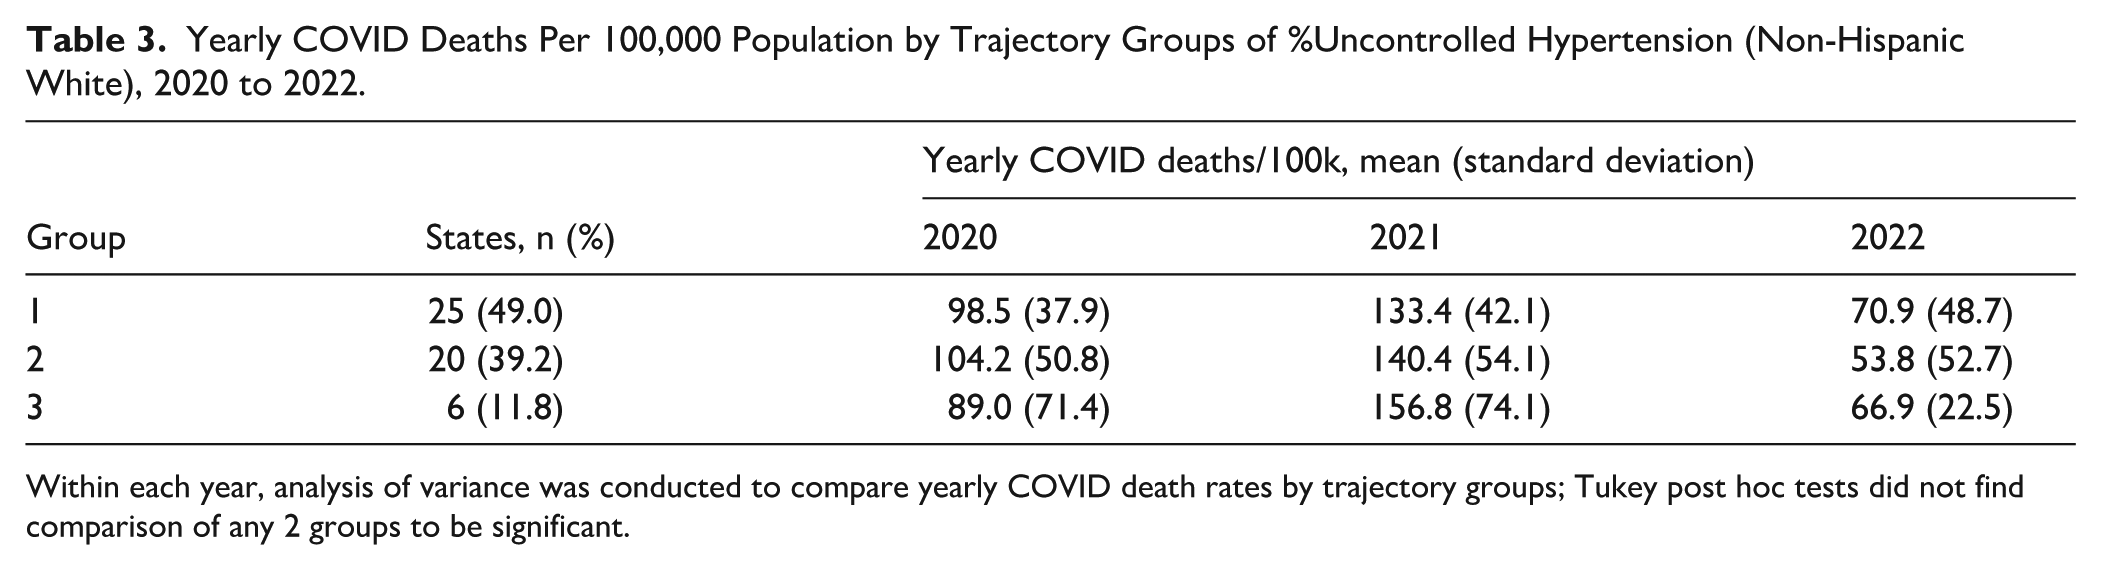
Within each year, analysis of variance was conducted to compare yearly COVID death rates by trajectory groups; Tukey post hoc tests did not find comparison of any 2 groups to be significant.
For the Hispanic population, the least favorable group, group 3, contained 6 states (Figure 2). The highest yearly COVID-19 death rate was observed for group 2 in 2020 (mean = 110.4, SD = 42.7), group 3 in 2021 (mean = 151.5, SD = 79.4), and group 2 in 2022 (mean = 64.6, SD = 25.0), respectively (Table 4).
Yearly COVID Deaths per 100,000 Population by Trajectory Groups of %Uncontrolled Hypertension (Hispanic), 2020 to 2022.

Within each year, analysis of variance was conducted to compare yearly COVID death rates by trajectory groups; Tukey post hoc tests did not find comparison of any 2 groups to be significant.
For the Asian/Pacific Islander population and the American Indian/Alaska Native population, 3 trajectory groups were identified (Figure 1). Groups 1 and 2 showed roughly parallel trajectories, with uncontrolled hypertension rising from 2019 to 2020 and declining from 2021 to 2022, while group 3 remained consistently higher throughout the study period.
For the Asian/Pacific Islander population, Group 2 contained 32 states, and group 3 contained 8 states (Alabama, Delaware, Wyoming, Arkansas, Massachusetts, Montana, Minnesota, and Alaska; Figure 2). The highest yearly COVID-19 death rate was observed for group 2 in 2020 (mean = 102.7, SD = 45.9), group 3 in 2021 (mean = 163.3, SD = 58.2), and group 1 in 2022 (mean = 79.0, SD = 65.0), respectively (Table 5).
Yearly COVID Deaths per 100,000 Population by Trajectory Groups of %Uncontrolled Hypertension (Asian/Pacific Islander), 2020 to 2022.

Within each year, analysis of variance was conducted to compare yearly COVID death rates by trajectory groups; Tukey post hoc tests did not find comparison of any 2 groups to be significant.
For the American Indian/Alaska Native population, Group 2 contained 39 states, and group 3 contained 3 states (Figure 2). The highest yearly COVID-19 death rate was observed for group 1 in 2020 (mean = 116.3, SD = 62.4), group 3 in 2021 (mean = 179.3, SD = 68.2), and group 3 in 2022 (mean = 72.9, SD = 14.8), respectively (Table 6).
Yearly COVID Deaths per 100,000 Population by Trajectory Groups of %Uncontrolled Hypertension (American Indian/Alaska Native), 2020 to 2022.

Data for 1 state was suppressed due to the small number of patients with uncontrolled hypertension. Within each year, analysis of variance was conducted to compare yearly COVID death rates by trajectory groups; Tukey post hoc tests did not find comparison of any 2 groups to be significant.
Though most trajectory groups shared a similar pattern, the differences between the groups remained similar over time. For non-Hispanic Black patients, 24 states (47.1%) were in the least favored trajectory group which was a much higher percentage of the population than for other races (non-Hispanic White: 6 states, 11.8%; Hispanic, 6 states, 11.8%; Asian/Pacific Islander, 8 states, 15.7%; American Indian/Alaska Native, 3 states, 6.0%). For each racial population, Tukey post hoc tests showed no significant differences in COVID-19 death rates between any trajectory groups within each year. Although there were no significant correlations between COVID-19 death rates and trajectory group membership, the least favorable group (group 3) consistently had the highest death rates in 2021, indicating the possible association between the pandemic and the control of hypertension.
Discussion
In this study, we applied group-based trajectory modeling to identify groups of U.S. states with similar trends of uncontrolled hypertension rates among FQHC patients. From 2019 to 2022, we identified 4 distinct trajectory groups for patients of all races, and 3 trajectory groups for patients in each racial and ethnic group. Most groups experienced an increase in the uncontrolled hypertension rate during the COVID-19 pandemic, followed by a return to near pre-pandemic levels from 2021 to 2022. The differences between the trajectory groups remained considerable during the study period. For each race/ethnicity, we identified and listed the states in the least favored trajectory group, which maintained a higher uncontrolled hypertension rate than other trajectory groups. The patterns of uncontrolled hypertension trajectories observed from 2019 to 2022 reveal critical insights into public health dynamics during and after the COVID-19 pandemic. Our findings align with previous studies highlighting the pandemic’s impact on chronic disease management, particularly hypertension.
The increase in uncontrolled hypertension during the COVID-19 pandemic aligns with findings of previous studies that documented disruptions in healthcare access and routine medical care during this period. Several studies concluded that the pandemic led to care disruptions, including reduced blood pressure monitoring and missed follow-ups, which disproportionately impacted Black Americans and low-income populations, worsening hypertension control.6,16-18 Many healthcare systems were overwhelmed by the rapid surge in COVID-19 cases and deaths, leading to reduced availability of non-urgent care, including routine blood pressure monitoring and management. The situation was aggravated by the patients’ reluctance to visit healthcare facilities due to fear of exposure to COVID-19, unintended consequences of public health recommendations to minimize non-urgent health care and stay-at-home orders. 19
We did not observe a significant correlation between COVID-19 death rates and the trajectory group membership for any of the racial subgroups. However, the least favorable trajectory group always had the highest COVID-19 death rates in 2021, indicating a possible association between the pandemic and the control of hypertension. In a previous study based on 3 large health systems in California, Louisiana, and New York, the first 8 months of the pandemic were associated with worsening blood pressure outcomes among individuals with hypertension, including the number of blood pressure measurements, average systolic and diastolic pressures, and the proportion of patients with controlled blood pressure. 17 Another study that analyzed data from over 464,000 U.S. employees found significant increases in blood pressure during the pandemic, with greater differences among female and elderly individuals due to reduced healthcare access and socioeconomic stressors. 20
For the country as a whole (all races/ethnicities), there was not a great deal of geographic clustering of either the best or worst rate trajectory group. Iowa, Kentucky, Nebraska, New Hampshire, New Mexico, Maine, Oregon, and West Virginia were in the low-rate trajectory group; Alabama, Alaska, Delaware, Mississippi, and Wyoming were in the high-rate trajectory group for all races/ethnicities combined. However, only Iowa and West Virginia were in the low-rate group for all races/ethnicities separately. Alabama, Alaska, Delaware (no data for AI/AN), and Wyoming were in the high-rate group for all races/ethnicities separately. There was considerable variability at the state level, which was evidenced by the fact that most states were in the least favorable group (high-rate) on the NH-Black map, while the majority of states were in the most favorable group (low-rate) on the NH-White map. The FQHCs in the states that had low rates for all races/ethnicities separately should be studied further for best practices for achieving hypertension control across all communities.
Our study used a novel approach to monitor trends in uncontrolled hypertension rates among FQHC patients from the pre-pandemic to the post-pandemic periods. The nearly full return to pre-pandemic levels of hypertension control in FQHCs can be explained by some systemic and policy-driven efforts: (1) rapid expansion of telehealth and hybrid care models that improved access to monitoring and follow-ups, reducing care gaps, (2) partnerships with mail-order pharmacies and remote blood pressure monitoring, (3) Federal relief funding that enabled extended hours and subsidized care, and (4) reduced pandemic stressors allowed patients to refocus on chronic disease management.18,21-23 Studies based on other cohorts also reported recovery after the pandemic but were not able to document the full recovery of the rate after 2021. Among patients with severe uncontrolled hypertension identified via electronic health records in Massachusetts, blood pressure measurement rate declined from 40.0% in January 2020 to 4.5% in April 2020 and was still 23.5 percentage points below the baseline as of March 2021. 24 In a study based on 11 community health centers in the U.S., the percentage of patients with hypertension that did not have documented blood pressure measurement was 0.5% in December 2019, then increased to 27.2% by March 2021, and slowly retrieved to 15.2% by October 2021. 18
Our study has several limitations. In GBTM, states were assigned to a trajectory group if they had greater than 50% probability of membership, which may have led to misclassification, potentially placing a state in a higher or lower trajectory than reported. Moreover, the uncontrolled hypertension measure in UDS data was reported annually, limiting our ability to analyze the trajectories based on shorter periods. Ideally, monthly data would give more detailed trend dynamics and allow for comparison with monthly data, which we plan to explore in the future. Due to substantial missingness in race/ethnicity reporting for COVID-19 data, we chose to compare the all-race COVID-19 death rate by trajectory groups instead of the race-specific death rates. The all-race COVID-19 death rate might not fully reflect the impact of COVID-19 on each race/ethnicity group. UDS classifies patients without a documented blood pressure measurement as uncontrolled, potentially inflating prevalence estimates. This misclassification may disproportionately affect certain groups, such as patients with reduced healthcare access, and may partly explain the differences observed across states or racial and ethnic groups. Caution is warranted in interpreting the absolute prevalence of uncontrolled hypertension. Additionally, we did not observe statistically significant differences in mortality rates across trajectory groups. Although descriptive patterns suggested some variation, these results should be interpreted with caution, and no causal relationship can be inferred. Lastly, state-level analyses may obscure important variation within states or across individual FQHCs. Differences in hypertension control could exist at the county or facility levels that are not captured by state-level averages. Future research using facility-level or more granular geographic data could help identify these within-state variations and better inform targeted interventions.
Due to rapidly changing federal healthcare policies, especially those related to Medicaid eligibility, reimbursement, and the health center program, strategies to sustain and expand chronic disease management initiatives, even in times of uncertainty, are urgently needed. With Medicaid cuts and widespread losses of insurance coverage on the horizon, FQHCs will increasingly be the only source of care in many communities. In order to sustain services while addressing increasing demand, FQHCs may benefit from closer alignment with payers, partnerships with other health centers and larger health systems, and technology-based solutions. Based on our findings, several targeted interventions could be used to address persistent differences in hypertension control across communities. Health centers in states identified in the least favorable trajectory groups should implement enhanced outreach programs and remote monitoring capabilities to maintain continuous blood pressure management. 25 In preparation for future public health emergencies, healthcare systems would benefit from developing robust contingency plans that prioritize maintaining chronic disease management alongside emergency response. 26 At the policy level, continued support for telehealth infrastructure and reimbursement policies could help sustain the improvements in care access achieved during pandemic recovery. 27 Additionally, state health departments should strengthen partnerships with FQHCs to implement targeted interventions in communities with persistently lower levels of hypertension control, especially as fewer resources may be available to support patients. 28
This study provides important insights into patterns of hypertension control among FQHC patients during and after the COVID-19 pandemic. While most states showed recovery in hypertension control by 2022, persistent differences across trajectory groups highlight the need for sustained attention to chronic disease management in vulnerable populations. The identification of states with consistently higher rates of uncontrolled hypertension provides a roadmap for targeted interventions and resource allocation. Future research should examine facility-level factors contributing to successful recovery in hypertension control, and evaluate the effectiveness of various adaptation strategies implemented by FQHCs during public health crises.
Footnotes
Ethical Considerations
This study is a secondary analysis of publicly available, de-identified data and did not involve direct interaction with human subjects. As such, this study was exempt from the institutional review board.
Funding
The authors disclosed receipt of the following financial support for the research, authorship, and/or publication of this article: This research was, in part, funded by the National Institutes of Health (NIH) Agreement OT2HL158287. The views and conclusions contained in this document are those of the authors and should not be interpreted as representing the official policies, either expressed or implied, of the NIH.
Declaration of Conflicting Interests
The authors declared no potential conflicts of interest with respect to the research, authorship, and/or publication of this article.