
Abstract
Introduction
Multiple chronic conditions (MCCs) are a significant public health problem receiving much attention, and rightly so, because of the related substantial morbidity, mortality, and cost burden.1,2 Comorbidity is high among chronic conditions with 68% of Medicare beneficiaries having ≥2 chronic conditions. 3 In addition to morbidity, MCCs play a disproportionate role in health care spending; the 14% of Medicare beneficiaries with ≥6 chronic conditions account for 46% of health care spending. 3 MCCs also have a high risk of mortality, with 6 of the 7 leading causes of death in the United States 4 and Pennsylvania 5 being chronic diseases.
In Pennsylvania, diabetes is the seventh leading cause of death, and a common comorbidity for heart disease (first leading cause of death), stroke (third leading cause of death), and nephritis (eighth leading cause of death). 5 Diabetes and MCCs’ substantial mortality burden is readily apparent in the average daily loss of life during 2010 in Pennsylvania: Of the 338 deaths on an average day, 86 were caused by heart disease, 18 by stroke, 9 by diabetes, and 8 by nephritis. 5 In addition, while many adults with MCCs are younger than 65 years, the prevalence of MCCs increases with age. 6 With nearly 2 million Pennsylvanians ≥65 years old,7,8 the disease and cost burdens related to MCCs are substantial.
Prevention is essential to improve the health status for people who have one or more chronic conditions.6,9 An aging population is a key driver of the enormous and growing burden of chronic disease, along with obesity, insufficient physical activity, and smoking, Thus, maximizing access to, and utilization of, proven chronic disease self-care management programs that address these common risk factors (ie, obesity, physical inactivity, and smoking) associated with many chronic conditions is paramount.6,9 More specifically, risk factors for diabetes include increasing age, obesity, physical inactivity, having a prior history of gestational diabetes, hypertension, dyslipidemia, race/ethnicity, and family history. 9
The objectives of this study were 2-fold: (a) report for the first time, the prevalence of selected frequent MCC with shared risk factors that are leading causes of death in Pennsylvania and (b) quantify the association between diabetes and its comorbidity and shared risk factors to assist in the development, implementation, and evaluation of MCCs evidence-based primary care practice and community health programs, using Centers for Disease Control and Prevention’s (CDC) free public-use Web Enabled Analysis Tool (WEAT; available at http://apps.nccd.cdc.gov/s_broker/WEATSQL.exe/weat/index.hsql) and proprietary SAS.
Methods
Study Design
This cross-sectional study used public-use data from the 2009 Behavioral Risk Factor Surveillance System (BRFSS), a multistage probability sample survey designed to represent the civilian noninstitutionalized population in Pennsylvania. Pennsylvania’s 2009 BRFSS is the most current data available in WEAT for hypertension, high cholesterol, and daily intake of fruits/vegetables.
Study Population
Pennsylvania’s 2009 BRFSS included 9172 participants who responded to the outcome question about diabetes. There were 9076 participants who responded to the question about their age, and 8066 participants were ≥35 years old. This is secondary data analysis of public-use de-identified BRFSS, not research involving human subjects.
Description of Outcome (Dependent Variable)
Diabetes was based on the following question: Have you ever been told by a doctor that you have diabetes? (excluding during pregnancy).
Description of Diabetes Comorbidity and Risk Factors (Independent Variables)
Disease Comorbidity
Diabetes comorbidity was based on the following questions:
Has a doctor, nurse, or other health professional ever told you that you had any of the following?
Heart attack (HA): (Ever told) you had a heart attack, also called a myocardial infarction?
Coronary heart disease (CHD): (Ever told) you had angina or coronary heart disease?
Heart disease: defined as having HA or CHD. The rationale for combining HA and CHD for the SAS analyses of heart disease is that HA is a severe case of CHD. And furthermore, this definition is comparable to other analyses that use the International Classification of Diseases, Ninth Revision, Clinical Modification (ICD-9-CM) codes for ischemic heart disease (410-414) that include acute myocardial infarction (410). 10 It is not possible to evaluate this definition of heart disease using WEAT.
Stroke: (Ever told) you had a stroke?
Sociodemographic Characteristics
Age in years: 4 categories in WEAT (18-24, 25-44 [reference], 45-64, ≥65 years]; and 3 categories in SAS (35-44 [reference], 45-64, ≥65 years).
Race/ethnicity: 5 categories in WEAT [non-Hispanic white [NHW], non-Hispanic black [NHB], non-Hispanic other race [NHO], non-Hispanic multiracial [NHM; reference], Hispanic); and 4 categories in SAS (NHW, NHB, NHO or NHM [NHOM; reference], Hispanic). It is not possible to combine NHO and NHM as NHOM using WEAT.
Gender: Male or female (reference).
Income: 5 categories (<$15 000, $15 000-$24 999, $25 000-$34 999, $35 000-$49 999, ≥$50 000 [reference]).
Health Status, Health Behavioral Risk Factors, and Health Care Access
Health status, health behavioral risk factors, and health care access were based on the following questions:
Hypertension: Have you EVER been told by a doctor, nurse, or other health professional that you have high blood pressure? (excluding during pregnancy).
High cholesterol: Have you EVER been told by a doctor, nurse or other health professional that your blood cholesterol is high?
Obesity status: 3 categories (obese [body mass index, BMI] ≥30 kg/m2, overweight [BMI = 25.0-29.99 kg/m2], normal weight (BMI < 25 kg/m2; reference).
Physical inactivity: During the past month, other than your regular job, did you participate in any physical activities or exercises such as running, calisthenics, golf, gardening, or walking for exercise?
Fruits or vegetable consumption: ≥5 servings of fruits or vegetables per day (yes/no).
Smoking status: Have you smoked at least 100 cigarettes in your entire life? (Note: 5 packs = 100 cigarettes]. Do you now smoke cigarettes every day, some days, or not at all?
Medical home: Do you have one person you think of as your personal doctor or health care provider? (yes/no) Those with more than one personal doctor or health care provider were categorized as “yes.”
Analytic Approach
Selected statistics were weighted percentage and 95% confidence interval (CI) to estimate prevalence. First, prevalence estimates of seven specific combinations of MCCs (only 1 or 2 MCCs possible using WEAT) that are frequent and leading causes of death and that share risk factors were calculated. As heart disease and stroke typically occur in ≥35-year-olds, all SAS analyses were performed on at-risk adults ≥35 years old. Because of WEAT’s predefined categories, it was not possible to restrict WEAT analyses to ≥35-year-olds, so ≥18-year-olds were evaluated along with age-specific groups to demonstrate 18- to 24-year-olds were not at risk for these conditions. CDC’s WEAT and SAS 9.2 Proc Survey were used for all analyses to account for BRFSS multistage complex survey design and sample weights. Respondents with missing data for the independent variables were excluded.
Next, we tested the hypothesis that diabetes was associated with comorbidity and shared risk factors by reporting descriptive summaries and unadjusted associations (crude odds ratio ORCrude and 95% CI). Finally, we report adjusted odds ratio (ORAdj) and 95% CI for multiple logistic regression models that simultaneously took into account diabetes comorbidity, sociodemographic characteristics, health status, health behavioral risk factors, and health care access.
Results
Overall Descriptive Summary (WEAT and SAS Proc Survey Analyses)
As depicted in Table 1, WEAT estimated prevalence for ≥18-year-olds were as follows: diabetes (9.0%); CHD (4.8%); HA (4.6%); stroke (2.4%); diabetes and CHD (1.5%); diabetes and HA (1.4%); diabetes and stroke (0.7%); CHD and stroke (0.6%); and HA and stroke (0.6%). Each diabetes comorbidity/MCC increases with age, such that younger adults have little to no risk of having CHD, HA, or stroke, as indicated by prevalence lower limits of 0.0% for 18- to 24-year-olds and 0.0% to 0.1% for 25- to 44-year-olds. These data suggest that prevalence estimates should be restricted to those at risk for these conditions, namely ≥35-year-olds. Hence, SAS estimated prevalence for ≥35-year-olds were as follows: diabetes (11.9%); heart disease (9.5%); stroke (3.3%); diabetes and heart disease (2.9%); diabetes and stroke (1.0%); heart disease and stroke (1.1%); and diabetes, heart disease, and stroke (0.4%).
Multiple Chronic Conditions That Are Highly Prevalent and Leading Causes of Death in Pennsylvania, BRFSS 2009: WEAT Cross Tabulations and SAS Proc Survey Frequency.

Abbreviations: BRFSS, Behavioral Risk Factor Surveillance System; WEAT, Web Enabled Analysis Tool; 95% CI, 95% confidence interval.
Estimates of the prevalence of >2 multiple chronic conditions are not possible using WEAT.
Descriptive Summary and Unadjusted Crude Association With Diabetes (WEAT Analyses)
The following crude associations were statistically significant among ≥18-year-olds (Table 2):
Diabetes comorbidity: Those with CHD (31.2%), HA (29.5%), or stroke (30.4%) were approximately 5 times more likely to have diabetes than those without CHD (7.8%), without HA (8.0%), or without stroke (8.5%).
Sociodemographic characteristics: Elderly ≥65-year-olds (19.6%) were 6.3 times more likely, and middle-aged 45- to 64-year-olds (10.9%) were 3.2 times more likely to have diabetes than 25- to 44-year-olds (3.7%). NHB adults (15.9%) were 3.1 times more likely to have diabetes than NHM adults (5.7%). As income decreased the likelihood of having diabetes increased, those with <$15 000 income (20.1%) were 5 times more likely, and those with $35 000 to $49 999 income (8.9%) were twice as likely to have diabetes, than adults with ≥$50 000 income (4.8%).
Health status, health behavioral risk factors, and health care access: Those with hypertension (19.4%) or high cholesterol (17.8%) were 5.4 times and 3.2 times, respectively, more likely to have diabetes, than those without hypertension (4.3%) or without high cholesterol (6.3%). Adults who were obese (18.3%) or overweight (7.9%) were 7.6 times and 2.9 times, respectively, more likely to have diabetes than those who were normal weight (2.8%). Physically inactive adults (17.3%) were 2.4 times more likely to have diabetes than physically active adults (8.0%). Former smokers (12.2%) were 1.5 times more likely to have diabetes than never smokers (8.3%). Those who had a medical home (9.9%) were 4.4 times more likely to have diabetes than those without a medical home (2.4%).
Descriptive Summary and Association Between Diabetes and Risk Factors in ≥18-Year-Olds, Pennsylvania BRFSS 2009: WEAT Analyses.
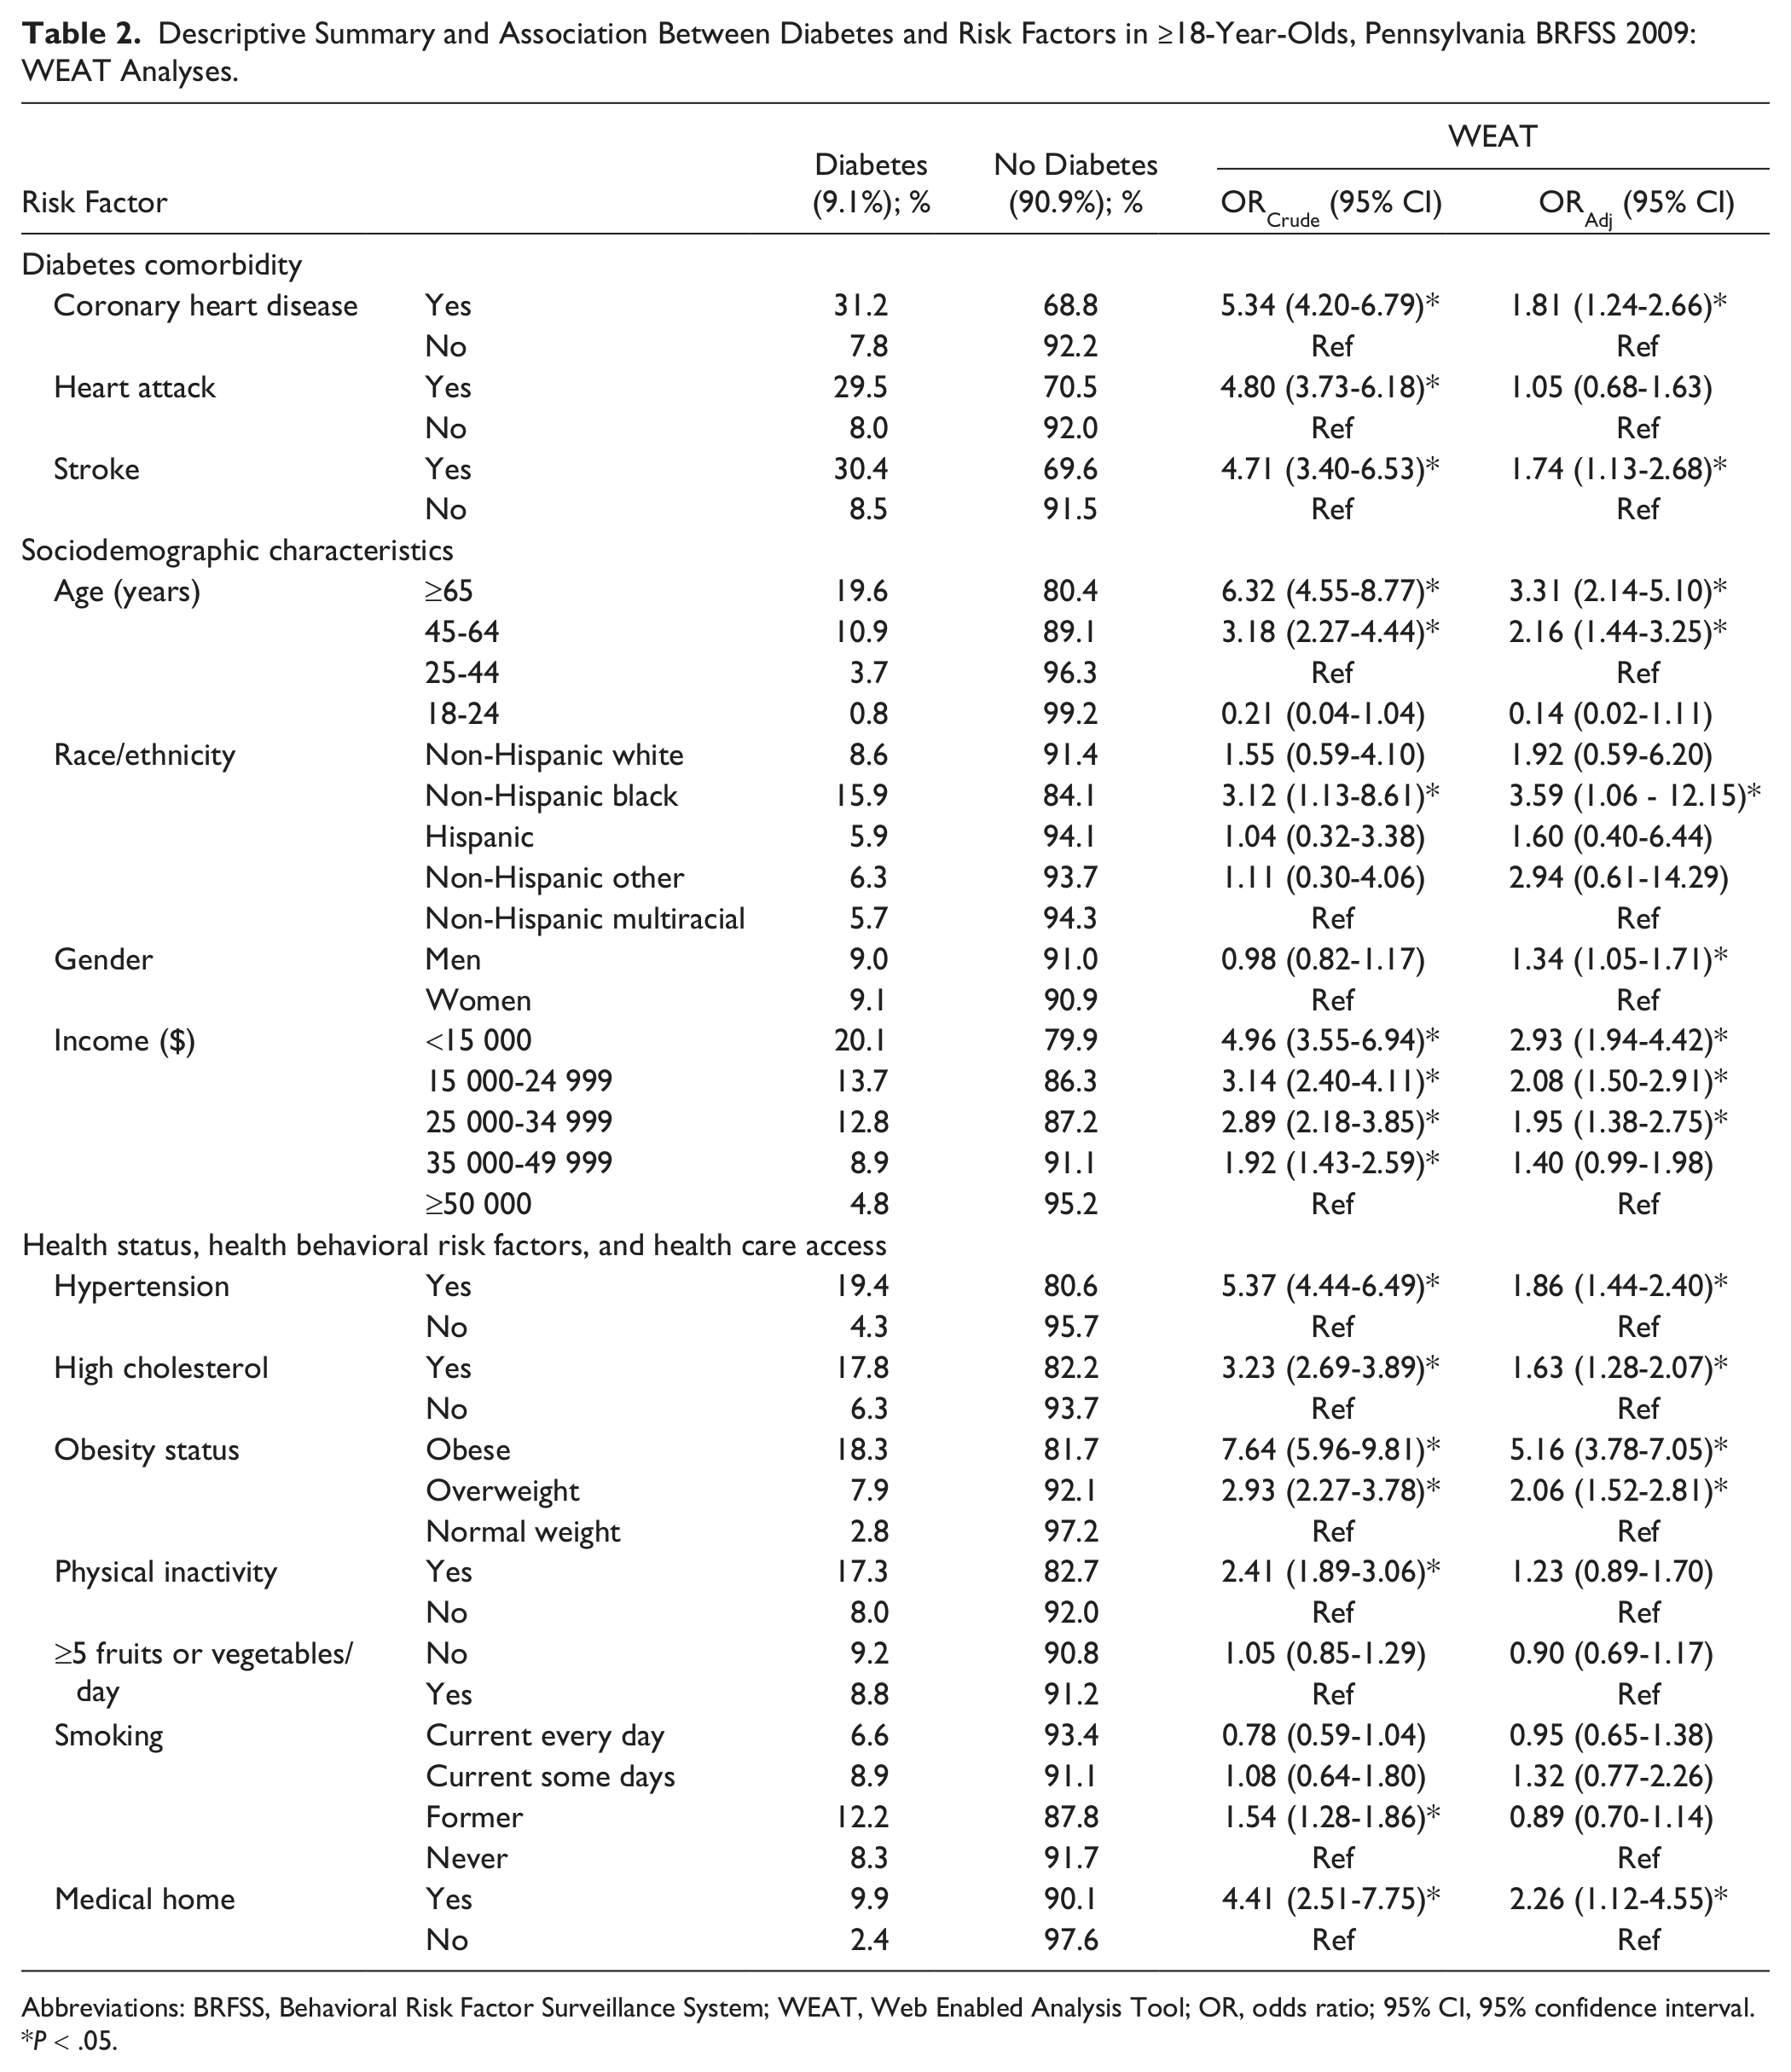
Abbreviations: BRFSS, Behavioral Risk Factor Surveillance System; WEAT, Web Enabled Analysis Tool; OR, odds ratio; 95% CI, 95% confidence interval.
P < .05.
Multivariable Logistic Regression Model of Association With Diabetes (WEAT Analyses)
After simultaneously taking into account all the risk factors listed in Table 2, adults ≥18-year-olds with the following characteristics were 1.3 to 5.2 times more likely to have diabetes: obese (ORAdj = 5.16, 95% CI = 3.78-7.05), NHB (ORAdj = 3.59, 95% CI = 1.06-12.15), older (≥65-year-olds ORAdj = 3.31, 95% CI = 2.14-5.10; 45-64-year-olds ORAdj = 2.16, 95% CI = 1.44-3.25), with lower income (<$15 000 ORAdj = 2.93, 95% CI = 1.94-4.42; $15 000-$24 999 ORAdj = 2.08, 95% CI = 1.50-2.91; $25 000-$34 999 ORAdj = 1.95, 95% CI = 1.38-2.75), a medical home (ORAdj = 2.26, 95% CI = 1.12-4.55), overweight (ORAdj = 2.06, 95% CI = 1.52-2.81), hypertension (ORAdj = 1.86, 95% CI = 1.44-2.40), CHD (ORAdj = 1.81, 95% CI = 1.24-2.66), stroke (ORAdj = 1.74, 95% CI = 1.13-2.68), high cholesterol (ORAdj = 1.63, 95% CI = 1.28-2.07), and men (ORAdj = 1.34, 95% CI = 1.05-1.71).
Descriptive Summary and Unadjusted Crude Association with Diabetes (SAS Proc Survey Analyses)
The following crude associations were statistically significant among ≥35-year-olds (Table 3):
Diabetes comorbidity: Those with heart disease (30.0%), or stroke (30.9%) were 3.5 to 4 times more likely to have diabetes than those without heart disease (9.8%), or without stroke (11.2%).
Sociodemographic characteristics: Elderly ≥65-year-olds (19.6%) were 4.9 times more likely, and middle-aged 45- to 64-year-olds (10.9%) were 2.5 times more likely to have diabetes than 35- to 44-year-olds (4.7%). NHB adults (20.3%) were 3.5 times more likely to have diabetes than NHOM adults (6.8%). As income decreased, the likelihood of having diabetes increased, those with <$15 000 income (24.7%) were 5 times more likely, and those with $35 000 to $49 999 income (12.2%) were twice as likely to have diabetes than adults with ≥$50 000 income (6.1%).
Health status, health behavioral risk factors, and health care access: Those with hypertension (21.1%) or high cholesterol (18.4%) were 4.2 times and 2.6 times, respectively, more likely to have diabetes, than those without hypertension (6.0%) or without high cholesterol (8.1%). Adults who were obese (21.6%) or overweight (10.1%) were 5.8 times and 2.4 times, respectively, more likely to have diabetes than those of who were normal weight (4.5%). Physically inactive adults (17.8%) were twice as likely to have diabetes than physically active adults (9.5%). Former smokers (14.1%) were 1.3 times more likely to have diabetes than never smokers (10.9%). Those who had a medical home (12.4%) were 3.3 times more likely to have diabetes than those without a medical home (4.2%).
Descriptive Summary and Association Between Diabetes and Risk Factors in ≥35-Year-Olds, Pennsylvania BRFSS 2009: SAS Proc Survey Analyses.
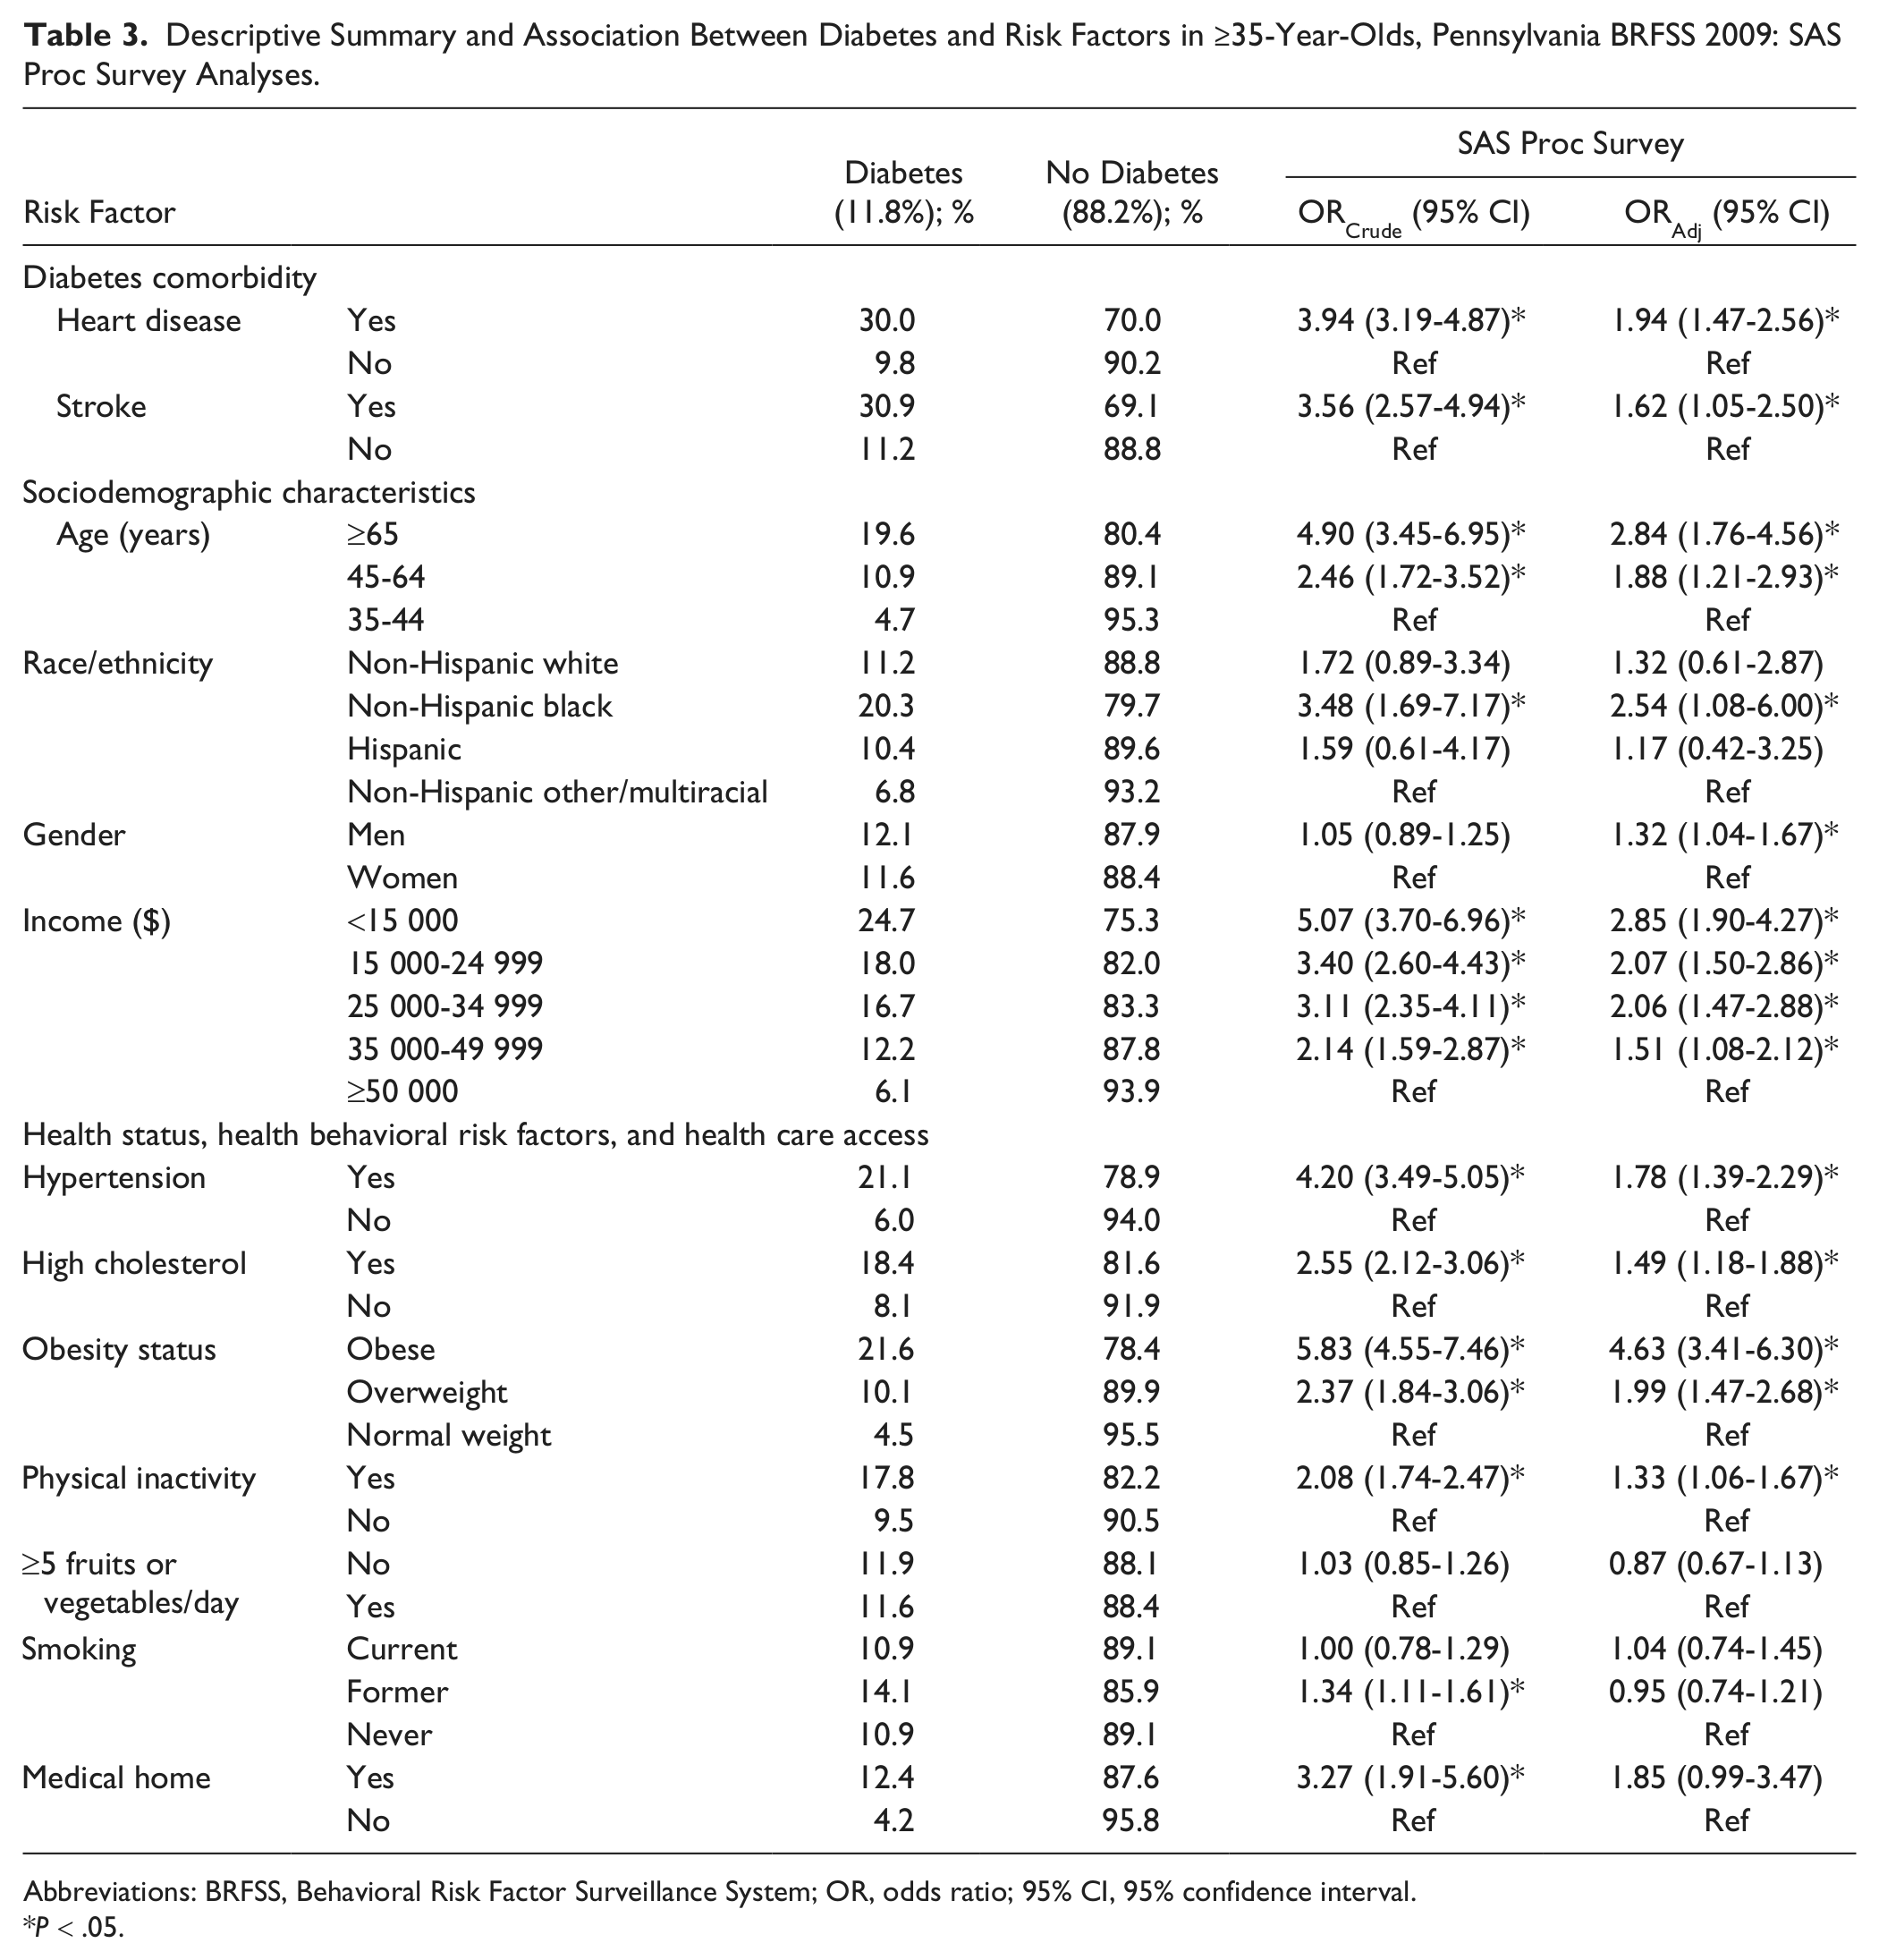
Abbreviations: BRFSS, Behavioral Risk Factor Surveillance System; OR, odds ratio; 95% CI, 95% confidence interval.
P < .05.
Multivariable Logistic Regression Model of Association With Diabetes (SAS Proc Survey Analyses)
After simultaneously taking into account all the risk factors listed in Table 3, adults ≥35-year-olds with the following characteristics were 1.3 to 4.6 times more likely to have diabetes: obese (ORAdj = 4.63, 95% CI = 3.41-6.30), with lower income (<$15 000 ORAdj = 2.85, 95% CI = 1.90-4.27; $15 000-$24 999 ORAdj = 2.07, 95% CI = 1.50-2.86; $25 000-$34 999 ORAdj = 2.06, 95% CI = 1.47-2.88; $35 000-$49 999 ORAdj = 1.51, 95% CI = 1.08-2.12), older (≥65-year-olds ORAdj = 2.84, 95% CI = 1.76-4.56; 45-64-year-olds ORAdj = 1.88, 95% CI = 1.21-2.93), NHB (ORAdj = 2.54, 95% CI = 1.08-6.00), overweight (ORAdj = 1.99, 95% CI = 1.47-2.68), heart disease (ORAdj = 1.94, 95% CI = 1.47-2.56), hypertension (ORAdj = 1.78, 95% CI = 1.39-2.29), stroke (ORAdj = 1.62, 95% CI = 1.05-2.50), high cholesterol (ORAdj = 1.49, 95% CI = 1.18-1.88), physically inactive (ORAdj = 1.33, 95% CI = 1.06-1.67), and men (ORAdj = 1.32, 95% CI = 1.04-1.67).
Discussion
This first report of selected frequent MCCs with shared risk factors that are leading causes of death in Pennsylvania’s at-risk population of ≥35-year-olds identifies diabetes and diabetes comorbidity as common chronic diseases with 11.9% being diagnosed with diabetes, 9.5% having heart disease; 3.3% having had a stroke, 2.9% having both diabetes and heart disease, 1.0% having both diabetes and stroke, 1.1% having both heart disease and stroke, and 0.4% having diabetes, heart disease, and stroke. Whereas these prevalence estimates, for the at-risk group of ≥35-year-olds, were only possible using SAS, it was possible to estimate age-group specific prevalence estimates for up to 2 MCCs using WEAT. These self-reported chronic disease prevalence estimates are known to underestimate the true prevalence because many adults are not diagnosed. For example, approximately one quarter of Americans with diabetes are undiagnosed.11,12 Besides morbidity, diabetes also plays a major role in mortality, thus, signifying the important role of primary care providers and community programs in managing and controlling the progression of MCCs.
In addition to the substantial disease burden, 5 MCC have a high cost burden in Pennsylvania, with more than $68.8 million in payments for diabetes hospitalizations in 2009. 13 The cost drivers related to potentially avoidable hospitalizations for diabetes should not occur often when adequate primary care is received. 14 Given Pennsylvania’s aging population and the projection that ≥65-year-olds are expected to increase from 15.5% in 2010 to 22.6% in 2030, 8 the medical cost associated with MCCs will likely increase substantially. To address the high chronic disease burden and corresponding cost burden, a medical home model has been developed as one approach to coordinate person-centered care activities. 15 Such approaches allow for the identification and management of prediabetes and diabetes, along with MCCs linked to diabetes (CHD, chronic kidney disease, hypertension), inflammation/infection (bacteremia, periodontal infection, atherosclerosis), and related shared behavioral risk factors (smoking, obesity).16,17
When compared to SAS, WEAT’s limitations are the predefined categories (ie, CHD and HA vs heart disease, age, race/ethnicity, and smoking status), and related inability to restrict analyses to specific age-groups, and to estimate the prevalence of more than 2 MCCs. We provide an example of the considerable analytical potential of WEAT, to advance evidence-based primary care practice and community health programs, such as state-wide programs that target obesity and physical inactivity. That is, in the WEAT modeling example (Table 2), we partially overcame the more serious limitation of the predefined 18- to 24-year-old age-group not being an appropriate at-risk reference group by simply changing the reference to the 25- to 44-year-old group. The usefulness of WEAT as an analytical tool is readily apparent in the finding that obesity was consistently the strongest risk factor associated with diabetes in both SAS and WEAT logistic regression models (Tables 2 and 3). This provides state-specific evidence-based guidance to further support primary care providers and community health programs targeting obesity by focusing on weight loss and/or maintaining healthy weight.18,19 A focus on healthy eating and physical activity has important health implications because obesity has almost doubled in Pennsylvania over the past 16 years, from 16% in 1995 BRFSS to 29% in 2010 BRFSS, and obese adults were nearly 5.5 times more likely to have MCCs (diabetes, heart disease, and stroke) than normal weight adults.
To the best of our knowledge, this is the first study that used both WEAT 20 and SAS as research tools to improve health through (a) state-level MCC prevalence estimates and (b) assessment of associated comorbidity and risk factors relevant to the development, implementation, and evaluation of related evidence-based practices. Despite the limitation of WEAT as an analytic tool (it cannot estimate prevalence for >2 MCCs, or report on the at-risk group of ≥35-year-olds), it has considerable potential to advance evidence-based practice through almost unlimited national and state-level evaluations of chronic diseases, risk factors, health care access, and doctors’ practice behaviors.
A strength of this study is that BRFSS is the only available data derived from a complex sampling methodology designed to estimate state-specific prevalence of both chronic diseases and risk factors. However, one must be cognizant of BRFSS’s weakness, namely the potential misclassification bias associated with subjective self-reported measures, such as the underestimation of obesity prevalence. 21 An additional strength of our study, over others that count the number of chronic conditions,3,22-24 is that SAS can estimate the prevalence of any number of specific combinations of MCCs, as has been previously reported for 4 conditions. 25 This is pertinent because all chronic conditions are not the same, as evident by the finding that nearly twice as many adults with heart failure or stroke had ≥5 other conditions (~55%), than adults with cancer (~30%). 3
In summary, chronic diseases, and more specifically MCC are the most prevalent and costly health problems accounting for 70% of total medical care expenditures. 1 However, MCC can be prevented and/or controlled through evidence-based primary care practices and system-based practice approaches.18,19,26-28 Thus, data such as reported herein, are essential when developing and evaluating programs directed toward improving health. We support and recommend using WEAT, as long as the limitations regarding predefined categories, such as age, are recognized along with the corresponding underestimated prevalence. Whereas SAS may not be as user-friendly and interactive as WEAT, it is a more robust analytic tool capable of advancing evidence-based practice by providing more appropriate prevalence estimates of MCC and risk factors, and adjusted associations for state-specific at-risk populations.
Footnotes
Acknowledgements
The authors thank Stephen M. Ostroff, MD, Director, Bureau of Epidemiology, Pennsylvania Department of Health, for reviewing and providing insightful comments and suggestions.
Declaration of Conflicting Interests
The author(s) declared no potential conflicts of interest with respect to the research, authorship, and/or publication of this article.
Funding
The author(s) disclosed receipt of the following financial support for the research, authorship, and/or publication of this article: This study was supported by CDC-RFA-DP09-9010301PPHF11 and National Association of Chronic Disease Directors NACDD-0612012.