
Abstract
Introduction
The prevalence of childhood obesity has reached epidemic proportions. 16.9% of children and adolescents aged 2 through 19 years have a body mass index (BMI) ≥the 95th percentile for their age and gender and 31.8% have a BMI at or higher than the 85th percentile. 1 Nevertheless, studies have indicated that a large percentage of overweight and obese patients remain undiagnosed.2-8 Previous studies have reported rates of diagnosis ranging from 18% to 54%. 1 Nevertheless, studies have indicated that a large percentage of overweight and obese patients remain undiagnosed.2-8 Higher rates of diagnosis of obesity have been noted in those with severe obesity, females and those older than 6 years.2,4,9 Factors responsible for low rates of obesity diagnosis may include a lack of familiarity with the revised definitions of childhood overweight and obesity, insufficient time available for appropriate counseling and the contention that counseling may have modest impact as suggested by recent nationally representative surveys of the American Academy of Pediatrics and American Academy of Family Physicians.10-14
In 2007, recommendations were made to classify children with BMI ≥95th percentile for their age and gender as “obese” rather than “overweight” and those with a BMI between the 85th and 94th percentile as “overweight” rather than “at risk for overweight.” 15 Specific recommendations were also made regarding lifestyle counseling and laboratory screening for obesity-related comorbidities. 15 The objective of this study was to examine temporal trends in the rates of diagnosis and management of obesity and overweight by primary care providers at a single medical center.
Methods
The study cohort consisted of children 2 to 18 years old who underwent an outpatient general medical examination, in primary care (pediatrics and family medicine) at a single medical center during 2003, 2006, or 2009. In all, 70% of the study subjects/patients live within the same town and non-Hispanic whites constitute majority (84%) of the study local population.16,17 The study was approved by the institutional review board.
The BMI recorded in the electronic medical record was obtained. For patients with more than one medical examination visit in the calendar year of interest, the visit with the highest documented BMI in that calendar year was defined as the index visit. Age- and sex-specific BMI percentiles were calculated using the 2000 Centers for Disease Control and Prevention growth charts. 18 The patients were then classified into 3 groups: obese (BMI ≥95th percentile for age and gender), overweight (BMI between the 85th and 94th percentile), and others. Severe obesity was defined as BMI at or greater than the 99th percentile.
For the overweight or obese children, the text in the diagnosis, impression, report, and plan sections of the record was electronically searched by personnel unaware of study hypothesis for weight related diagnostic and management terms (supplemental table for terms available on request). Examples of searched terms for diagnosis were BMI, overweight, weight concerns, obesity, weight gain or weight increase and for weight management or counseling were weight, exercise, diet, television, screen time, portion control, healthy eating, diet modification, and physical activity.
The medical records of patients identified during the electronic search as having one or more of the weight-related diagnostic and management terms were also reviewed manually and the type of management plan was categorized into: dietary changes, increased activity, decreased screen time, and follow-up. For the obese patients older than 10 years, laboratory tests were queried electronically to determine whether any of the laboratory studies recommended for overweight or obese children older than 10 years (lipid panel, aspartate aminotransferase [AST], alanine aminotransferase [ALT], fasting plasma glucose) had been performed within 2 years before or after the index visit.
Analysis
The binary outcomes were compared between specific calendar years of interest (2003 vs 2006 or 2006 vs 2009) using the χ2 test, or across all 3 calendar years using the Cochran–Armitage test for trend. Associations of patient and provider factors with each of the outcomes, documentation of a weight-related diagnostic term, and documentation of a weight management term, respectively, were assessed by fitting univariable and multivariable logistic regression models. The strength of the associations was assessed by calculating odds ratios (ORs) and corresponding 95% percent confidence intervals (95% CIs). All calculated P values were 2-sided and P values <.05 were considered statistically significant. Statistical analyses were performed using the SAS software package (version 9.1; SAS Institute, Cary, NC).
Results
The number of patient visits fulfilling criteria for review was 6390 in the year 2003, 6646 in the year 2006, and 7408 in the year 2009 (Table 1).
Patient Demographics and Provider Characteristics for 2003, 2006, and 2009.

Among the obese children, the percentage with a weight-related diagnosis increased from 36.0% in 2006 to 53.3% in 2009 (P < .001; Figure 1) and obese children were twice as likely to receive a weight-related diagnosis in 2009 compared with 2006 (OR = 2.04, 95% CI = 1.63-2.55). The rates of obesity diagnosis had also increased from 24.3% in 2003 to 36.0% in 2006 (P < .001; Figure 1) and obese children were 1.75 times more likely to receive a weight-related diagnosis in 2006 compared with those seen in 2003 (OR = 1.75, 95% CI = 1.38-2.22). Among the overweight children, the percentage with a weight-related diagnosis increased from 7.5% in 2006 to 17.2% in 2009 (P < .001; Figure 1) and overweight children were 2.5 times more likely to receive a weight-related diagnosis in 2009 than in 2006 (OR = 2.5, 95% CI = 1.89-3.43). The rates for diagnosis of overweight also increased between the years 2003 and 2006 (3.2% in 2003 to 7.5% in 2006, P < .001; Figure 1).
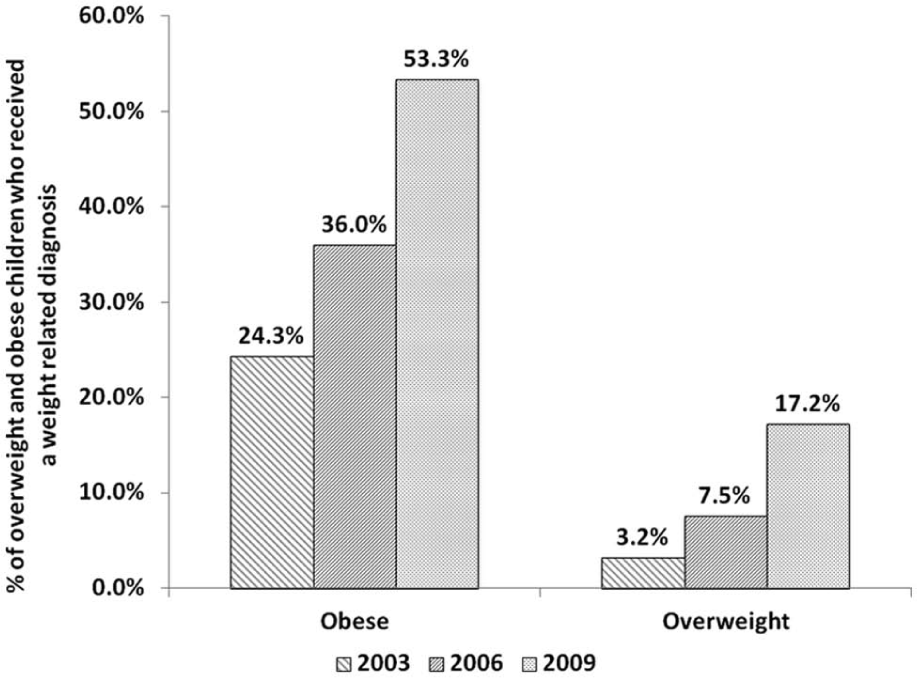
Percentage of overweight and obese patients who received a weight-related diagnosis, by calendar year.
Based on a multivariate logistic regression analysis of the obese patients in 2009, females (OR =2.0; 95% CI = 1.4-2.9), age more than 6 years (7-10 years, OR = 3.3, 95% CI = 2-5.5; 11-14 years, OR = 3.7, 95% CI = 2.4-5.9; 15-18 years, OR = 2.8, 95% CI = 1.5-4.7) and children with severe obesity (OR = 3.5, 95% CI = 2.2-5.5) were more likely to receive a diagnosis of obesity (Table 2). Resident physicians were more likely to diagnose obesity than staff physicians (OR = 2.2, 95% CI = 1.4-3.4) and pediatricians were more likely to diagnose obesity compared with family medicine physicians (OR = 5.0, 95% CI = 3.4-7.4; Table 2).
Evaluation of Factors Associated With Receiving a Weight-Related Diagnosis and Weight-Related Management Plan, Respectively, Based on the Children With BMI ≥ 95th Percentile in 2009.

Abbreviations: OR, odds ratio; 95% CI, 95% confidence interval; RN/NP, registered nurse/nurse practitioner; BMI, body mass index.
Among the obese children, the rates of weight-related counseling increased from 34.8% in 2006 to 49.4% in 2009 and obese children were 1.8 times more likely to receive weight-related counseling in 2009 than in 2006 (OR = 1.83, 95% CI = 1.46-2.29; P < .001; Figure 2). The rates of weight-related counseling in obese children also increased from 2003 (26.6%) to 2006 (34.8%; P = .001; Figure 2). Similarly, among the overweight children, the rates of weight-related counseling increased from 14.4% in 2006 to 21.9% in 2009 (P < .001; Figure 2). Those with a diagnosis of obesity were 8.8 times more likely to receive weight-related counseling than those without a diagnosis (OR = 8.8, 95% CI = 5.9-13.2; Table 2). Children older than 6 years were also more likely to receive weight-related counseling than were younger children. Additionally, resident physicians were more likely to provide weight-related counseling compared with staff physicians (OR = 1.4, 95% CI = 0.9-3.5).

Percentage of overweight and obese patients who received a weight-related management plan, by calendar year.
Among the obese patients with a documented weight-related diagnostic term and management plan (n = 108, n = 152, and n = 271 in 2003, 2006, and 2009, respectively), the percentage given advice to decrease screen time increased from 15.1% in 2006 to 30.4% in 2009 (P < .001; Table 3). There was no significant change in screen time counseling between 2003 and 2006 (P = .24).
Trends in Counseling Among Obese Patients (Age 2-18 Years) With a Documented Weight-Related Diagnosis and Management Plan.

Because the most recent guidelines recommend screening for diabetes and fatty liver disease in children older than 10 years, 15 we restricted our analysis regarding laboratory tests to this subgroup and found a significant increase in the screening for nonalcoholic liver disease in 2009 compared with 2006 (30.6% vs 21.9%, P = .018; Table 4). There was a trend toward an increase in the proportion of children undergoing a fasting plasma glucose measurement for screening for type 2 diabetes mellitus (27% in 2006 and 33.8% in 2009; P = .068; Table 4).
Trends in the Measurement of Laboratory Studies Among Obese Patients >10 Years Old.

Abbreviations: ALT, alanine aminotransferase; AST, aspartate aminotransferase.
Discussion
This study examines temporal trends in obesity diagnosis and management by primary care providers at a single medical center. We found a significant increase in the rates of diagnosis of overweight and obesity in the past decade. Our results are in agreement to those of Sharifi et al 19 who also reported higher rates of diagnosis coding for overweight and obese children in 2008 than in 2006. In contrast, Benson et al 2 using the International Classification of Diseases–Ninth Revision (ICD-9) codes reported increase in rates of obesity diagnosis until 2005 but year to year plateauing between 2005 and 2007. These contrasting results may be related to several factors such as the method of determining diagnosis of obesity (ICD-9 code vs search of the medical records for appropriate terms), geographic differences (subjects in the Benson study were from Northeast Ohio whereas our population was mainly from a Midwestern town) and ethnicity (majority of the subjects in the Benson study were Blacks and Hispanics and only a third were Whites unlike our subjects majority of whom were White. Therefore, further research is needed to determine the role of ethnicity and geographic location on diagnosis of childhood obesity.
Guidelines pertaining to diagnosis and management of childhood obesity recommend that BMI should be calculated and plotted at least annually by primary care providers. 15 Children who are found to be “overweight” or “obese” based on BMI criteria should receive counseling aimed at improving eating habits, increasing physical activity and decreasing sedentary activities such as television. 15 For children with BMI at or higher than the 95th percentile, measurement of fasting lipid panel, fasting glucose, ALT and AST levels is recommended every 2 years starting at 10 years of age. 15 It is also recommended that children with BMI between 85th and 94th percentile undergo lipid panel testing and, if risk factors such as family history of obesity-related diseases, elevated blood pressure, elevated lipid levels, or tobacco use are present, then fasting glucose, ALT, and AST levels should be measured every 2 years for children aged 10 years and older.
We noted significant increase in screening for nonalcoholic fatty liver disease in 2009 compared with 2006. Other investigators have not reported any differences in laboratory test ordering between 2008 and 2006. 19 As clinical guidelines relating to laboratory screening for fatty liver disease were published in December 2007, it is likely that greater awareness among the care providers in the year 2009 than in 2008 may have contributed to these differences. We also found a significant increase in counseling pertaining to screen time. This may be secondary to the heightened attention increased screen time has received relative to its roles not only in promoting obesity but also in delaying language development and increasing aggression in young children.20,21
Despite increasing diagnosis of childhood obesity, almost half of the obese children in 2009 were not diagnosed as obese and only 1 in 6 overweight children were identified as being overweight. Similar to other reports, we found that the diagnosis of obesity was the strongest predictor for receiving weight-related management.2,3,6 Therefore, measures aimed at improving the diagnosis of obesity are warranted. Guideline adherence is often promoted in health care centers by incorporation of the recommendations in various continuing medical education activities for care providers. In addition, these recommendations are often incorporated in flow charts/standard practice guidelines for general medical examinations. These activities may be particularly helpful for those providers/groups that are least adherent. Follow-up evaluation is recommended to determine if interventions aimed at improving adherence of the primary care providers to the guidelines have been effective.
Only about a third of obese children older than 10 years in 2009 underwent recommended screening for type 2 diabetes, nonalcoholic fatty liver disease, and lipid disorders. The higher rates of screening for type 2 diabetes mellitus and lipid disorders in our population compared with another report from an academic center serving predominantly minority subjects during the years 2001-2002 may be related both to the demographics of the population served and to the later timing of our study. 7
Our study has several limitations. First, our study results may not be representative of the ethnically diverse population in the United States as our study subjects were primarily white and our data was derived from a single medical center with majority of the study population living within the same town. Second, we evaluated whether physicians diagnosed or managed obesity by reviewing documentation in the medical records. Physicians may have discussed obesity as a health problem and discussed appropriate counseling but not documented it. We did, however, use a search for an exhaustive list of terms in the medical records to decrease that possibility instead of relying on ICD-9 codes. We did not collect information on the demographic attributes of the providers and these may be an important determinant of physician practices regarding obesity diagnosis and management.
We determined whether laboratory studies had been performed in obese children older than 10 years of age. Many children or their families may have elected to not get these tests drawn despite recommendations from their health care provider. The effect of socioeconomic and demographic characteristics of the parents such as ethnicity, income, and education on rates of laboratory screening was also not examined.
Although we noted improvement in obesity diagnosis and obesity-related counseling and laboratory screening by primary care providers, continued efforts to increase awareness of these issues are needed as nearly half of obese children remained undiagnosed and recommended laboratory screening for obesity-related comorbidities was performed in only a third of obese children.
Footnotes
Acknowledgements
We would like to thank Pauline Funk for data retrieval.
Authors’ Note
Drs Nader and Singhal contributed equally to the manuscript.
Declaration of Conflicting Interests
The author(s) declared no potential conflicts of interest with respect to the research, authorship, and/or publication of this article.
Funding
The author(s) disclosed receipt of the following financial support for the research, authorship, and/or publication of this article: This study was funded by the T. Denny Sanford Endowed Pediatric Collaborative Research Fund.