
Abstract
Purpose
This study introduces the Global Education Quality Index (GEQI) to evaluate education quality and development worldwide. We compare strengths and weaknesses across representative countries/regions. Our analysis offers a global snapshot of education quality and provides insights for educational improvement.
Design/Approach/Methods
This study pools data from 61 countries/regions from 2009 and 2018, utilizing an “Educational Input-Process-Outcome” framework to construct the GEQI. Comparison of regional education quality is conducted based on GEQI scores.
Findings
Overall, the GEQI encompasses three components. First, Quality of Basic Education Assurance assesses basic education accessibility and government investment in educational infrastructure. Second, Quality of School Education Operation evaluates resource allocation and students' academic performance. Third, Quality of Postsecondary Education Development measures educational attainment and development at an advanced and professional level. Furthermore, descriptive analysis indicates that European Union countries consistently dominate the top positions across multiple GEQI sub-indices, while other countries or regions exhibit distinct patterns in specific quality dimensions. These variations may be attributed to differences in cultural contexts, social policy practices, and regional educational reforms.
Originality/Value
This study introduces a robust quantitative tool for global education quality assessment. The GEQI maps the global education landscape and offers actionable insights into systemic educational improvements.
Introduction
Education plays a crucial role in fostering innovation, advancing technology, and driving economic development (Lucas, 1988; Romer, 1986; Solow, 1956). In particular, education quality has a profound impact on accumulating and consolidating human capital, which contributes to country's overall social productivity and competitiveness (Heyneman, 2004; Švecová, 2017). Empirical research has demonstrated the positive impact of education quality on economic growth (Hanushek & Kim, 1995), diminishing income inequality (Castelló-Climent & Doménech, 2012; Yang & Li, 2007), and upward social mobility (Brezis & Hellier, 2018; Marginson, 2018).
Promoting education quality has become national strategy for some countries. For instance, in recent years, the Chinese government has highlighted education as primary driving force, advocating for prioritization of education development and making concerted efforts to establish a powerful educational system. During the fifth collective study session of the Chinese government in May 2023, President Xi Jinping provided crucial ideological guidance for establishing a powerful socialist educational nation, infused with Chinese characteristics (Xinhua News Agency, 2023).
Given the challenges in obtaining and effectively measuring numerous indicators across nations, it is essential to establish a scientifically rigorous measurement framework for assessing educational quality development. Moreover, establishing a reliable measurement framework to assess global education quality would facilitate cross-country comparative analyses under the standized criteria. However, the existing frameworks regarding the education quality assessment failed to comprehensively evaluate the education quality due to the limited assessment scope and unbalanced focus (Švecová, 2017; Yang, 2018). This study developes a comprehensive measurement framework, named Global Education Quality Index (GEQI), which integrated multiple worldwide databases from the World Bank, the Organisation for Economic Co-operation and Development (OECD), the United Nations Educational, Scientific and Cultural Organization (UNESCO), and the Programme for International Student Assessment (PISA). By applying the constructed GEQI to systematically assess education quality across various countries/regions, this study further offers both theoretical contributions and practical implications for advancing global education development.
The remainder of this paper is organized as follows. The next section reviews the relevant literature. The subsequent third section describes the methodology and data sources applied to construct the Index. Section four presents a cross-national descriptive analysis of education quality measured by GEQI index. The final sector concludes and proposes suggestions for improving education quality.
Literature review and index development
Education quality
Despite extensive studies have examined the impact of education quality on social and economic development, researchers have not yet reached a unified and convincing consensus on the appropriate measures for evaluating education quality. Commonly taking either educational input or educational output indicators as proxy for education quality, such as per capita funding, teacher salary, teacher–student ratio, test scores, enrollment rate, pass rate, and dropout rate, among others (Wen et al., 2017), prior research has demonstrated the significant impact of education quality on various outcomes, including promoting economic development, reducing inequalities and improving social wellbeing (Jamison et al., 2007). For instance, Hanushek and Kim (1995) underscore the linkage between education and labor force quality, which in turn enhances national economic performance. Furthermore, equitable access to education fosters a more balanced distribution of wages, which supports broader economic growth, as shown in studies by Castelló-Climent and Doménech (2012), and Yang and Li (2007).
Developing a reliable framework to assess the global education quality requires a comprehensive understanding of connotations and dimensions regards to education quality. With regard to the official definition, the Comprehensive Dictionary of Education (1998, p. 798) characterizes education quality as the “assessment of the level and effectiveness of education” predicated on “educational objectives and the training goals of various levels and types of schools,” ultimately manifested in the quality of the students cultivation. Given education's a long-term, complex, and progressive nature, its conceptualization requires redefinition of this concept to better capture its dynamic and integrative characteristics.
For better conceptualize the core subject, this study synthesizes existing definitions (Gu, 1998; Li & Xin, 2021) by 1) adopting human development perspective, 2) highlighting the intrinsic components of education quality as well as their interrelationships in holistic human development assessment and 3) conceptualing the principal educational dimensions through macroscopic indicators that track comprehensive development of students across educational stage.
The framework of the index: Educational “inputs–process–outputs”
Education quality manifests across various levels and dimensions. Heyneman (2004) attempted to construct a quality framework from the systematic perspective, identifying four dimensions as: (1) non-salary items, (2) one book per year in each subject, (3) more than one title of the book may be available, and (4) electronic access to libraries and educational software. However, these dimensions merely focus on school facilities which belong to the “educational input” dimension and can hardly reflect broad education quality. Furthermore, the widely applied CIPP model (Stufflebeam et al., 2000) designed for educational evaluation provides a general paradigm which consists of “context–input–process–product” process yet not quite suitable in assessing the quality of education. Additionally, Adams (1993) constructed a methodological framework that effectively assess the education quality by connecting the inner components through “inputs–process–outputs” structure. His framework provides a systematic, scientific, and feasible approach for assessing the quality of education. This framework fits the context of evaluating education quality, which contains essential elements including inputs (e.g., the number of teachers, level of teacher training, and quantity of teaching materials), process (e.g., teaching duration and student inputs), outputs (e.g., exam scores and completion rates), and outcomes (e.g., job performance). In light of this, we focus on three critical components contributing to the education function, namely background/opportunities, input and outcome/product.
Firstly, gross (net) enrollment rates are frequently used to reflect the education opportunities and measure the proportion of students who have access to education at a certain stage, relative to the age-appropriate population for that stage. Gross enrollment rates at different educational stages have distinct implications. For example, the gross enrollment rate for secondary education measures the proportion of students in a nation who are able to access basic education at the secondary level, reflecting the country's commitment to providing fundamental knowledge base to its citizens (Tan & Yuan, 2001). In contrast, the gross enrollment rate for higher education reflects the percentage of the eligible population that obtain specialized or professional skills (Chen, 2016; Zhang et al., 2018).
Secondly, in terms of educational inputs, this study draws on the education production function model: At = a (St, Qt, Ct, Ht, It) (Hanushek et al., 2016, p. 667).1 These inputs include expenditures on education, teaching force, class size, and material inputs. Government expenditure on education reflects the scale of pecuniary inputs in education and government's efforts or commitments toward educational development. A sufficient education budget can significantly improve students’ academic performance (Ding & Xue, 2009; Li & Wei, 2014; Li & Zhang, 2018; Ram, 2004; Roy, 2011). Besides, teachers play a vital role in the educational process, with their education levels, experience, and salaries being critical educational inputs (Cooper & Cohn, 1997). Studies suggested that teachers’ education levels and years of experience (Clotfelter et al., 2007; Wang et al., 2017) as well as salary (Britton & Propper, 2016) significantly enhance students’ learning outcomes. In addition, smaller class sizes or higher teacher–student ratios are viewed as indicators of high-quality education as well. Reducing class size has shown to improve students’ academic performance (Angrist & Lavy, 1999; Hu & Du, 2008; Krueger, 1999), increase school completion, decrease teen pregnancy rates, and expand higher education enrollment opportunities (Chetty et al., 2011; Schanzenbach, 2014). Finally, basic material inputs, such as value of fixed assets per student (Li & Wei, 2014; Li & Zhang, 2018), non-salary expenditure per student (Heyneman, 2004), and the level of IT integration in schools (Gu et al., 2016; Hassler Hallstedt et al., 2018), reflect the quality of educational infrastructure which is conducive to improving students’academic performance.
Thirdly, with regard to education outcomes, the cognitive abilities or academic performance for students serve as effective indicators estimating learning outcomes. Internationally recognized assessments, such as PISA or TIMSS (Trends in International Mathematics and Science Study), which measure students’ literacy and cognitive performance, are commonly used indicators for comparing cognitive literacy across countries.
Nevertheless, those educational indices, such as educational opportunities, processes, and outcomes are not independent. Instead, those elements interact with one another and may confound the overall assessment for education quality. For instance, increasing the gross enrollment rate at any given educational stage will inevitably lead to the expansion at subsequent stages, thereby necessitating corresponding increases in government educational expenditures. Similarly, enhancing government investment in a specific educational stage will, in turn, improve resource adequacy at that stage, which may subsequently improve academic outcomes for the corresponding student cohort.
To address the challenges of double counting and weight bias resulting from the intricate connections among educational opportunities, processes, and outcomes, the study employs principal component factor analysis to ensure the integrity of the educational quality framework while reducing the potential assessment bias.
Comparative analysis of international education quality frameworks
A robust education quality index requires a conceptual decomposition of education quality framework into dimensions, derived through systematic operationalization of its core definition. Existing education quality assessment frameworks cannot fully reflect the internal structure of education quality and suffer from several issues. Previous education quality assessment frameworks typically focused on specific types or stages of education, such as general higher education (Cao & Li, 2013; Švecová, 2017), higher vocational education (Bao, 2016), and distance education (Yang, 2018). While the existing indicators provide valuable insights, several conceptual and methodological considerations warrant attention for enhancing national-level education quality assessment. First, the current frameworks could benefit from broader coverage of education quality dimensions beyond outcome measures. Second, incorporating more granular indicators—particularly those capturing educational processes and opportunity structures—would strengthen the analytical depth. For instance, additional metrics addressing school management practices, resource allocation (e.g., expenditure patterns, teaching workforce composition), and learning environments might offer more comprehensive evaluation of basic education provision. Third, balancing the temporal dimensions of assessment by complementing short-term outcome metrics with longitudinal measures of educational progression could provide a more holistic perspective.
To foster better understanding of education quality while construct a more comprehensive framework, this study has drew on four widely recognized sets of indicators: the educational indicators in World Development Indicator (WDI) developed by the World Bank (World Bank, 2022), the Education for All Development Index (EFA-DI) led by the United Nations Educational, Scientific and Cultural Organization (UNESCO; EFA Global Monitoring Report Team, 2004), the Education Development Index of Chinese mainland (EDI, Chinese mainland) constructed by Wang et al. (2013), and the Education Development Index of India (EDI, India; Administration NUOEPA, 2013; Jhingran & Sankar, 2009). Table 1 presents a comparative analysis of these indices based on educational “inputs–process–outputs” logic.
Comparison of education quality assessment frameworks.
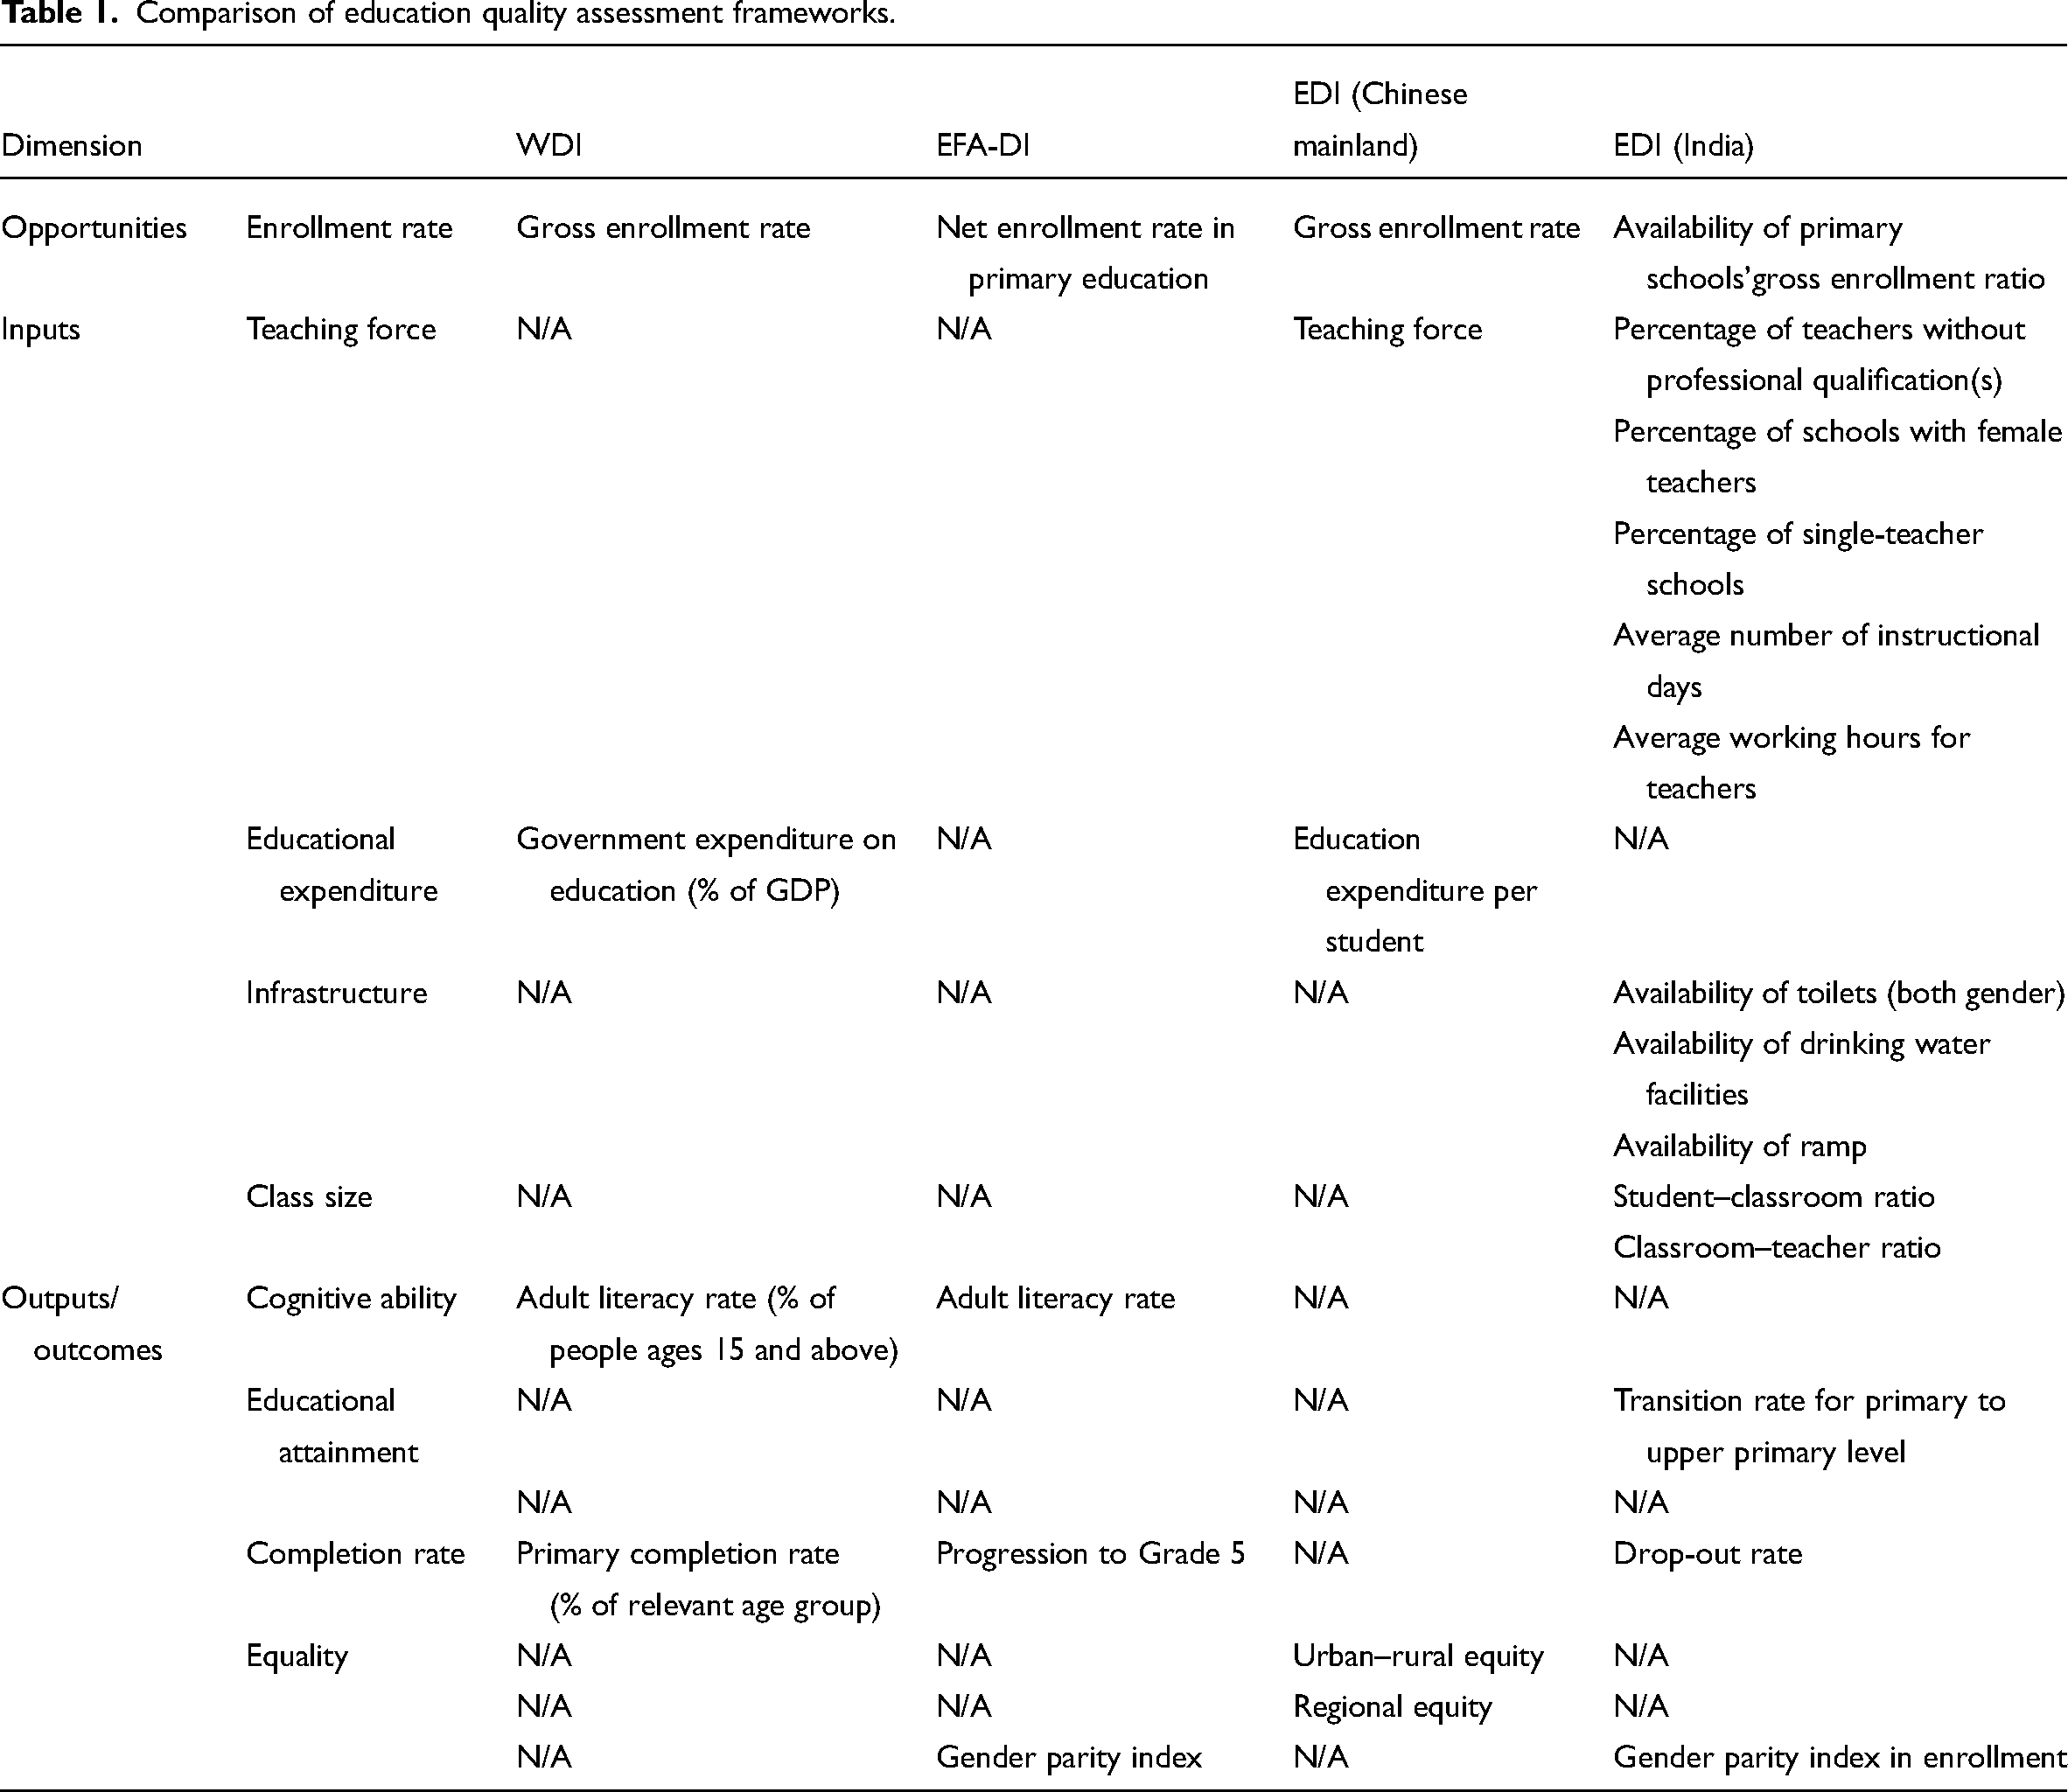
As illustrated in Table 1, those indices can generally be grouped into three categories: educational opportunities, educational inputs, and educational outputs/outcomes. While these frameworks capture important dimensions of education quality, opportunities exist to enhance their systematic organization and comprehensive coverage. For example, the EFA-DI and EDI (India) primarily concentrate on the development of primary education related to education opportunities. Regarding educational inputs, the WDI and EDI (Chinese mainland) primarily focus on public educational expenditure, with the EFA-DI does not incorporate input indicators, and the EDI (India) primarily assess the effectiveness of educational inputs based on availability of infrastructure. In terms of the educational outputs/outcomes, the WDI and EFA-DI measure cognitive ability and educational attainment through youth/adult literacy rates or primary completion rate, whereas the EDI (Chinese mainland) examines educational outputs from the perspectives of urban–rural and regional equity, and the EDI (India) emphasizes educational attainment and gender parity in basic education. Therefore, greater integration across these domains and inclusion of mediating process indicators could strengthen the analytical value.
In light of the previous frameworks, this study developed a Global Education Quality Index (GEQI) with key elements focusing on educational opportunities, processes, and outcomes. Firstly, in order to reflect the expansion of education as a global phenomenon and the subsequent shift in education evaluation from basic education to higher education as noted by Heyneman (2004), the GEQI includes indices regarding the availability of higher education opportunities. Secondly, the indices of educational processes are acquired from PISA data to fully monitor the processes of educational inputs and operations, including the teaching force, educational expenditure, availability of IT infrastructure, and class size. Lastly, regarding educational outcomes, the indices contain both short-term and long-term educational outcomes consistent to students’ competencies, pass rates, and educational attainment rates, providing a holistic view of the effectiveness of education systems.
Methodology and analysis
Data sources
Research data were obtained from publicly accessible databases managed by institutions including the World Bank, OECD, and UNESCO. Data spanning from 1950 and 2021 were compiled to create a comprehensive database encompassing education, economy, population, and other relevant indicators at the national (regional) level. Additionally, this study also integrated PISA data to assess each country's/region's educational performance and ultimately produced balanced panel data of 62 countries/regions covering the year of 2009, 2012, 2015, and 2018. Descriptive statistics of the key variables and their data sources are presented in Table 2.
Data sources and descriptive statistics.
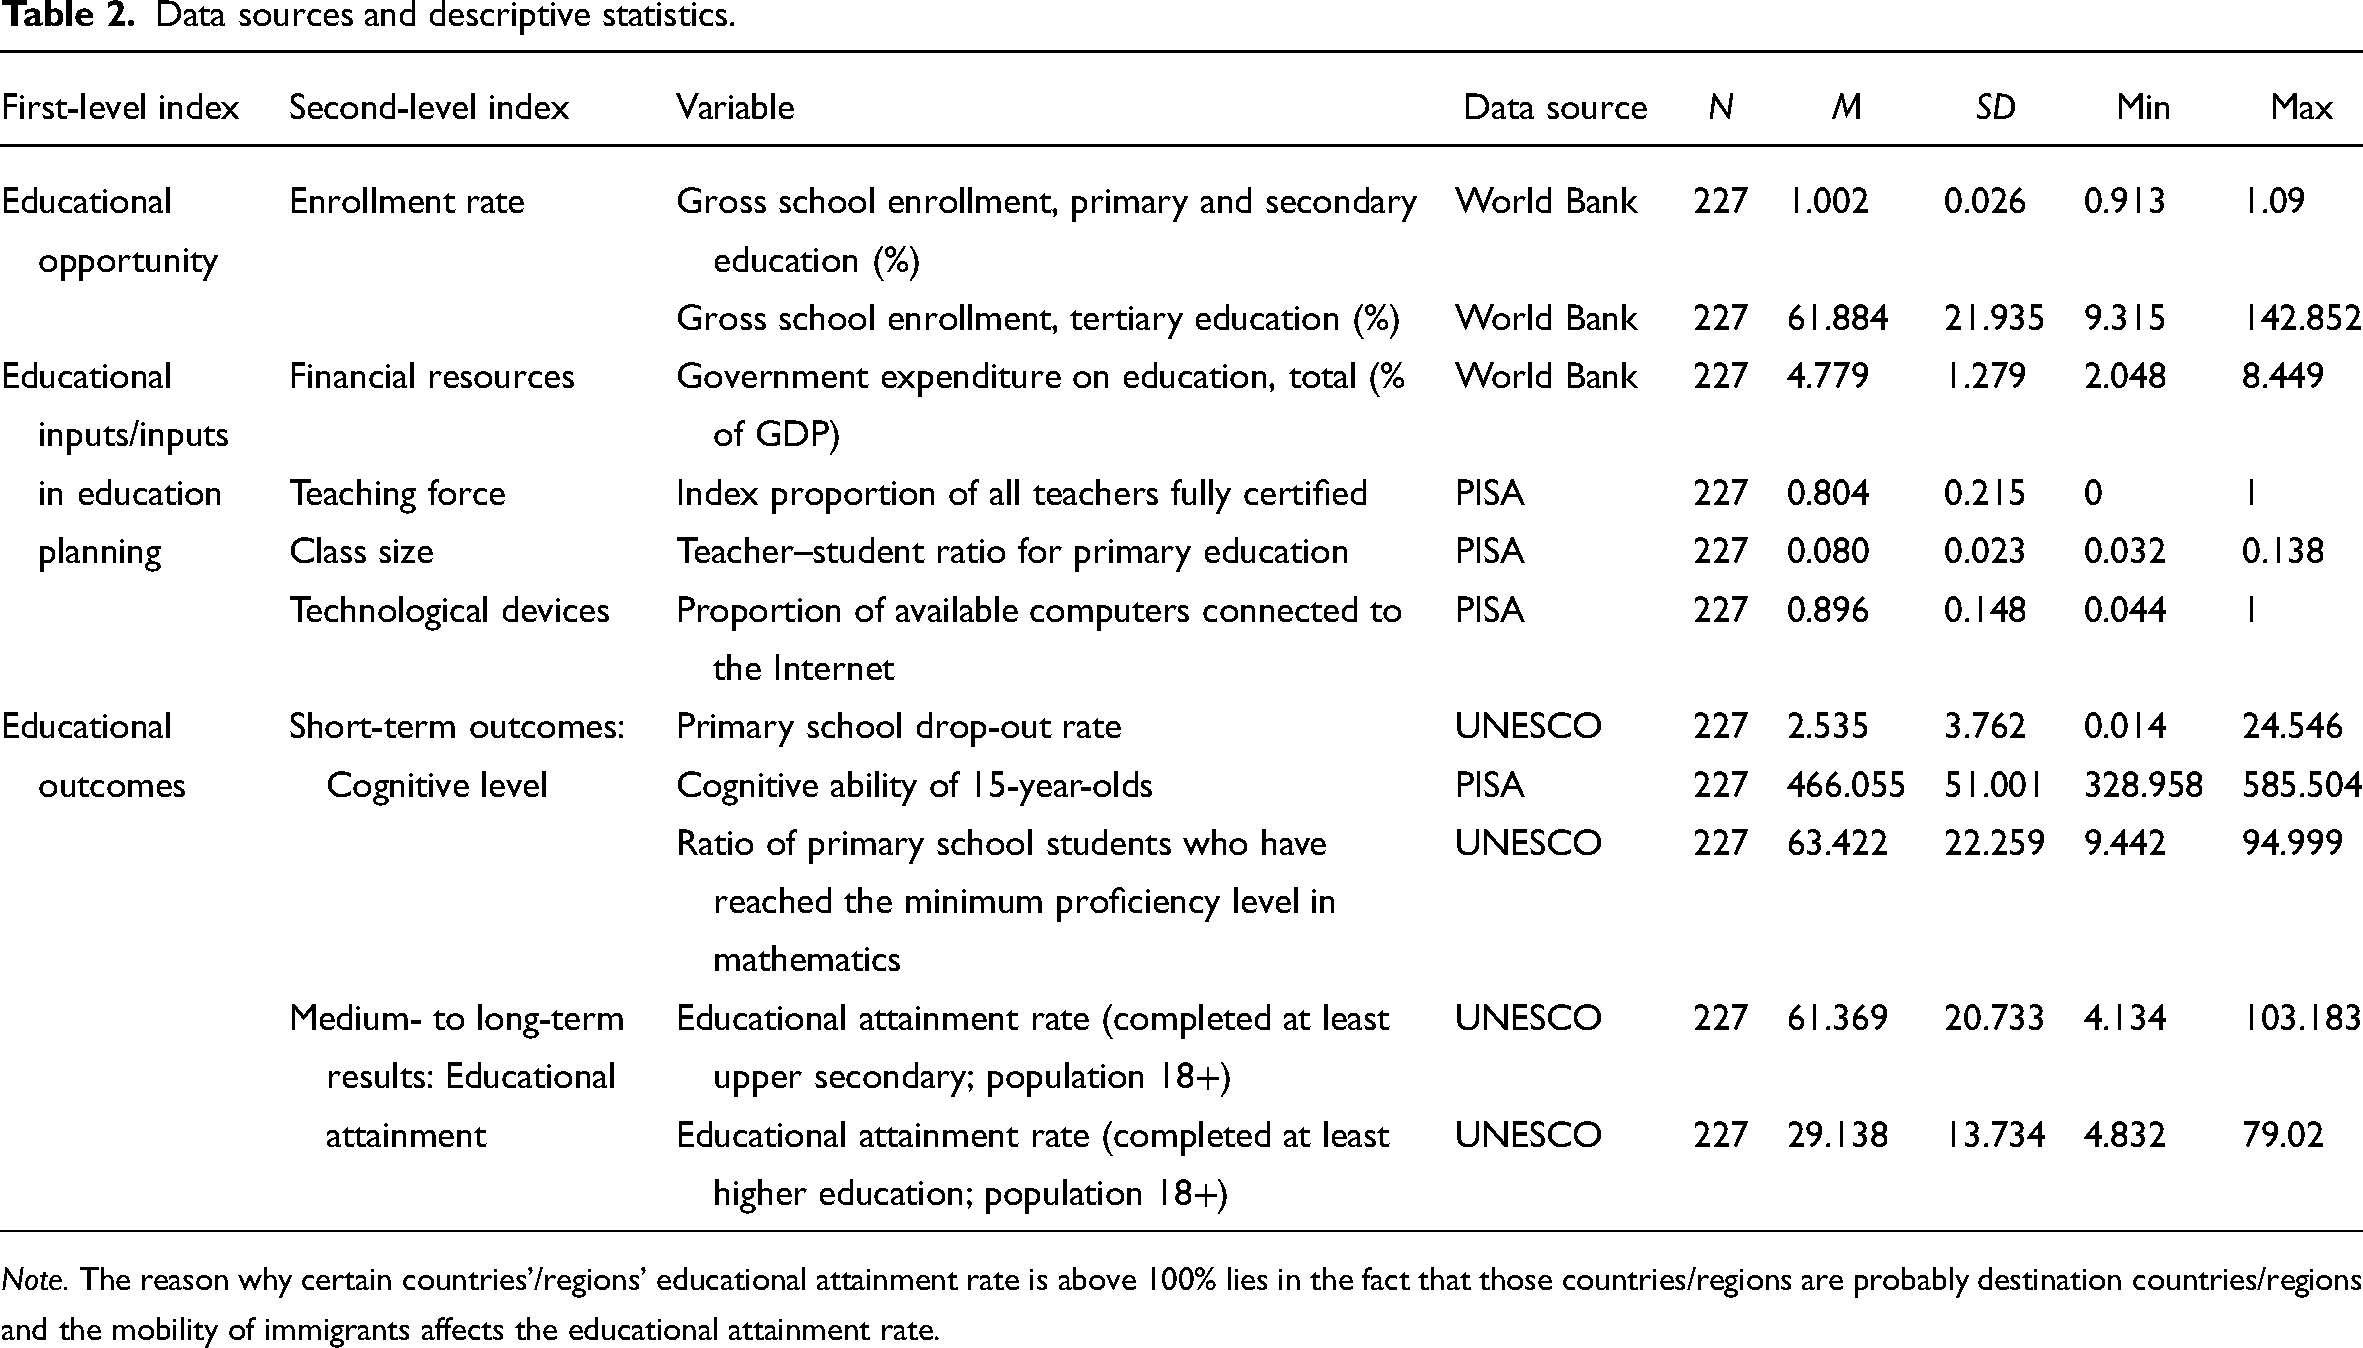
Note. The reason why certain countries’/regions’ educational attainment rate is above 100% lies in the fact that those countries/regions are probably destination countries/regions and the mobility of immigrants affects the educational attainment rate.
Research methods
The GEQI was developed to assess the overall educational development across countries/regions, covering the entire education stages from primary education to postsecondary education. Considering the intricate interplay among educational inputs, processes, and outcomes across different educational stages, this study employed Principal Component Analysis (PCA) to condense and simplify 11 indicators of educational quality into three principal components through orthogonal rotations.
As shown in Table 3, the overall Kaiser-Meyer-Olkin (KMO) value of 0.7414 exceeds the critical value, suggesting that the sample was appropriate for conducting factor analysis. Specifically, the three extracted principal component factors, Quality of Basic Education Assurance, Quality of School Education Operation, and Quality of Postsecondary Education Development, were suitable for representing the GEQI with a cumulative explained variance ratio reached 58.8%.
Results of Principal Component Analysis (PCA).
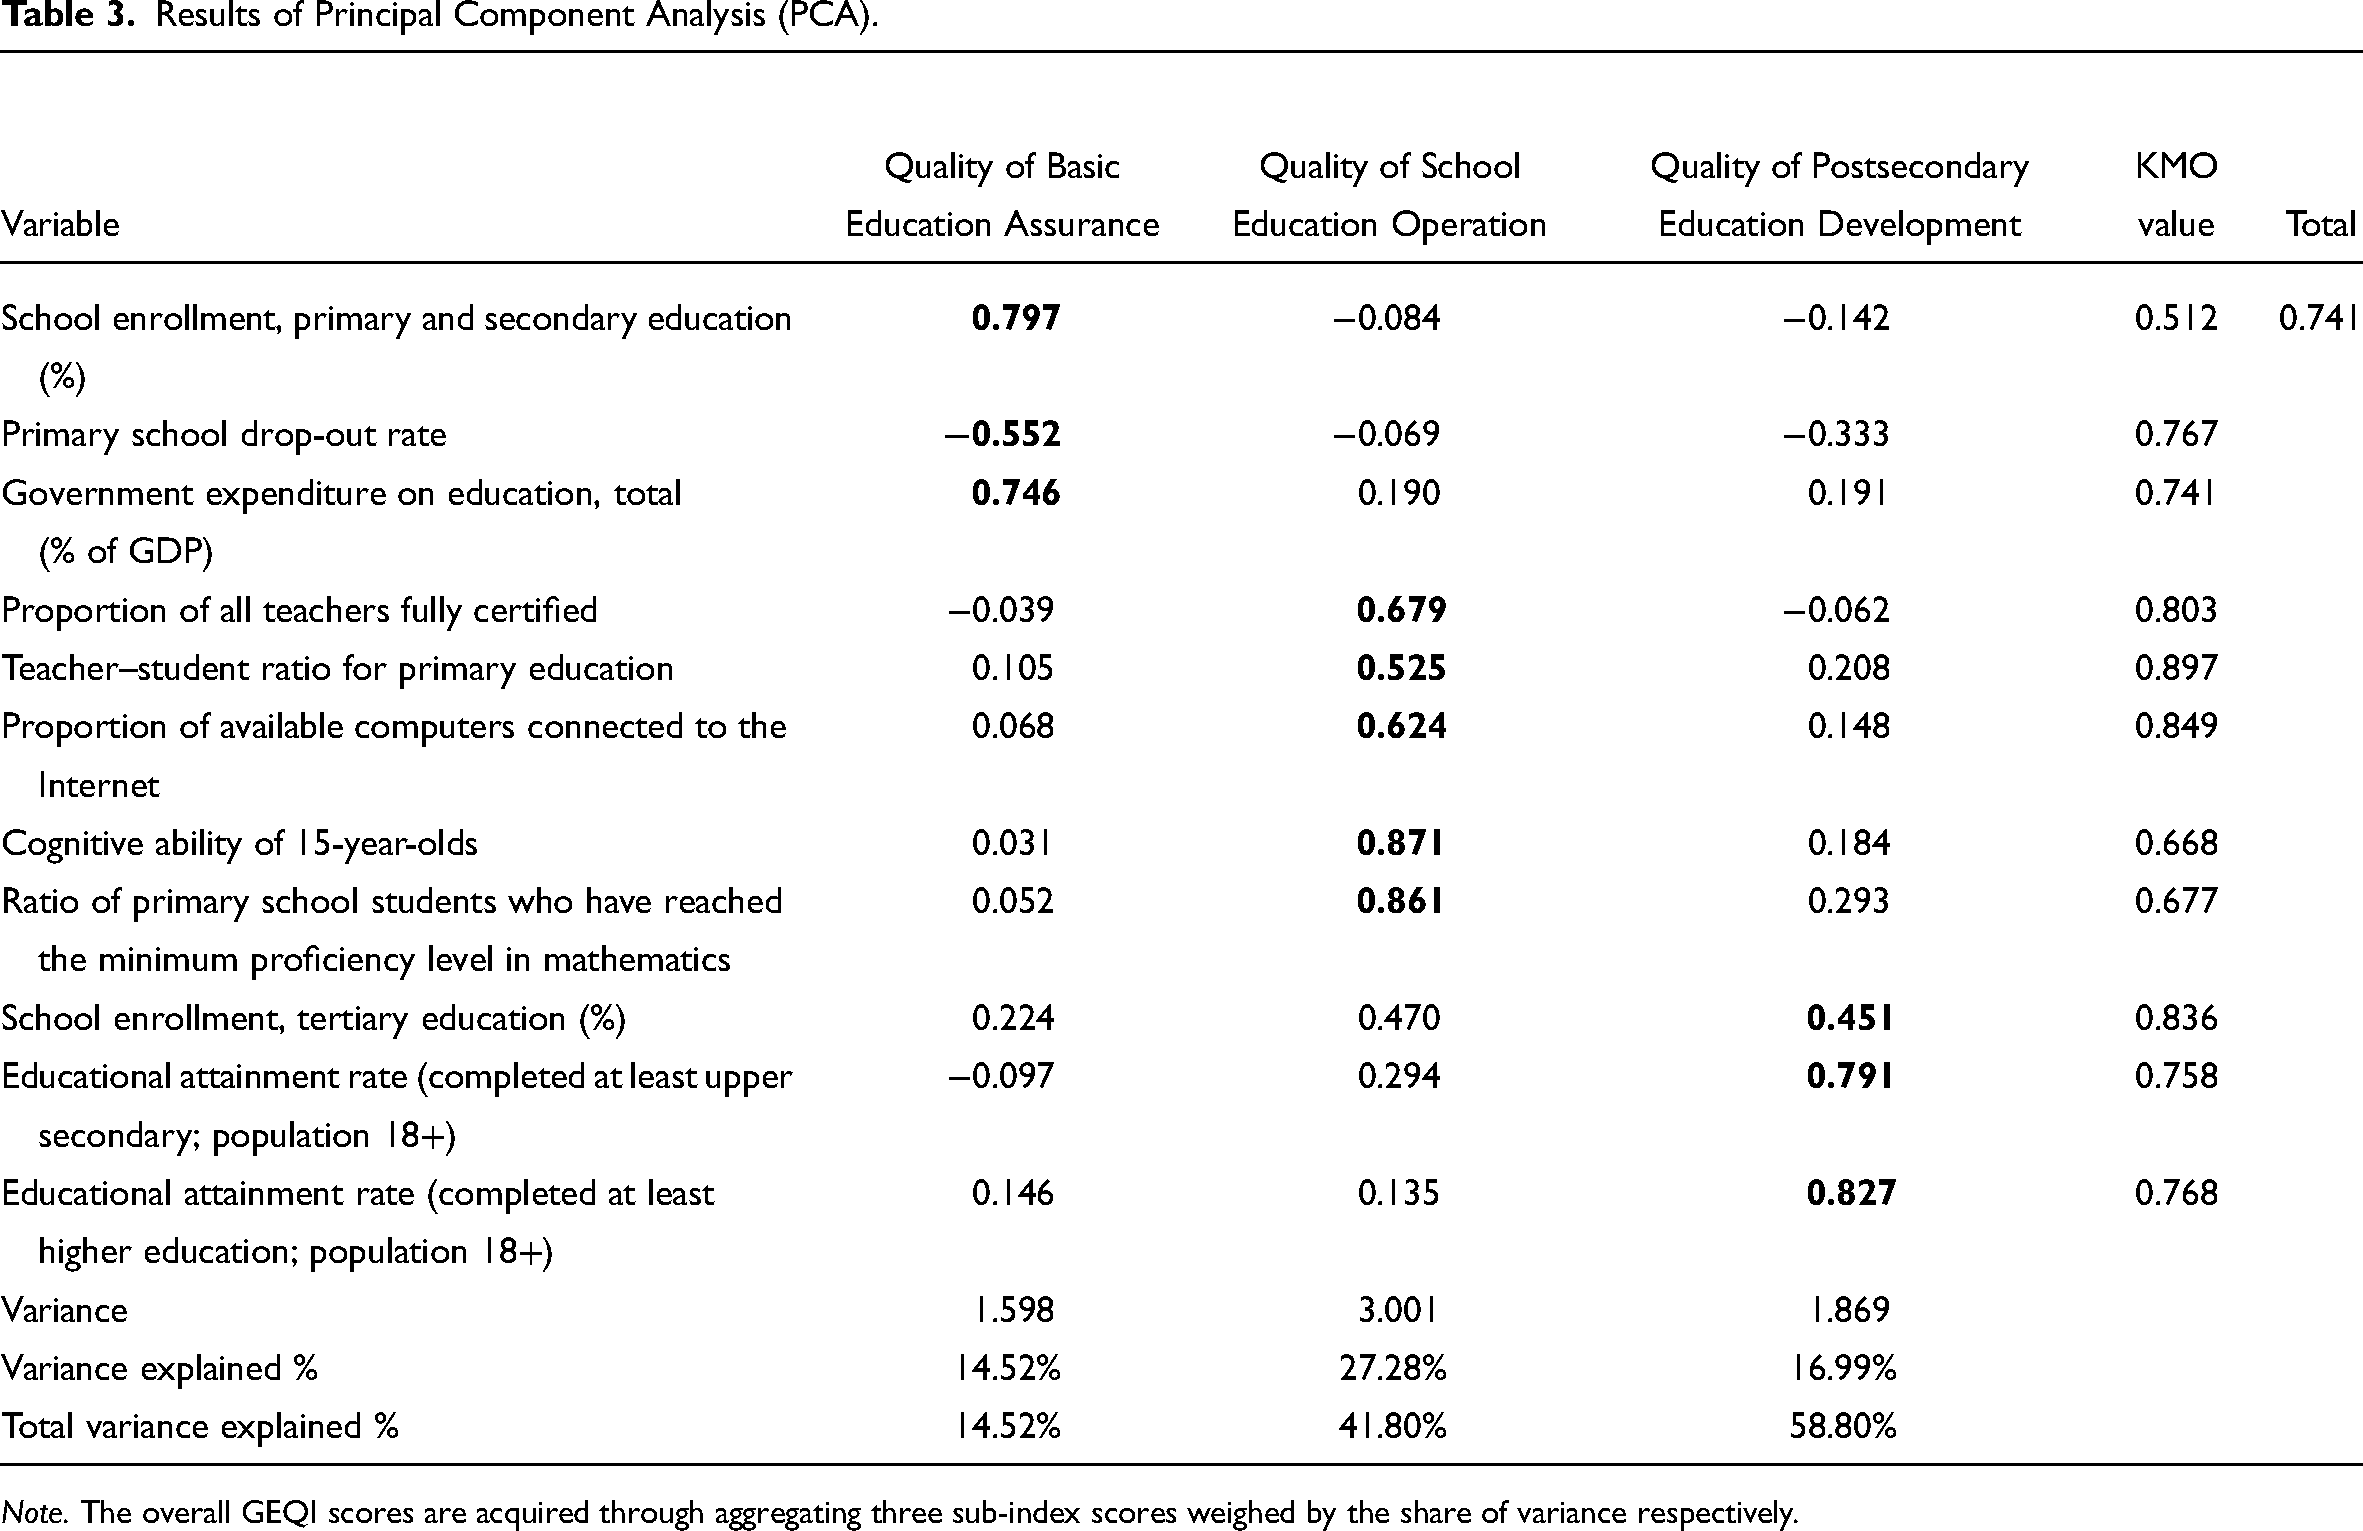
Note. The overall GEQI scores are acquired through aggregating three sub-index scores weighed by the share of variance respectively.
The first factor, termed as Quality of Basic Education Assurance, exhibited strong correlation with three indicators: gross enrollment ratios in primary and secondary education, government expenditure on education (% of GDP), and the primary education drop-out rate. These indicators highlight the accessibility of basic education and the government's commitment toward educational funding, providing backup for the high-quality and sustainability of the national education system.
The second factor, Quality of School Education Operation, was closely associated with the following five items: the proportion of certified teachers, teacher–student ratio, proportion of available computers, cognitive ability of 15-year-olds, and proportion of lowest math performance in secondary education. These items reflect the input of educational resources and the academic performance of students, indicating the operational efficiency and effectiveness of schools.
The third factor, termed as Quality of Postsecondary Education Development, was related to three indices—gross enrollment rate in tertiary education, educational attainment rate in secondary or higher education, and educational attainment rate in post-secondary or higher education—representing the accessibility of opportunities in secondary and higher education. These items measure the educational attainment and development at an advanced stage, reflecting the cultivation of specialized human capital and the proficiency of the skilled workforce.
Overall GEQI scores
The GEQI ranking reflects the overall strengths of these countries/regions in terms of educational investment, processes, and outcomes. As illustrated in Figure 1 and Table 4, high-income developed nations with stable societies dominate the top tiers on overall education quality. For instance, as renowned for their high-quality education systems and extensive educational opportunities, Finland, Belgium and Sweden, are particularly notable in securing the top three positions in global ranking. Other European countries, Slovenia and Iceland, also earn the position within the top ten. Among the 61 countries/regions assessed, those ranked in the middle to lower tiers are predominantly from Latin America, Central Asia, and Southeast Asia.
Moreover, other OECD Member countries, Belgium, Slovenia, New Zealand and Australia, share the similar characters in low population density and considerable monetary investment in public education, exhibit high competitiveness in global education quality comparison. It is worthy to mention that two newly independent states after the collapse of the Soviet Union, Belarus and Estonia, display extraordinary performance in education quality, placing 4th and 9th respectively.
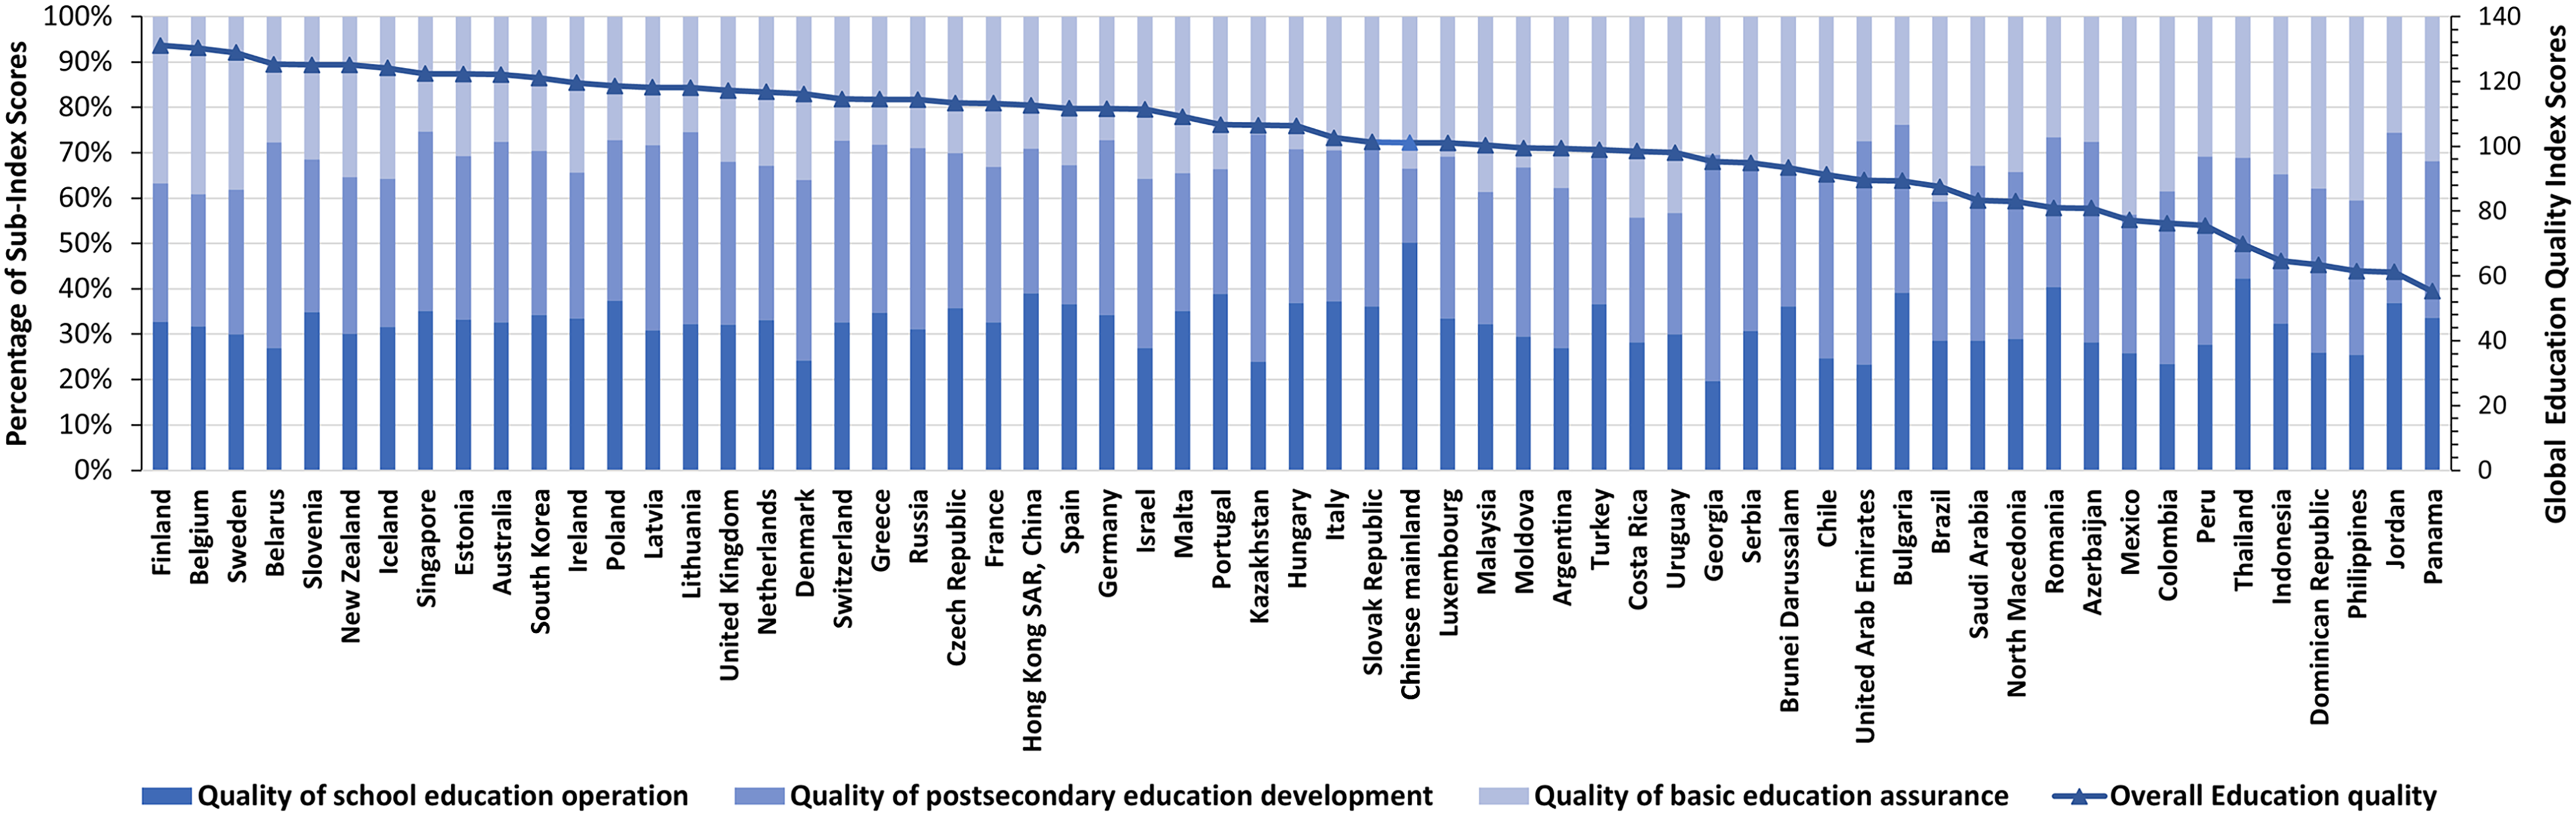
Overview of global education quality in 2018.
Overview of GEQI scores across different countries/regions in 2018.
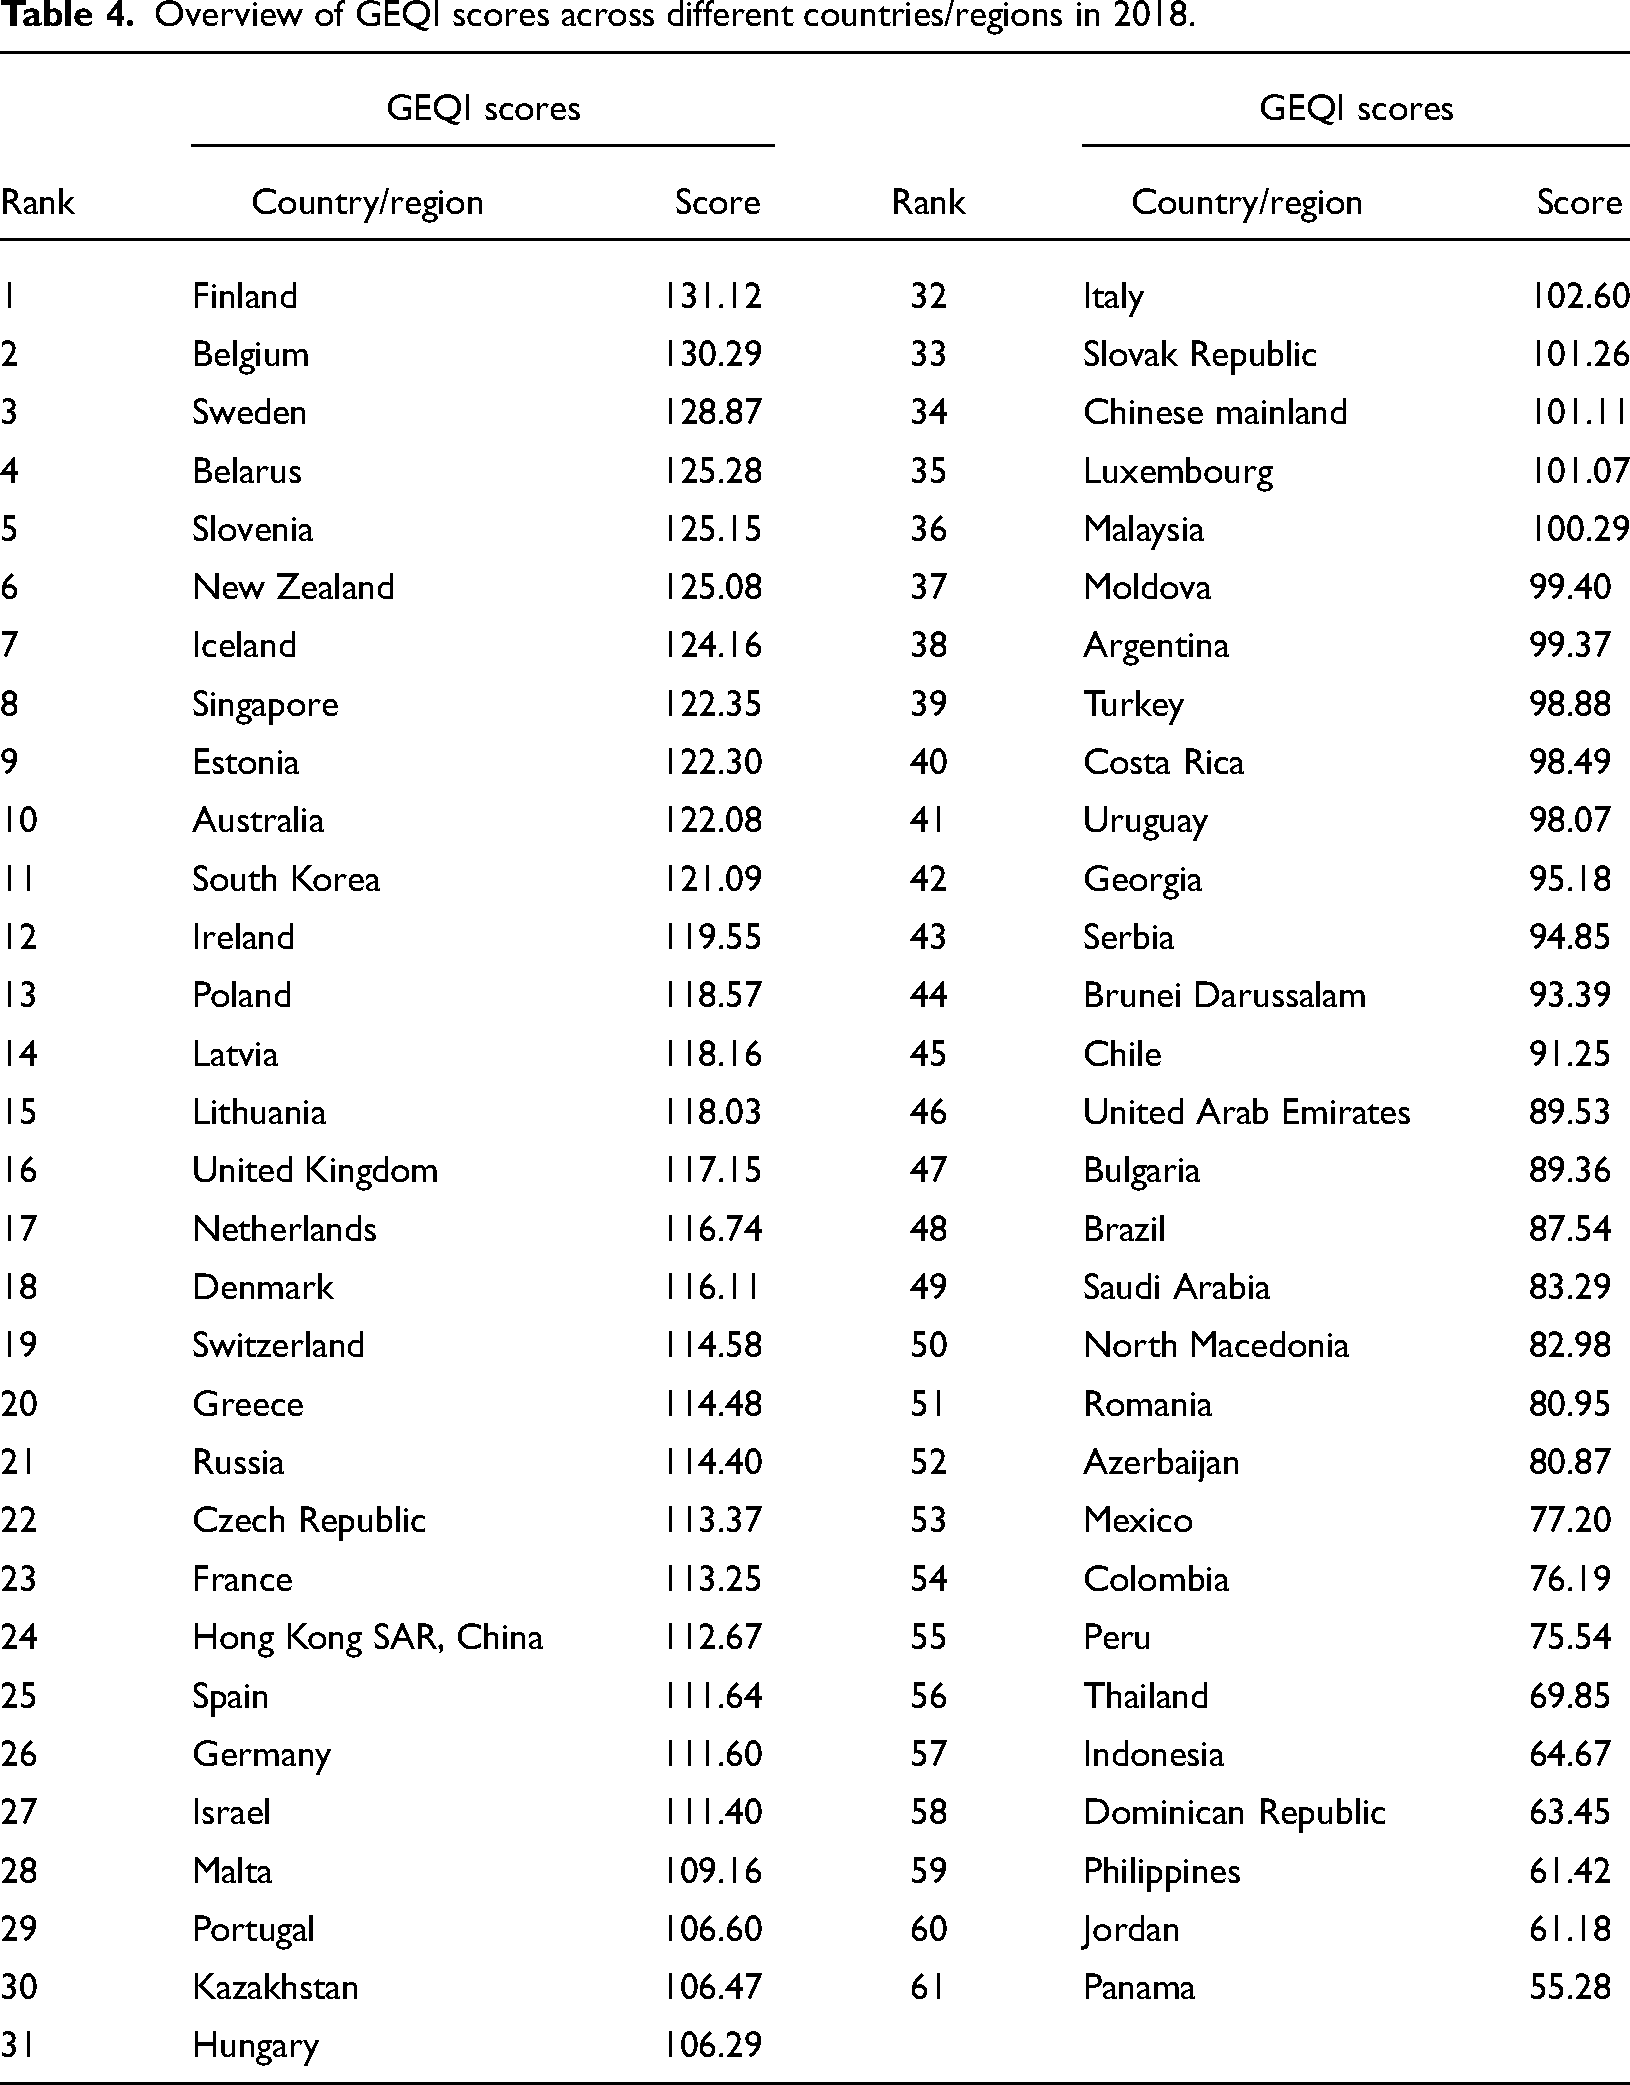
Newly independent states after the collapse of the Soviet Union like Belarus and Estonia showcase their relative educational advantages in global education quality ranking. Dolgaya et al. (2017) noted that the newly independent states have carried out profound reforms in education system after the collapse of Soviet Union. Despite the drawback identified in the insufficient supply of teaching staff and dwindling social prestige of the teacher's profession in certain countries (Dolgaya et al., 2017), the newly independent states' transition to new educational forms contribute to their robust and thriving education quality.
Despite traditionally remarked by excellent performance in international academic competition among Confucian dominated East Asian sphere, Singapore stands as the only East Asian state ranked among the global top 10 in education quality, consistent with its sustained high performance in PISA assessments. Whereas other East Asian societies like South Korea, Hong Kong SAR, and Chinese mainland, despite sharing similar cultural emphases on education and demonstrating strong outcomes in international standardized tests, exhibit moderate overall rankings (South Korea at 11th, Hong Kong SAR at 24th, and Chinese mainland at 34th).
Sub-index scores of education quality
Acquired from Principal Component Analysis (PCA), three sub-indices, Quality of Basic Education Assurance, Quality of School Education Operation, and Quality of Postsecondary Education Development, jointly reflect the inner structure of the GEQI and represent different characteristics of the GEQI related to Quality of Basic Education Assurance, Quality of School Education Operation, and Quality of Postsecondary Education Development.
Table 5 presents the sub-index scores in 2018 and shows that European Union countries consistently scored high across all dimensions while other regions exhibit uneven patterns among sub-index ranking, demonstrating the distinguishing educational features among different countries.
Sub-index scores of global education quality in 2018.
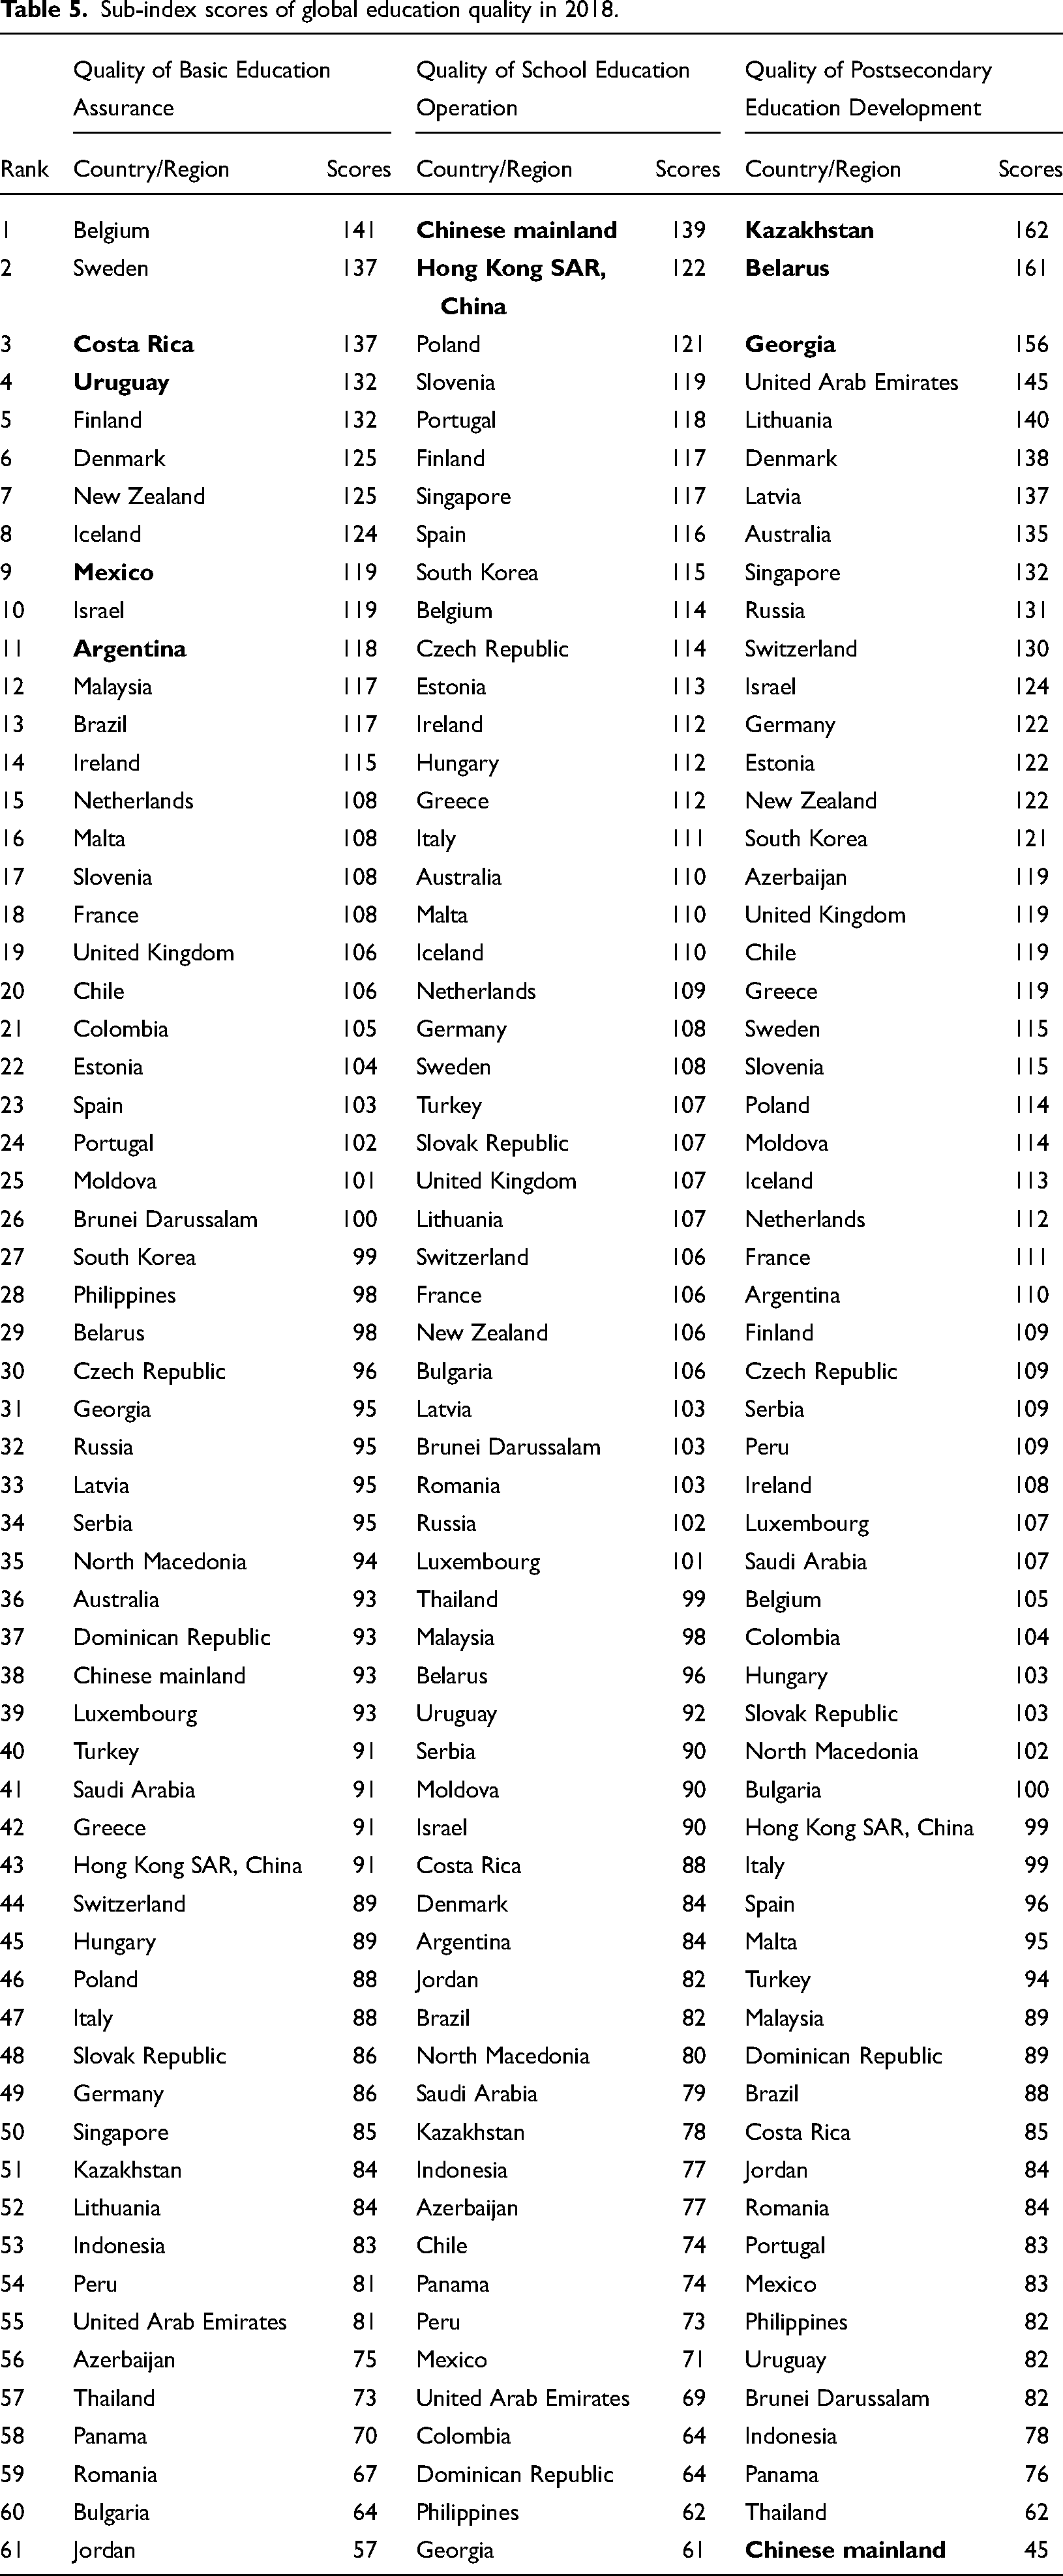
Quality of Basic Education Assurance not only reflects the countries' overall economic and cultural strength but also signaling governments' commitment in building the basic education through multiple countermeasures. In addition to the outstanding European Union countries, idiosyncratic findings are drawn as several Latin America countries (e.g., Costa Rica, Uruguay, Mexico, Argentina, and Brazil, etc.) stand out. Their success stems from shared strategies like Conditional Cash Transfer (CCT) policies, which prioritize access to education and formation of human capital.
These welfare policies, pioneered in Latin America and later adopted across Asia and Africa, target basic school attainment and explain why certain developing countries achieve a relatively higher rank in this dimension. Aiming at alleviating poverty and prompting development, CCT is a widely adopted social policy tool in developing countries. Its core mechanism involves providing cash subsidies to impoverished families while requiring them to fulfill specific conditions related to their children's education and health, thereby alleviating short-term poverty and promoting human capital accumulation (Ferreira et al., 2012). Extensive empirical research confirms that CCT policies significantly improve citizens' access to basic education, despite their heterogeneous effects (Barrera-Osorio et al., 2011; Ferreira et al., 2012).
The ranking regarding the Quality of School Education Operation highlights several countries with long-standing emphasis on children's education. Compared to the European counterparts, East Asian countries/regions (e.g., Chinese mainland, Hong Kong SAR, Singapore, and South Korea) stands out as the competitive unit and reflects their cultural emphasis on education performance.
Driven by Confucian cultural norms (Marginson, 2011), East Asian countries/regions (e.g., Chinese mainland, Hong Kong SAR, Singapore, and South Korea) demonstrate significant advantages in the Quality of School Education Operation, which can be partly attributable to their fierce educational competition and excellent performance in international cognitive assessment. The Confucian Model coupled with tournament mindset compels the stakeholders in the cultural circle to chase after each other in educational track and simultaneously shape the educational structure to reinforce this process. Therefore, East Asian countries/regions generally allocate resources to facilitate the operation of education and motivate students' academic efficiency, boosting their performance in this metric.
In terms of the third sub-index—Quality of Postsecondary Education Development, in addition to the OECD member countries (e.g., Denmark, Australia, Singapore), several countries (e.g., Kazakhstan, Belarus, Georgia) have garnered attention for their outstanding performance in the Quality of Postsecondary Education Development. Their excellent performance in this dimension can partly attribute to the Bologna Process and national demographic trait.
Aiming at transforming European higher education into a cohesive, competitive, and student-centered system, the Bologna process provides the Central and Eastern European countries an opportunity for the Europeanization of higher education (Szolár, 2011). Through rescheduling the program structure (Cappellari & Lucifora, 2009), enhancing student mobility (Papatsiba, 2006), and prioritizing quality, Bologna process not only established the integrated and coherent European Higher Education Area (EHEA), but also promoted the development of tertiary education for participated developing countries.
In addition, the national demographic trends also determine the Quality of Postsecondary Education Development, among which, Chinese mainland is a compelling case in explaining why population structure matters in this metric. According to Table 5, Chinese mainland obtained a score of 45, ranking at the bottom of the list. Despite the remarkable surge in the gross enrollment rate in higher education (Yeung, 2013), the principal beneficiaries of the higher education expansion in Chinese mainland were mainly those born under the one-child policy between the 1980s and 2000s, who are comparatively a minority group under the contemporary aging population structure. Thus, the progress in higher education enrollment for younger generation matters less for the overall situation (Niu, 2021). As a result, Chinese mainland ranked relatively low in terms of the Quality of Postsecondary Education Development globally.
Conclusion and implications
Conclusion
This study constructs the Global Education Quality Index (GEQI) based on “Educational Input-Process-Outcome” framework. We assess education quality and development across 62 countries/regions, primarily focusing on 2018 data. Our findings map global education quality and identify priority areas for systemic improvement.
In terms of the index construction, the GEQI encompasses three components: Quality of Basic Education Assurance, which measures the accessibility of basic education and the government's commitment to education construction; Quality of School Education Operation, which evaluates the input of educational resource and the academic performance of students; and Quality of Postsecondary Education Development, which measures educational attainment and development at advanced and professional stage.
Descriptive findings reveal that European Union countries generally dominate the GEQI rankings, among which, Finland, Belgium, and Sweden, are particularly notable for their salient top positions at GEQI rankings. Furthermore, Asian and Oceanian nations like Singapore, South Korea, Australia, and New Zealand also rank highly, reflecting robust education systems. Commonwealth Nations (e.g., Australia, New Zealand, and Singapore) and newly independent states after the collapse of the Soviet Union (e.g., Belarus and Estonia) also rank prominently, reflecting their competitive academic performance.
Specifically, while European Union countries excel across all dimensions, other regions show distinct patterns. The sub-index analysis reveals uneven regional performance and therefore reveals the impact of unique education practice and cultural context on education quality. First, insights emerged from the outstanding performance regarding the Quality of Basic Education Assurance of several Latin American countries (e.g., Costa Rica, Uruguay, Mexico, Argentina, and Brazil, etc.). The Conditional Cash Transfer policies they adopt ensured the basic school attainment and therefore improved their education quality. Second, Confucian cultural norms propel East Asian units (e.g., Chinese mainland, Hong Kong SAR, Singapore, South Korea) to hold the leadership in the Quality of School Education Operation. Their success partly stems from the intensive input concerning education infrastructure and exceptional cognitive performance at the global level. Third, several countries (e.g., Kazakhstan, Belarus, Georgia) have garnered attention for their outstanding performance in the Quality of Basic Education Assurance development due to the relatively rapid advancements in postsecondary education under the Bologna process.
Implications
Drawing on the descriptive analysis, we derive key recommendations from both the construction of GEQI and its operation.
First, in terms of how to establish a robust and scientific education quality framework, the theoretical framework and selection of critical metrics matter. In order to evaluate the educational quality from a holistic view, we follow the three-stage “inputs–process–outputs” logic rather than merely emphasizing the educational outcomes. Meanwhile, the study addresses the challenges of double counting and weight bias by employing principal component factor analysis. This technique ensures the integrity of the educational quality framework while reducing potential assessment bias.
Second, it is crucial to increase the public funds for education to meet the minimum objectives, as countries that invest more in education generally achieve higher scores in education quality. The European Union countries typically dominate across the overall education quality and sub-index, indicating the necessity in promoting education equality through sustained educational investment. Since financial resources are essential for substantially improving the quality of education and the entire education system, developing countries should increase the public expenditure and avoid the financial shortage in basic education.
Third, the success of the CCT programs in Latin American countries proves that ensuring the educational attendance is a priority in improving basic education quality. Although compulsory education laws have been implemented globally, basic education assurance scores remain suboptimal for some countries since their rising school attrition undermines the basic education assurance scores. Targeting the resolution of those dilemmas, CCT improves the next generation's access to education and strengthens families' continuous investment in education through dynamic incentive mechanisms, thereby curbing attrition even in dropout-prone communities.
Fourth, the experience of highly ranking position in Quality of Postsecondary Education Development for Central and Eastern European countries demonstrate the positive power of cross-border collaboration. The education program (e.g., Bologna process) initiated by advantage countries or units can provide developmental opportunities for the underachiever and bring them more opportunity to promote the national education system.
Limitations
Our reliance on PISA indicators for assessing school education operations introduces measurement constraints. Specifically, we adopted PISA indicators to evaluate educational outcomes across countries/regions, which may cause bias in assessing education performance. While PISA's global recognition enabled cross-regional educational outcome comparisons, its sampling approach risks representing overall national education performance. For instance, the absence of universally standardized cognitive assessment tools compelled our use of this dataset for international benchmarking. However, PISA's selective school sampling across participating countries/regions fails to represent national education systems comprehensively. Thus, the interpretation of the results should be approached with caution, as the index in the Quality of School Education Operation has limited capacity to fully capture the overall situation across the entire country.
Footnotes
Authors’ note
The data used in this research are confidential and are available from the author upon reasonable request.
Yan Cao is currently an Associate Professor in the School of Education at the University of Guangzhou, and her professional email address is
Contributorship
Yan Cao conceived the study, designed the analytical framework, supervised data collection and cross-national analysis, and coordinated the research; Xinyue Yao conducted partial data analysis, drafted the manuscript (including the abstract and main body), finalized the paper, and addressed reviewers’ comments; Guoyang Zhang contributed to initial data collection, merging, preliminary analysis, and the literature review.
Declaration of conflicting interests
The authors declared no potential conflicts of interest with respect to the research, authorship, and/or publication of this article.
Funding
The authors received no financial support for the research, authorship, and/or publication of this article.