
Abstract
Purpose
This study explores the role of education in fostering middle-income earners in China, elucidating the development and current status of the capabilities of education in this regard. This study uses the historical changes in this demographic in the United States as a frame of reference to explore future goal-setting and implementation pathways for expanding the middle-income group through education in China.
Design/Approach/Methods
This study uses data on variables such as income, educational attainment, and years since graduation from the China Family Panel Studies database to analyze the changing patterns in China's middle-income group regarding educational attainment. This study also uses data from the Panel Study of Income Dynamics to examine the historical changes in the middle-income group in the United States and compares the findings to those in China.
Findings
Results reveal the following: the changing patterns in the share of the middle-income group relative to educational attainment; the distribution of the low-, middle-, and high-income groups by educational attainment; the changing trends in the share of middle-income group by educational attainment between 2012 and 2018; and the changing trends in the share of middle- and high-income groups by educational attainment regarding the number of years since graduation.
Originality/Value
Rooted in and driven by current issues facing China, this study compares education in China and the United States and offers preliminary evidence of the role of education in expanding the middle-income group.
Introduction
Of the 101 middle-income economies in 1960, only 13 had developed into high-income economies by 2008. Indeed, over nearly five decades, most of these economies failed to escape the middle-income trap (Joint Research Group of the World Bank and the Development Research Center of the State Council, the People's Republic of China, 2013). Susceptibility to the middle-income trap appears to be rooted in the presence of an excessive income gap, which hinders the development of an adequately sized and stable middle-income group. The leapfrog period in which a middle-income society becomes a high-income one is characterized by a shift from high-speed to moderate economic growth and the dwindling importance of investment and export for growth, with consumer demand evolving into a crucial driver of sustained economic growth. Given their considerable spending power and high marginal propensity to consume, the middle-income group—if adequately sized and stable—will become indispensable in fueling economic growth. Therefore, expanding the size of the middle-income group is vital to a country's socioeconomic development.
In expanding the middle-income group, strategic focus is placed on promoting equal opportunities for development and enhancing the human capital of this group to improve their income levels by boosting their abilities to create wealth (Liu, 2022). Experiences from other countries indicate that preemptively ensuring the fair distribution of educational opportunities is more effective than rectifying the income gap through the redistribution of wealth at a later stage (Ma, 2022). Therefore, the development of education is a decisive factor in the expansion of the middle-income group (Jia, 2022; Ma, 2022; Yang, 2022a; Yao, 2022). To overcome the middle-income trap, it is crucial to promote universal access to education and improve the quality of education continuously. Thus, members of the wider public can enjoy and engage in quality and equitable educational opportunities and processes, strengthen their human capital, and produce and create wealth more efficiently. Consequently, their earning power and income levels rise beyond the middle-income threshold while continuing to grow the social wealth “pie.”
This raises the question of how education—a key factor influencing the expansion of the middle-income group—should be organized. To answer this question, this study uses empirical data to grasp the current capabilities of education to create middle-income earners in China, as well as the past patterns of change in this respect. Additionally, in view of China's national target of doubling the size of its middle-income group by 2035, this study employs historical changes in the middle-income group in the United States as a frame of reference to explore future goal-setting and implementation pathways for expanding the middle-income group through education in China.
Middle-income group
The socioeconomic characteristics, attitudes, and dispositions of the middle-income group have become important indicators for determining socioeconomic development trends, the characteristics of social structures, and the extent of income inequality. The middle-income group is typically defined based on two models: the absolute and relative standard models (Li, 2017; Liu, 2022). The absolute standard model determines the upper- and lower-income limits of the middle-income group based on the income necessary to maintain a certain standard of living (Kharas, 2010; Kochhar, 2021). Conversely, the relative standard model defines the boundaries of the middle-income group based on the median of income distribution, with the lower-income limit often set at 50% or 75% of the median income and the upper income limit at 125% or 200% (Birdsall et al., 2000; Grabka et al., 2016). The absolute model is useful for reflecting the changing trends and growth rate of the number of individuals reaching a certain level of income and their share in the larger population. Furthermore, it helps draw direct comparisons between the situations in different countries. Meanwhile, the relative model is representative of any increase or decrease in the number and share of individuals whose income falls in the middle range, making it instrumental for illustrating trends in income inequality.
This study has two objectives. First, it traces the changing trends in the absolute income growth of China's population according to educational attainment and predicts development trends. Second, it compares these findings with trends in the United States, using this developed country as a point of reference to reflect on China's future education policies. Accordingly, this study adopted the absolute standard model to define the middle-income group. In 2018, the National Bureau of Statistics of China (NBSC) identified middle-income households as typically three-person households that earn an annual income of RMB 10,0000–50,0000 (Li, 2021; Liu, 2022; Yang, 2022b). This standard can better capture the Chinese population's expectations for the income needed to achieve a moderate standard of living. Therefore, this study defines the middle-income group as comprising individuals whose annual income falls between RMB 33,300 and RMB 166,700.
Data and methods
Data sources
The data used in this study were mainly obtained from the China Family Panel Studies (CFPS), a national and comprehensive social panel study developed and conducted by a team at Peking University. The CFPS targeted households across 25 province-level administrative regions in China, with all individual members of the sample households responding to the survey (Xie & Lu, 2015). In 2010, the CFPS team conducted an official baseline survey of 14,960 households, interviewing 33,600 adults and 8,990 adolescents. Subsequently, full-sample follow-up surveys were conducted every two years. This study mainly used the statistical results of four of these follow-up surveys—CFPS 2012, 2014, 2016, and 2018.
For contrast and comparison with relevant data and analytical results specific to China, this study obtained data from the Panel Study of Income Dynamics (PSID) database. Developed and conducted by the University of Michigan since 1968, the PSID is the longest-running household panel survey in the world (official website: https://psidonline.isr.umich.edu/). Providing a nationally representative sample for the United States, the PSID is the most authoritative study of the economic issues faced by American households. The sample size has increased over time from over 18,000 individuals from 5,000 households in the first survey to more than 75,000 individuals from over 9,000 households in the 2013 survey.
Variables
This study examined the following variables: income, income class, educational attainment, and years since graduation. First, for income, this study employed the variable defined in the CFPS household economic dataset—“net household income per capita.” While net household income refers to gross household income minus the cost of agricultural production, net household income per capita represents net household income divided by household size. When extracting income variables from the PSID database, the preexisting variables were processed to ensure the maximum comparability of statistical standards with the CFPS. In this respect, “total family money income,” a variable from the PSID household dataset, has a similar definition—the total income of all family members over the last year—and identifies many of the same types of income as the CFPS (Panel Study of Income Dynamics, 2014). However, as the PSID variable measures pre-tax income, this study subtracted two variables representing the income tax payable by the main respondent, their spouse, and all other household members over the past year. The estimated after-tax income was then divided by the total number of household members to obtain a variable equivalent to “net household income per capita” used in the CFPS.
Second, this study identified and generated “income class” as a categorical variable. According to the definition of the middle-income group adopted by this study (i.e., households with a per-capita annual income of RMB 33,300–166,700), individuals whose annual household income per capita was lower than RMB 33,300 were assigned a value of 0, indicating that they were in the low-income group. Those whose annual household income per capita was greater than or equal to RMB 33,300 but less than or equal to RMB 166,700 were given a value of 1, indicating that they were in the middle-income group. Furthermore, individuals whose annual household income per capita was greater than RMB 166,700 were assigned the value of 2, indicating that they were in the high-income group. For the PSID database, to determine who fell into the middle-income range, this study converted the NBSC's (2018) definition of the middle-income group into the corresponding income in U.S. dollars based on the 2017 purchasing power parities (PPPs; PPP-based actual individual consumption = 4.046) (Fu & Hamadeh, 2021). Accordingly, this study defined the middle-income range as USD 8,238–41,193 a year.
Third, regarding educational attainment, this study adopted the CFPS variable reflecting the highest level of education completed by respondents in the year of the survey. Based on this variable, educational attainment was summarized into the following categories: illiterate, semi-literate, elementary school, junior high school, senior high school (including regular senior high school, secondary vocational school, technical school, and senior vocational high school), junior college, and undergraduate or above. Notably, tertiary education was combined under a single category because the sample size for master's and doctoral graduates was relatively small and analyzing them separately may have hindered robustness. In terms of the PSID, this study converted two variables—“education of head” and “education of wife”—into the educational attainment variable. Based on the U.S. education structure, educational attainment of “junior high school or below” refers to individuals who had completed less than 12 years of education; “senior high school” refers to those who had completed 12 years of education but had not received higher education. Furthermore, “community college” refers to those who had received higher education but had not obtained a bachelor's, master's, or doctoral degree; “undergraduate or above” refers to individuals with a bachelor's degree or higher.
Fourth, this study defined and generated data for the variable of years since graduation by subtracting the last year that the respondent attended school from the year of data collection. In the CFPS, “year of leaving school” reflected the year in which the respondent last attended school.
Sample weights
The CFPS and PSID are large-scale, nationally representative surveys of the Chinese and U.S. populations, respectively. Using these databases, researchers can draw inferences about the general population from the sample data through various methods, including the design of sampling programs and weighting of sampling units. To generate final results that could better reflect the general situation of China and the United States, this study weighted the samples across all data analyses. Among the sample weights provided by the CFPS database, this study selected the cross-sectional individual weights for the total sample each year based on actual research needs (Wu, 2017; Xie, 2017). For the PSID (2014) database, this study used the cross-sectional family weights for the total sample for each year.
Findings
Changes in the proportion of the middle-income group by educational attainment
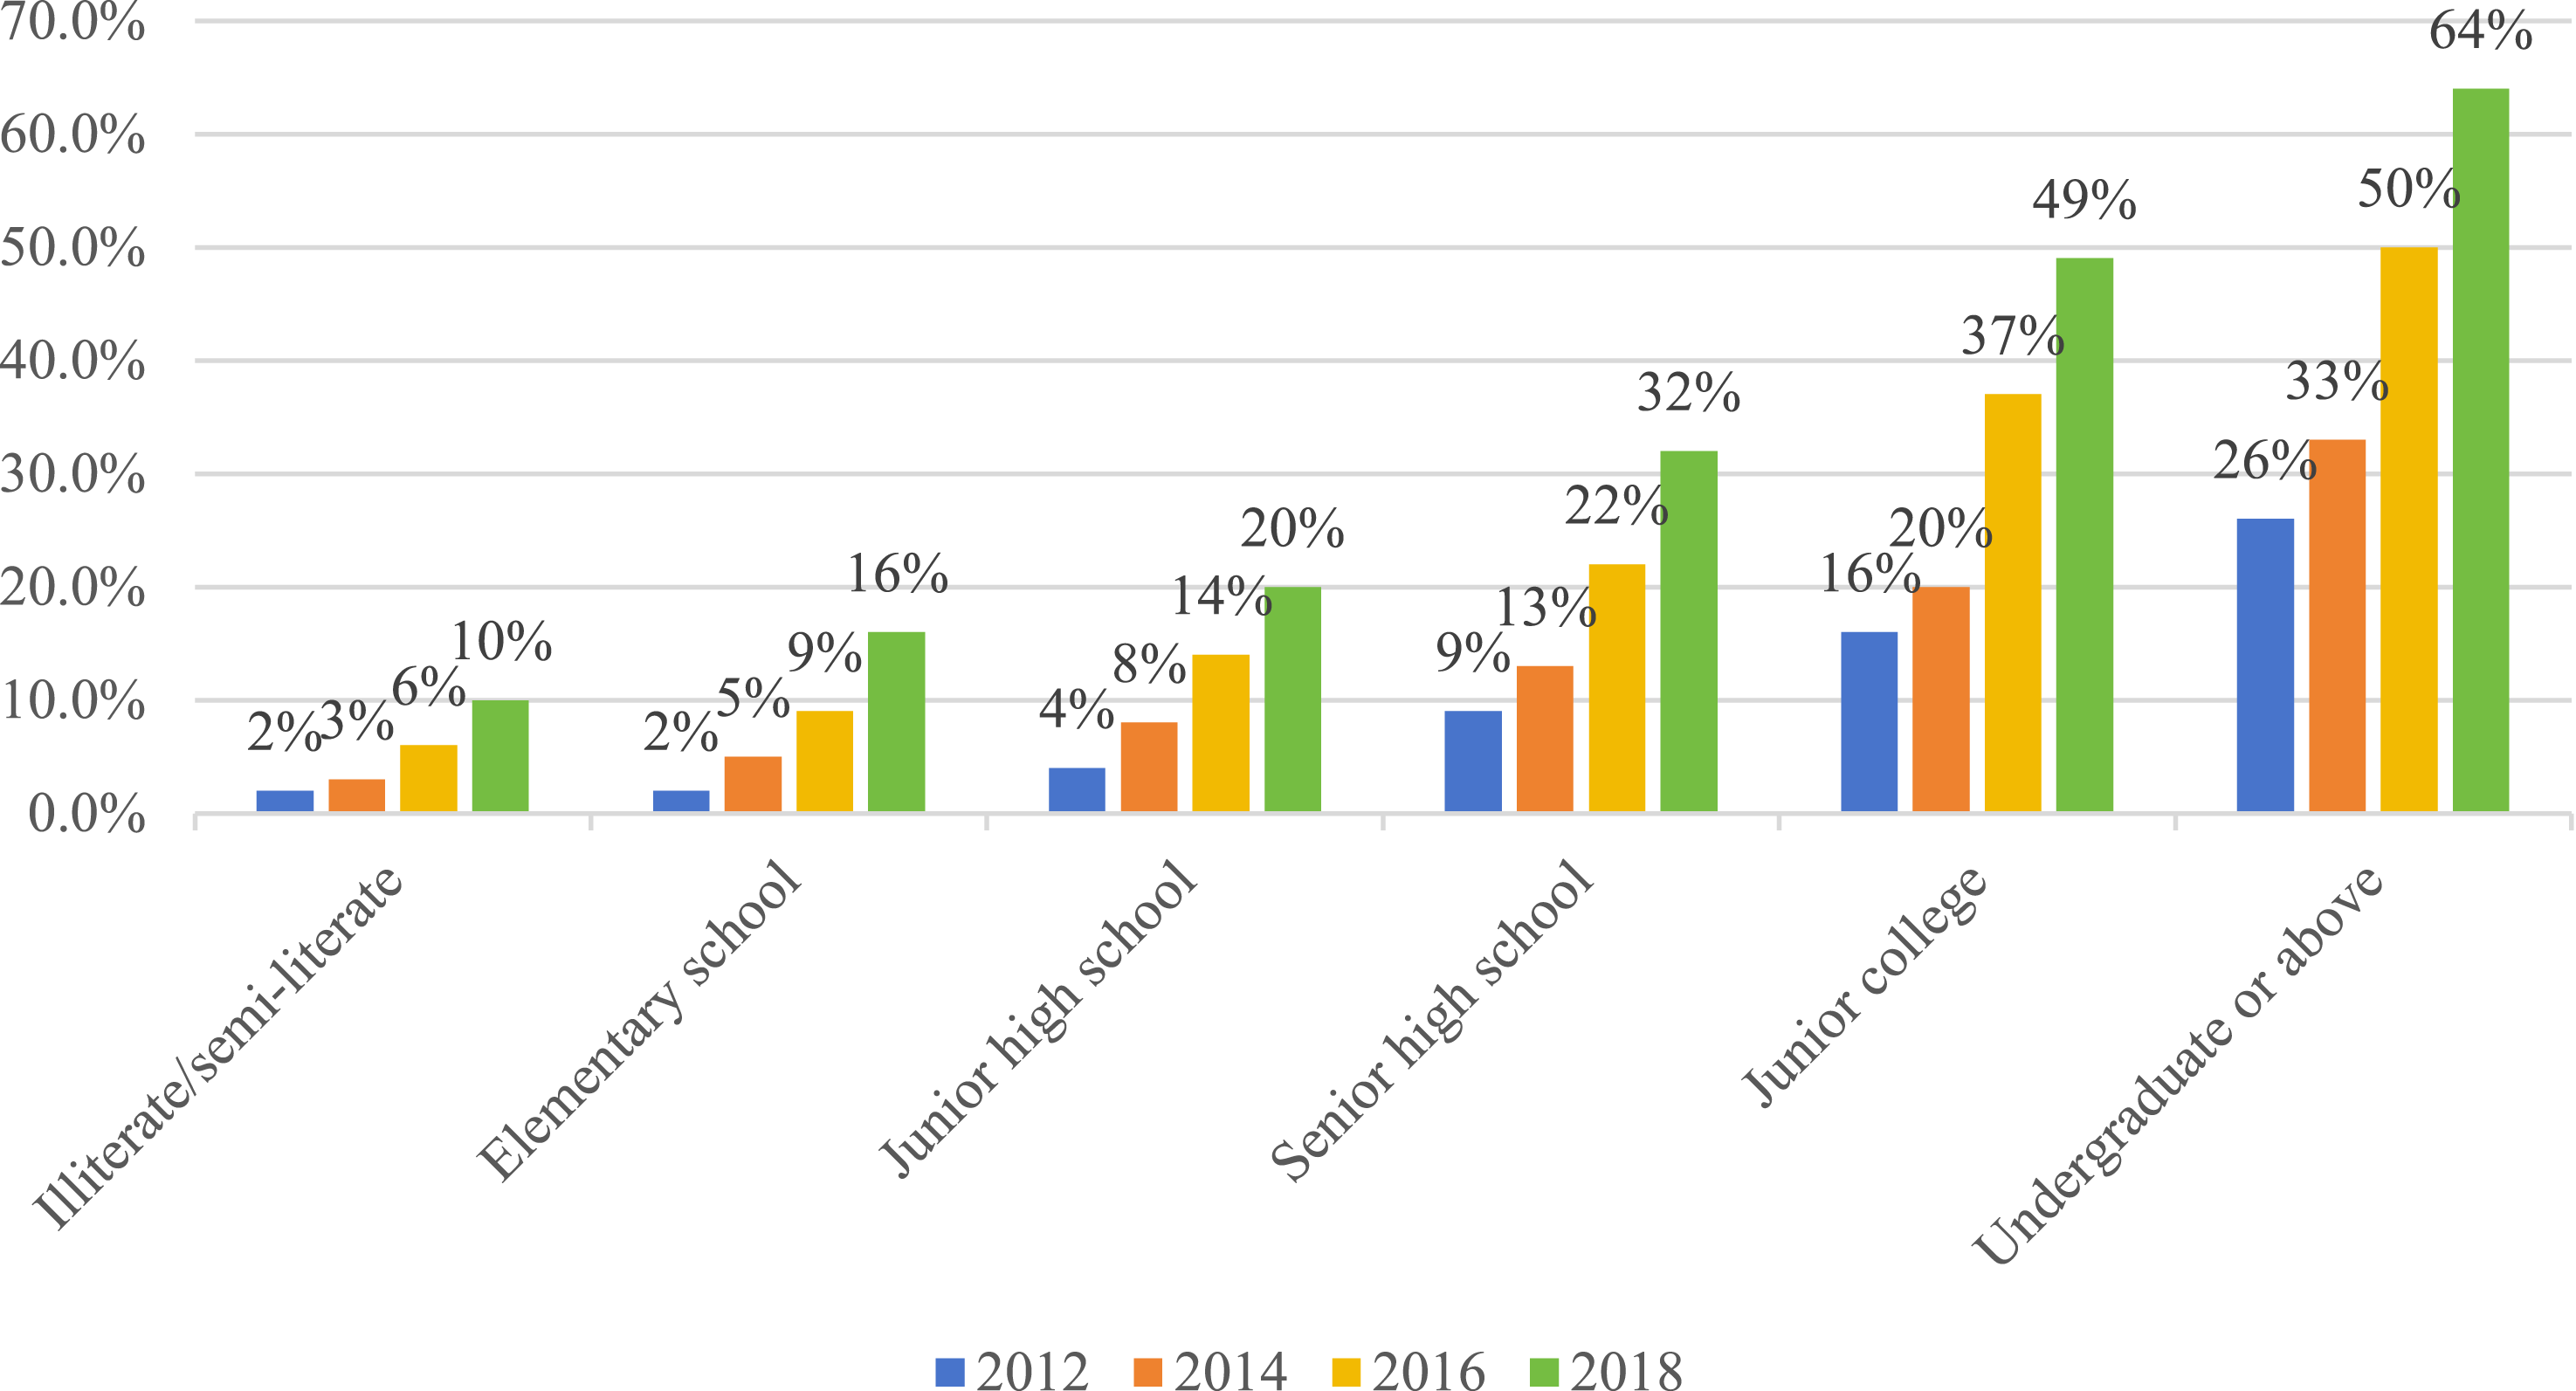
Analysis of the latest data available from the CFPS database—that of the 2018 survey—revealed that middle-income earners accounted for a greater proportion of the more educated groups (Figure 1). In terms of educational attainment, individuals in the middle-income category were estimated to occupy around 9.9% of the illiterate and semi-literate groups, 16.1% of those who had only attained elementary school education, 20.1% of those with only junior high school education, 31.9% of those with only senior high school education, 48.7% of those who had only completed junior college, and 64.3% of those who had completed an undergraduate degree or above.
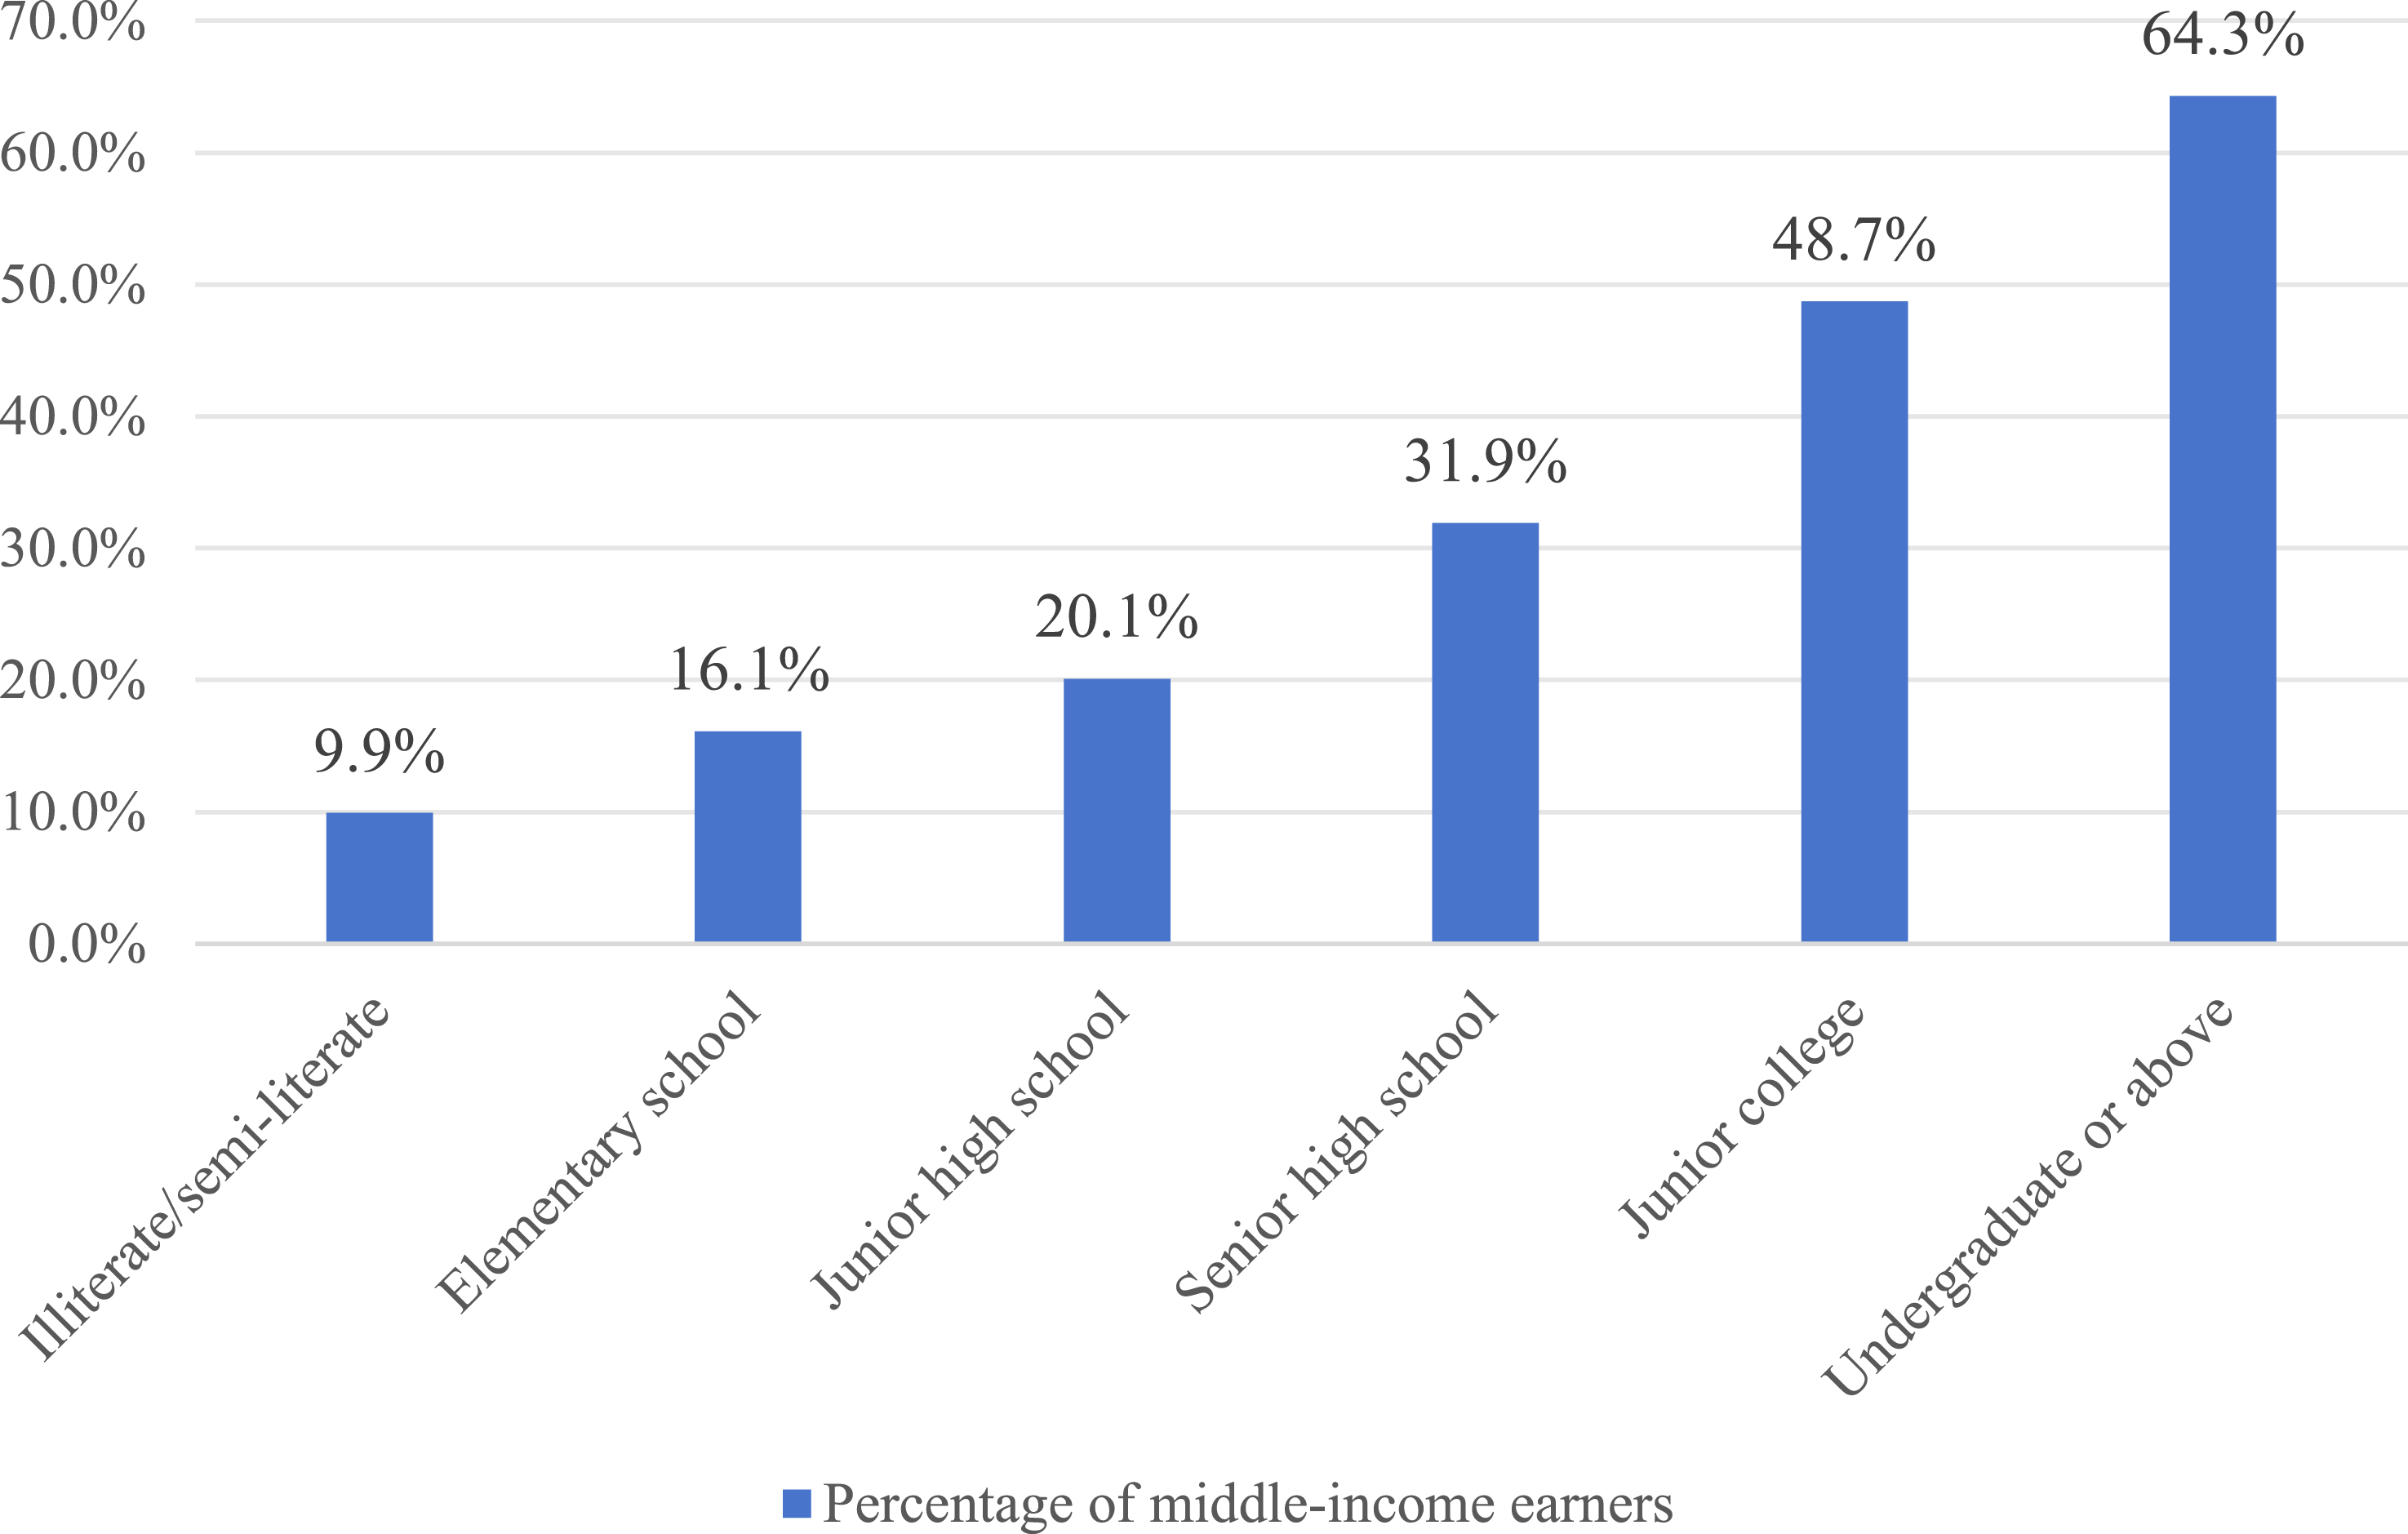
Proportion of the middle-income group by educational attainment in China.
As Figure 1 shows, the proportion of the middle-income group saw two significant increases: one between the senior high school and the junior college groups and the other between the junior college group and respondents with an undergraduate degree or above. Although the share of middle-income earners in the junior college group was around 17 percentage points higher than that in the senior high school group, the proportion of respondents with a tertiary degree outstripped this figure by some 16 percentage points.
Distribution of low-, middle-, and high-income groups by educational attainment
Figures 2–4 depict the educational attainment of the respondents in the low-, middle-, and high-income groups, respectively. As Figure 2 shows, in the low-income group, as many as 79.2% of the respondents had attained a junior high school education or below, 13.1% had a senior high school education, 5% had completed junior college, and only 2.7% had an undergraduate education or above. Considered together, respondents who had completed higher education comprised less than 8% of the low-income group. Within the middle-income group, at roughly 46.7%, a significantly smaller proportion of the respondents had an educational attainment level of junior high school or below. According to Figure 3, approximately 19.5% of the respondents had only completed senior high school, 15.8% had completed junior college, and 18.1% held an undergraduate degree or higher—the latter two representing a marked increase from the previous group. Meanwhile, as Figure 4 shows, 33.5% of the respondents in the high-income group had an undergraduate degree or above—a dramatic increase in the low- and middle-income groups. There was also a notable increase in the share of individuals with junior college-level educational attainment (21.3%). Correspondingly, the proportion of respondents in the high-income group who had only completed senior high school and junior high school or below was substantially smaller than the other groups, accounting for 14% and 31.2%, respectively.
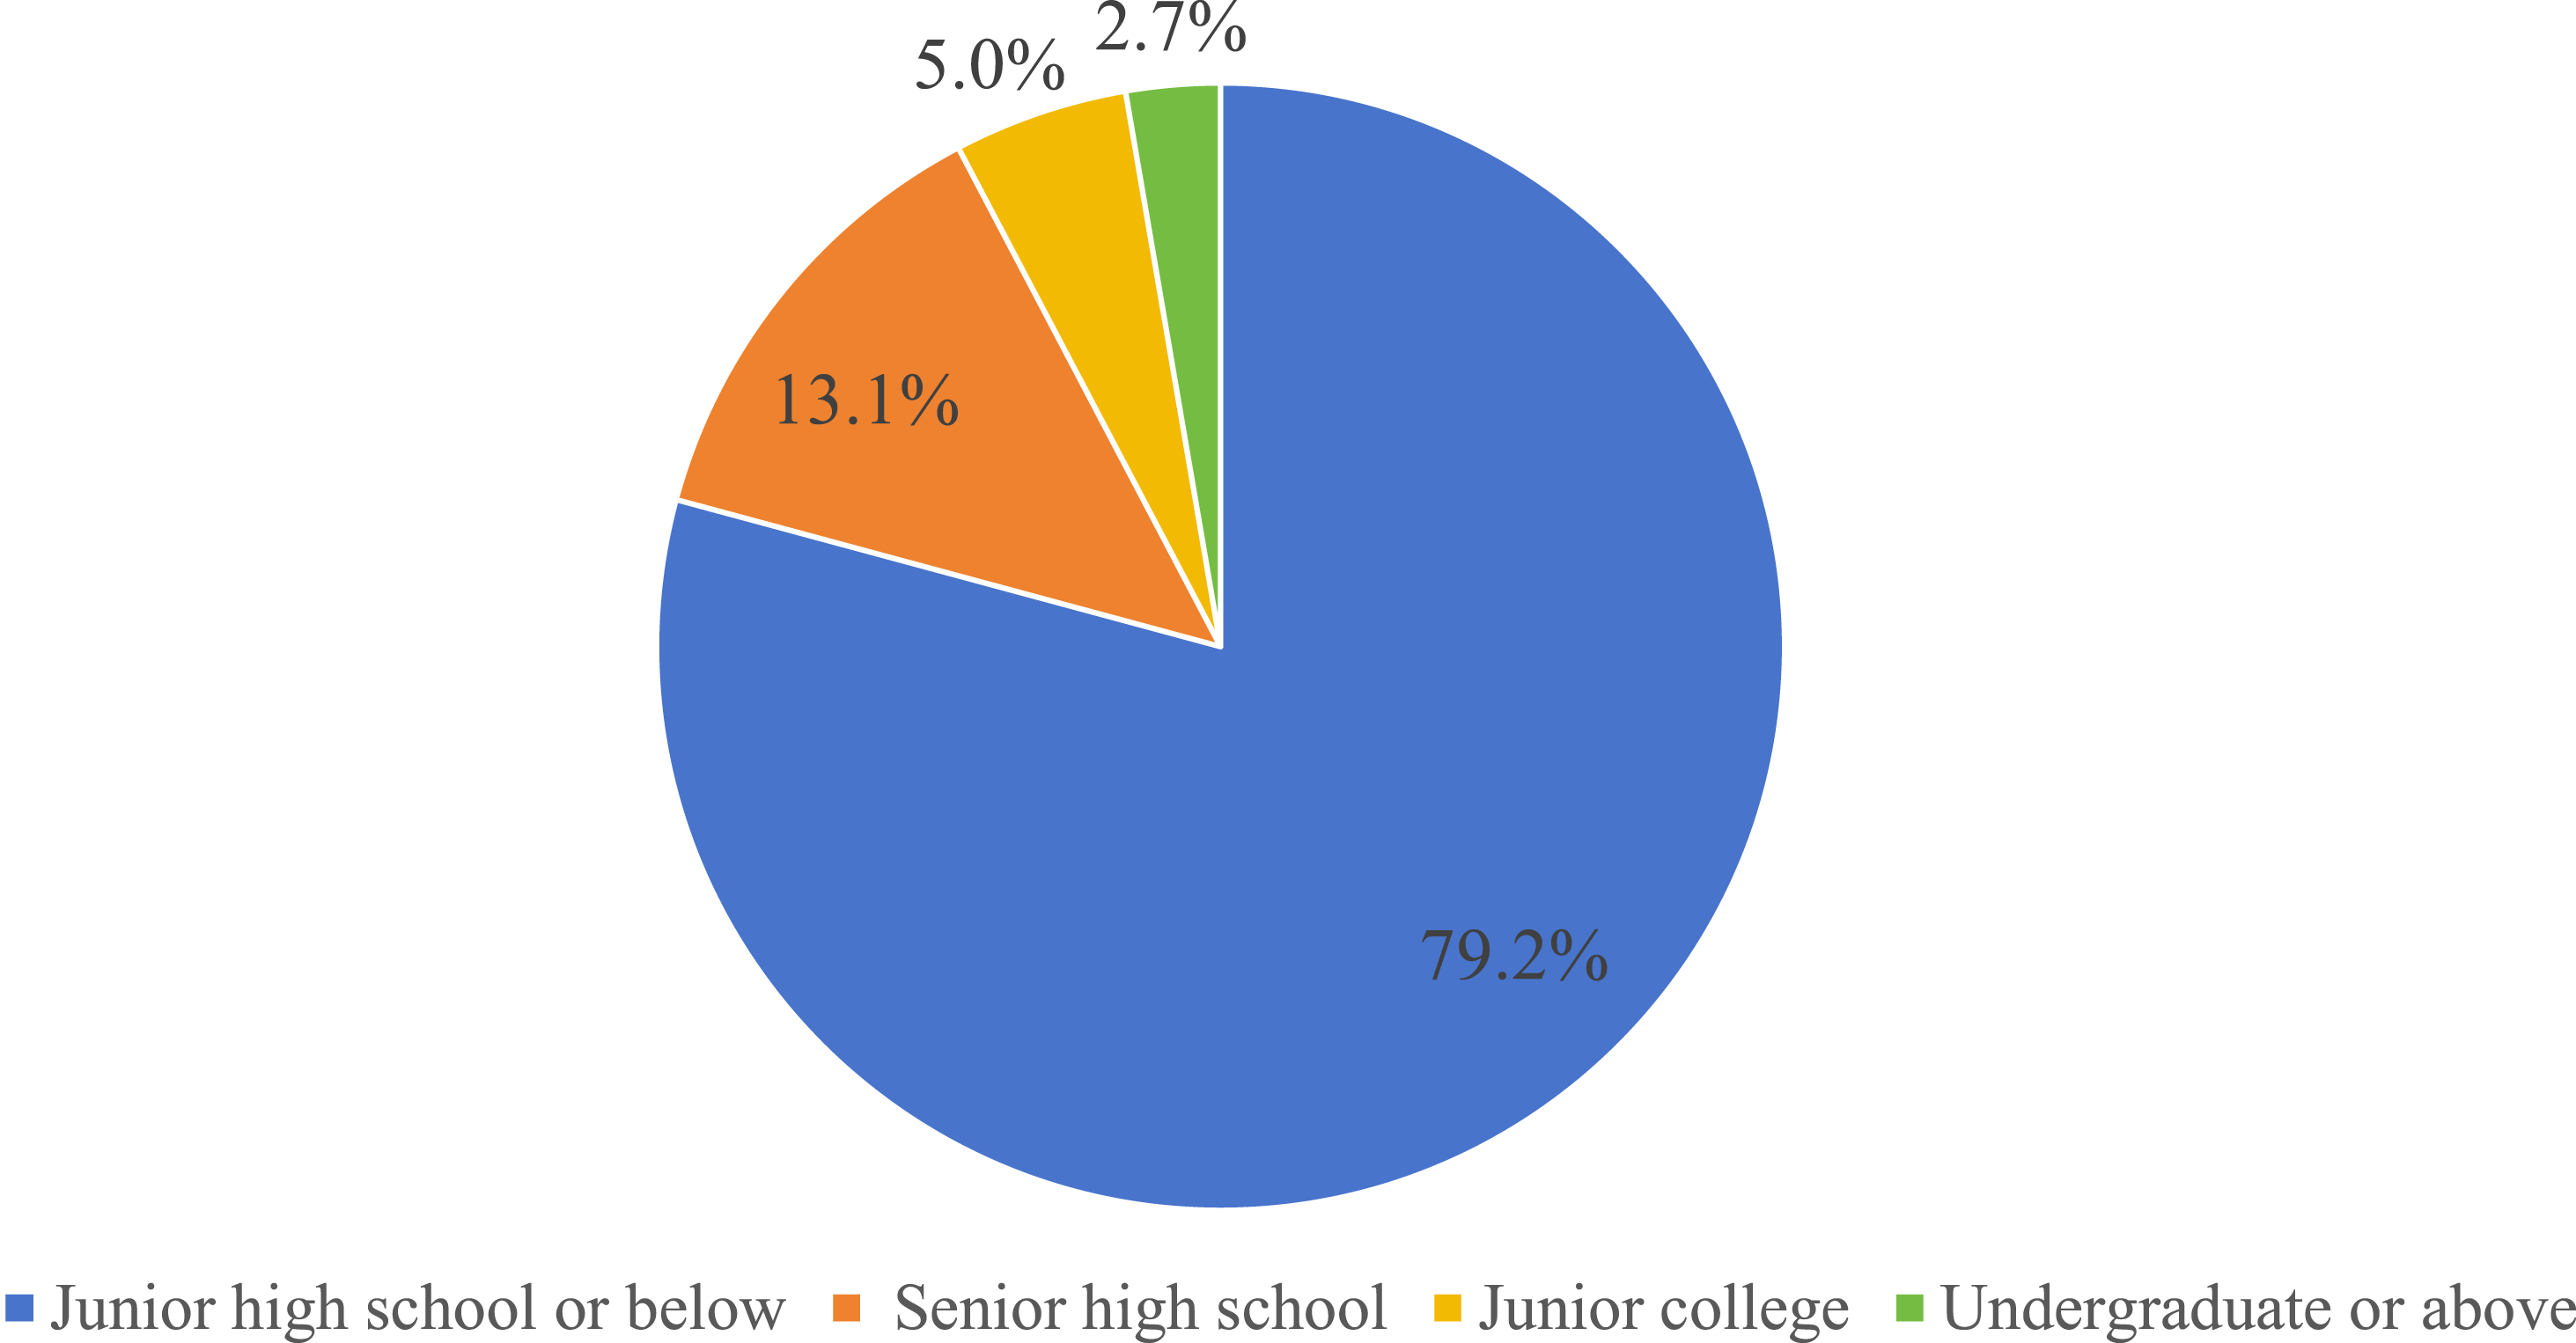
Distribution of the low-income group by educational attainment in China.
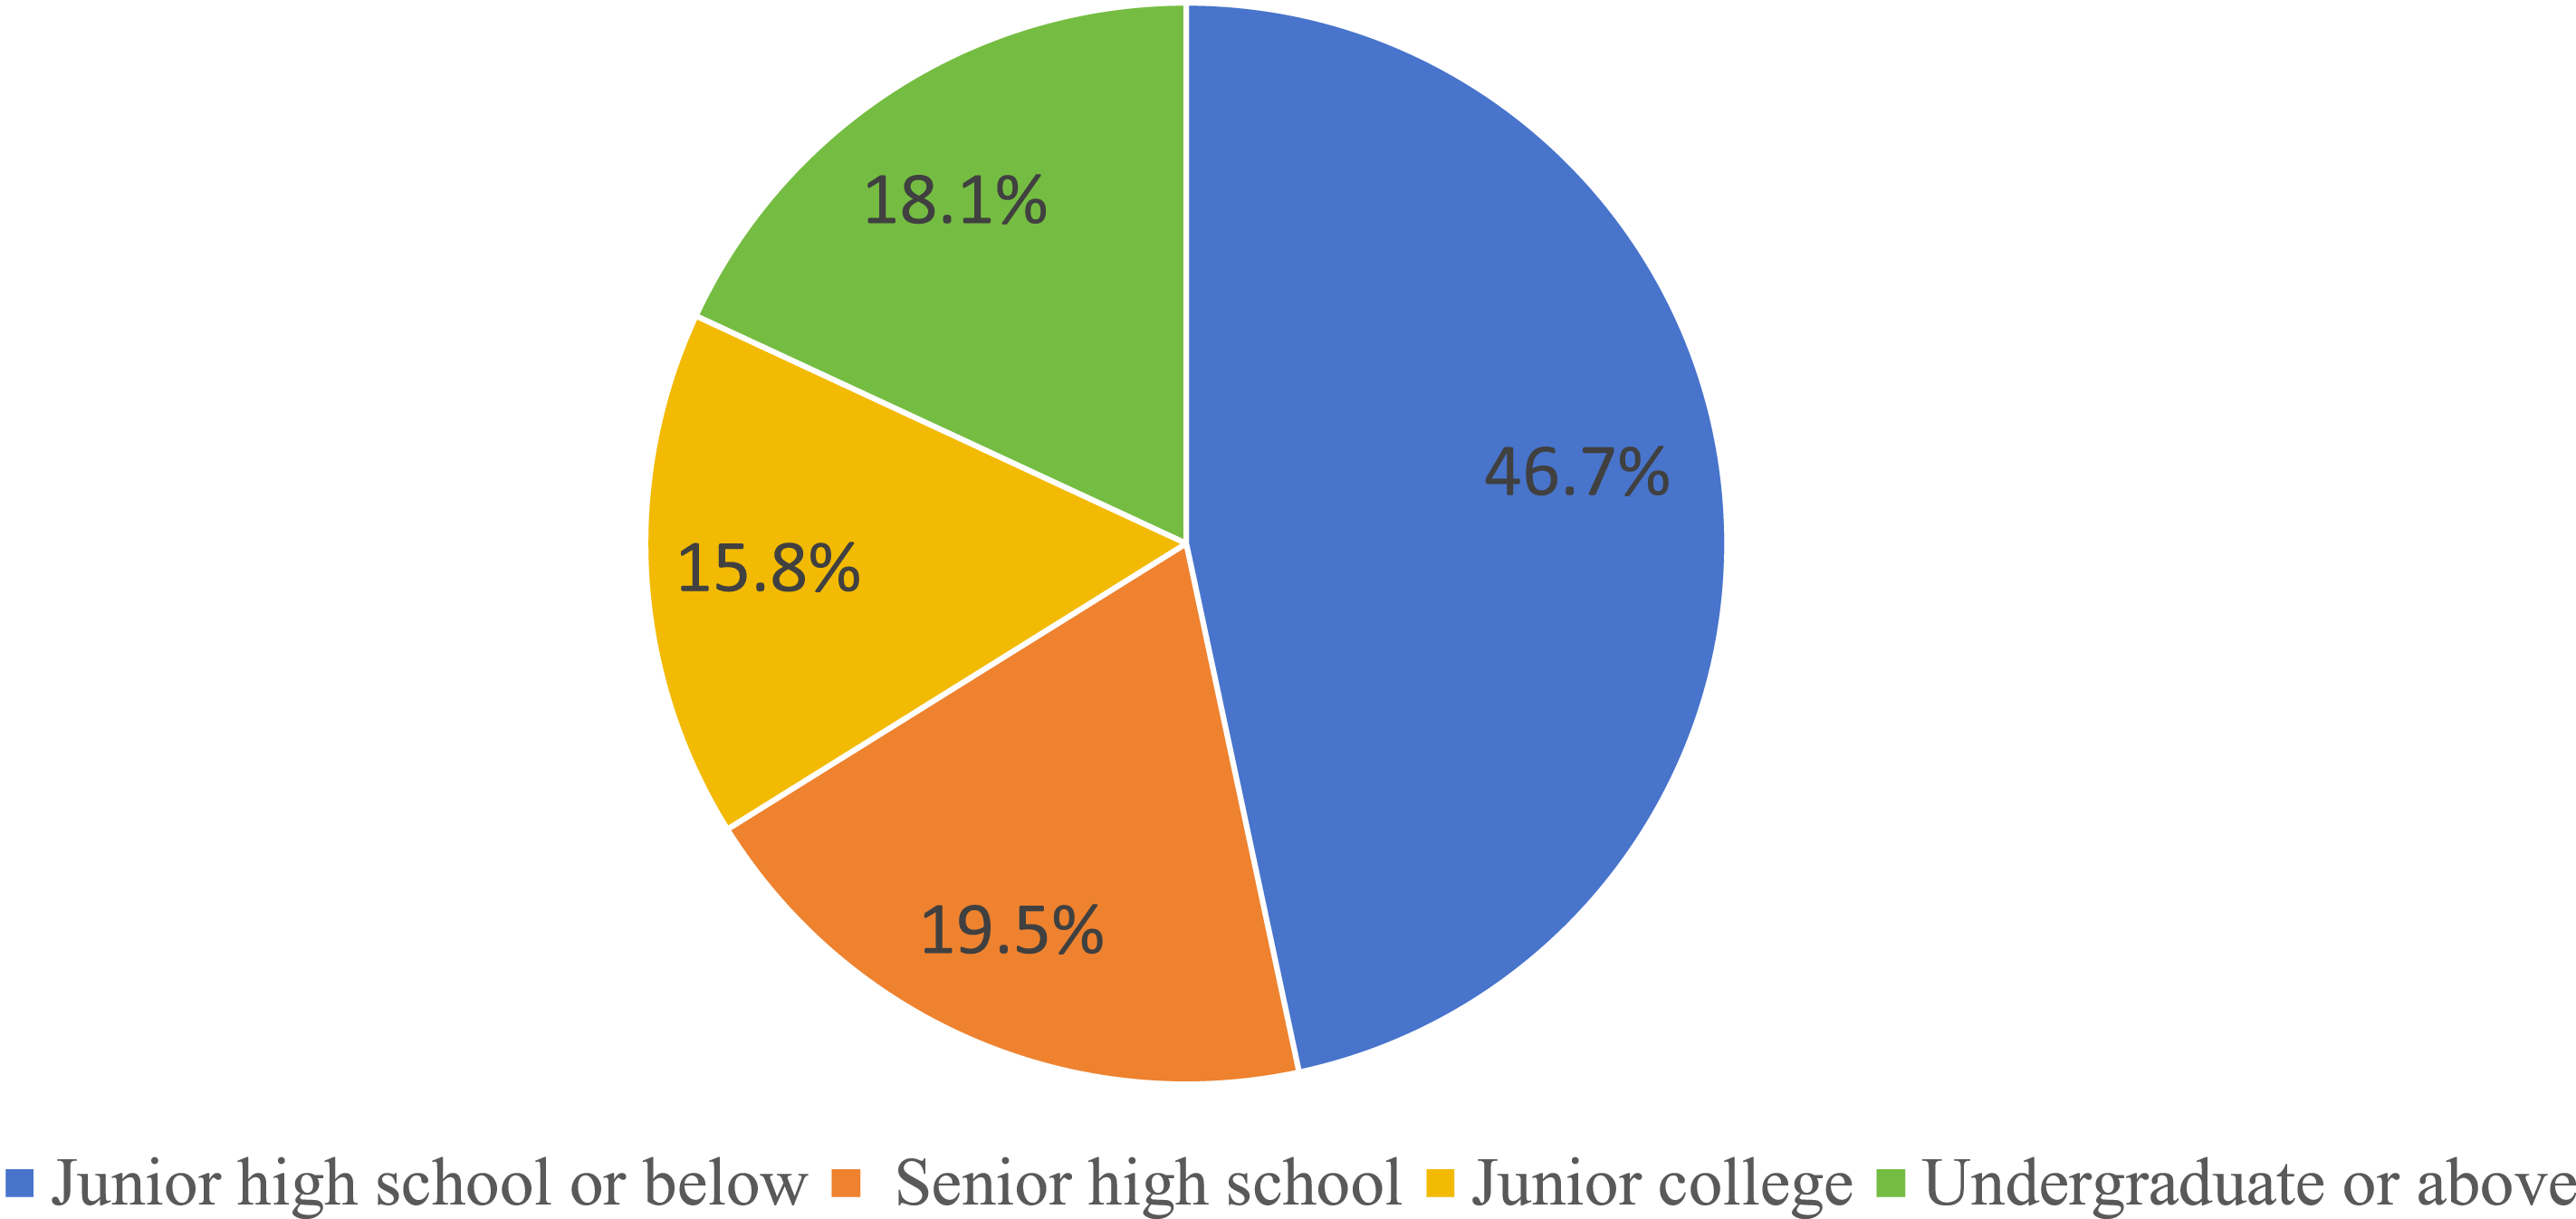
Distribution of the middle-income group by educational attainment in China.
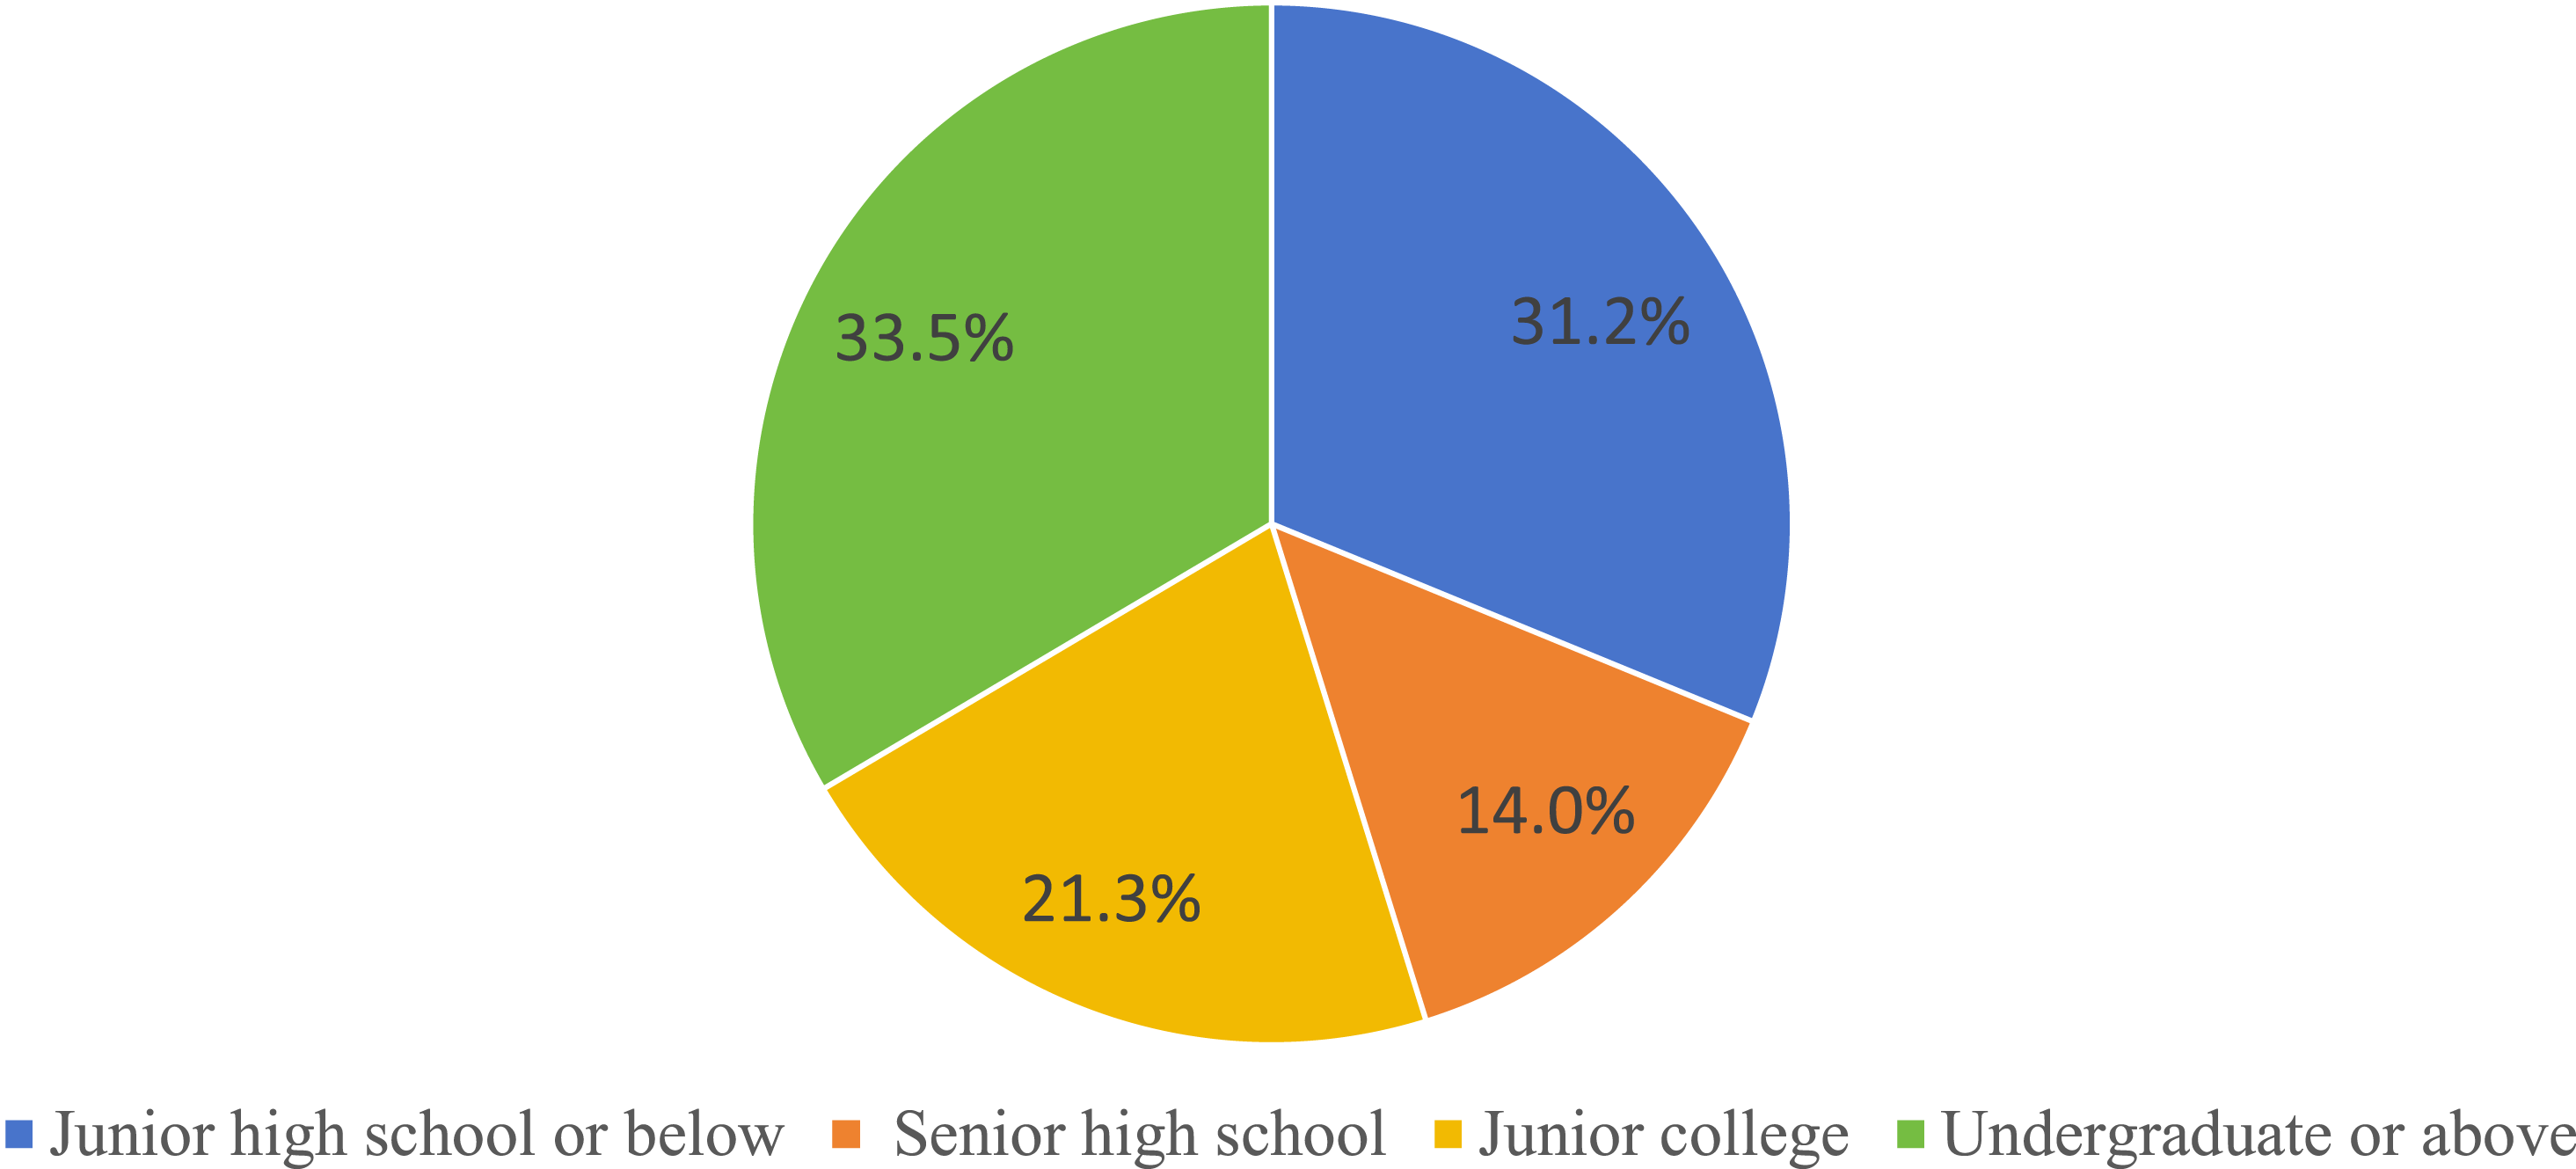
Distribution of the high-income group by educational attainment in China.
Trends in the proportion of the middle-income group by educational attainment (2012–2018)
Analysis of follow-up CFPS survey data from 2012, 2014, 2016, and 2018 revealed continued growth in the proportion of the middle-income group across different levels of educational attainment (Figure 5). In this respect, a pattern emerged across the six levels of educational attainment: drastic increases in the share of the middle-income group in 2014–2016 and 2016–2018 and a smaller increase over the 2012–2014 period.
Trends in the proportion of the middle-income group by educational attainment (2012–2018) in China.
Figure 6 compares different educational attainment categories in each of the survey years, revealing that the share of the middle-income group continued to increase with educational attainment. Comparison between adjacent educational attainment categories demonstrated that in 2012 and 2014, the largest gap was between the undergraduate-or-above and junior college groups, followed by the junior college and senior high school groups. Conversely, in 2016 and 2018, the greatest difference was observed between the junior college and senior high school groups, followed by the undergraduate-or-above and junior college groups.
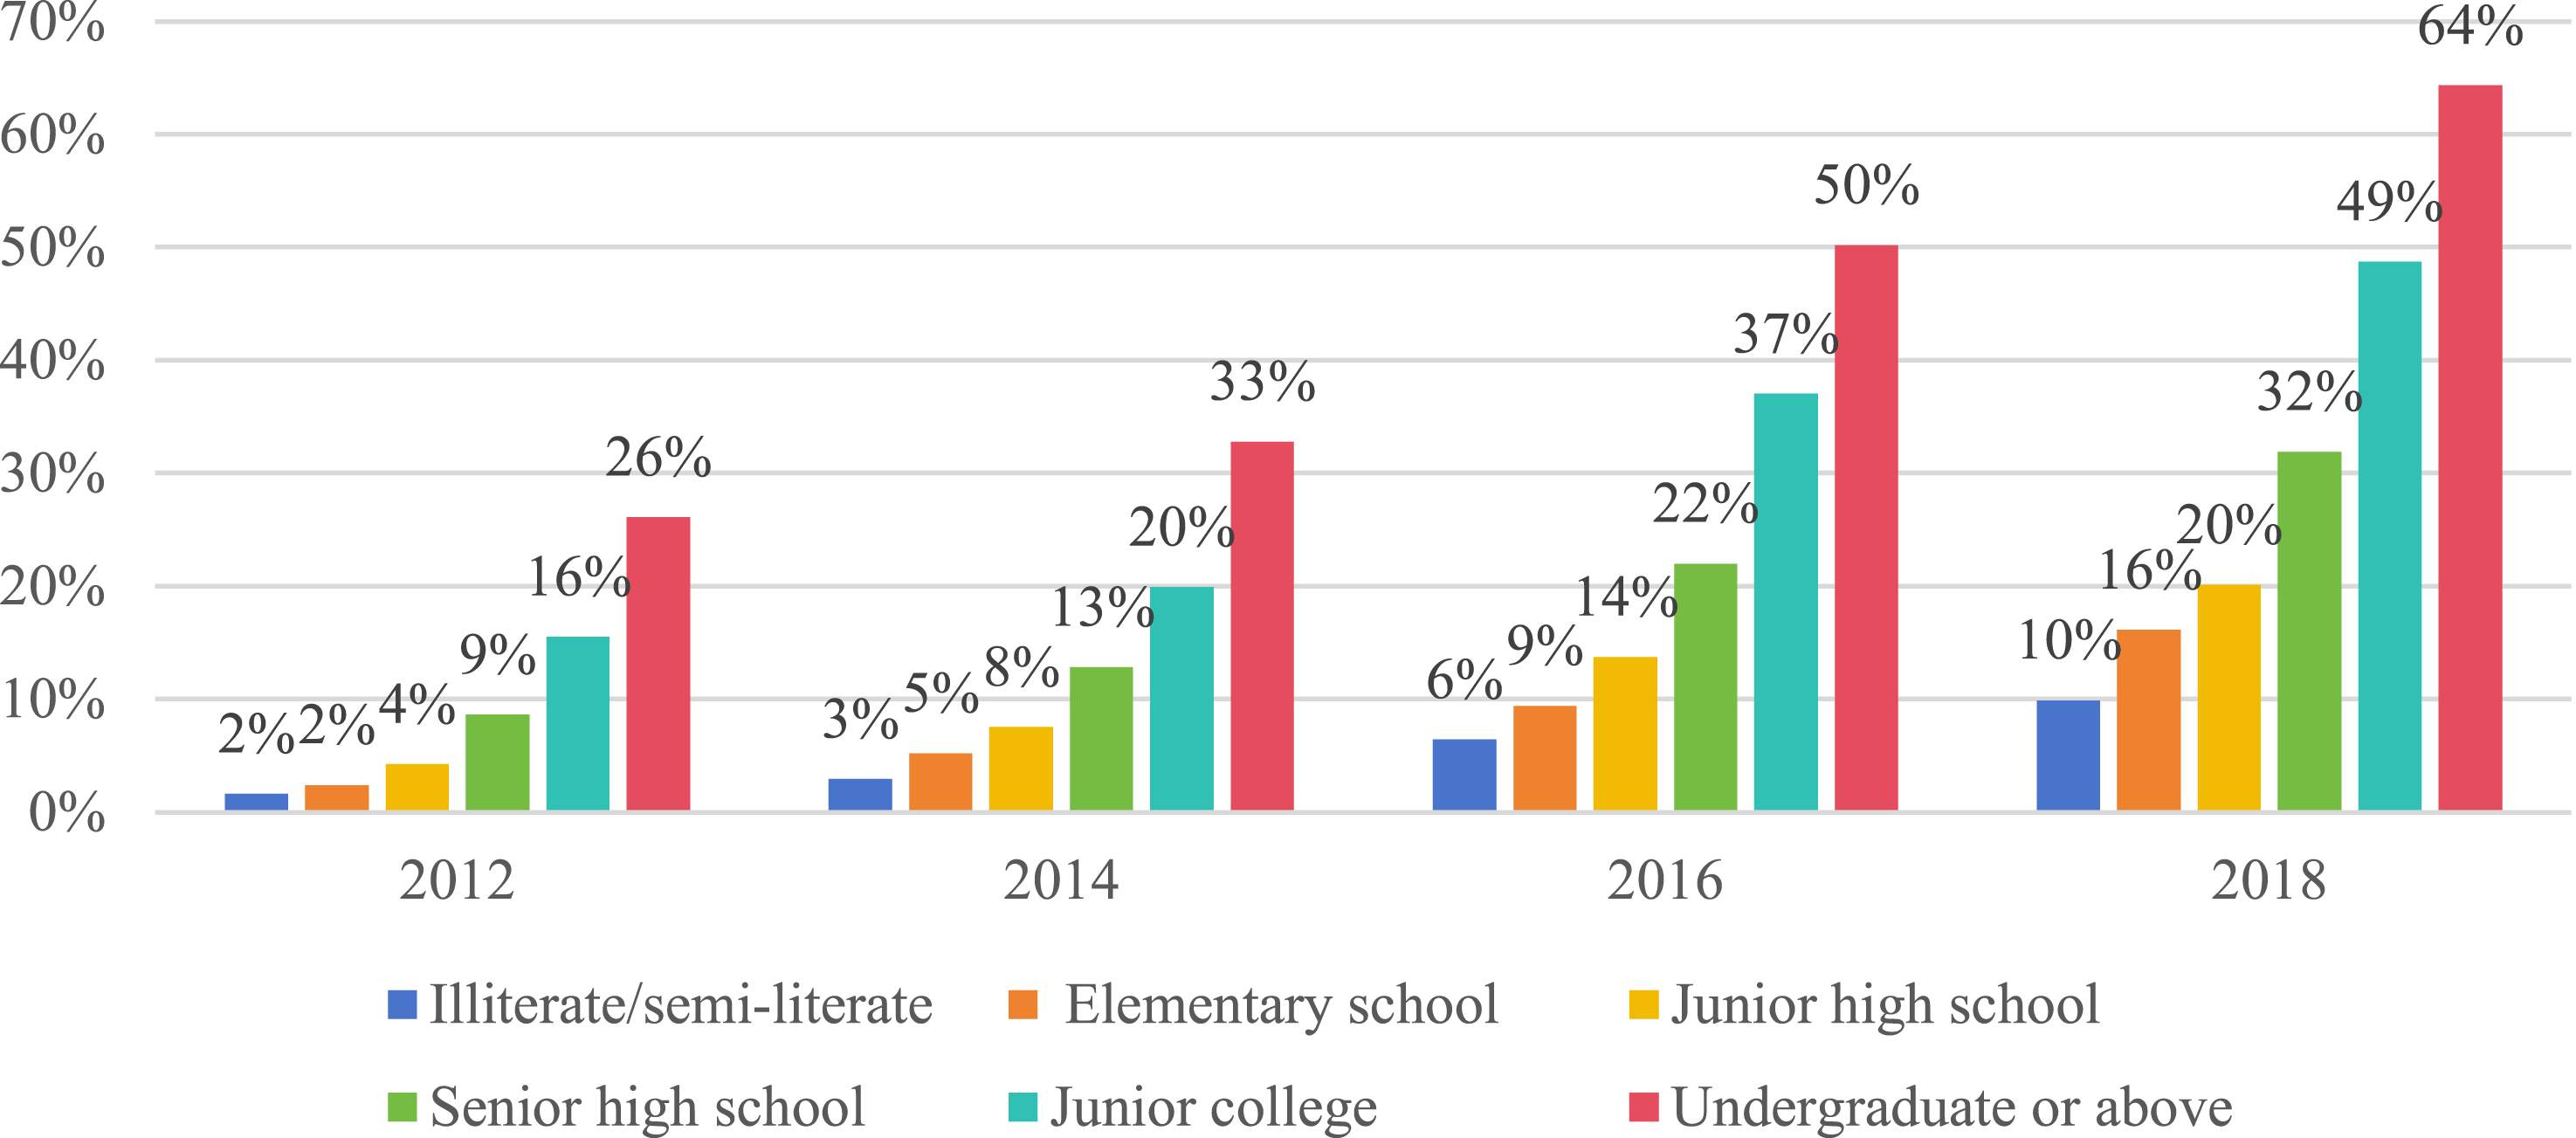
Trends in the proportion of the middle-income group across educational attainment by year in China.
Trends in the proportion of the middle- and high-income groups by educational attainment and the number of years since graduation
Figure 7 illustrates the changing patterns in the share of middle- and high-income earners across different levels of educational attainment regarding the number of years since graduation. Respondents were divided into four groups based on their educational attainment: junior high school or below, senior high school, junior college, and undergraduate or above. Individuals who were illiterate/semi-literate and those with educational attainment levels of elementary or junior high school were grouped together because they had relatively similar shares of middle-income earners (Figure 6). Moreover, with the universalization of compulsory education in China, the number of illiterate, semi-literate, and individuals with only an elementary school education should be next to zero in the future, making close examination unnecessary here. In Figure 7, the vertical axis signifies the combined percentage of middle- and high-income earners. Contrary to the previous approach, the sum total was used in lieu of the share of middle-income earners alone, with the proportion of high-income earners reflecting an increasing trend with the number of years since graduation. This is because some respondents who were once in the middle-income group moved into the high-income group as they gained work experience and seniority. If the vertical axis measured the share of middle-income earners alone, the percentage might decrease as the years since graduation increased, potentially resulting in the impact of years since graduation on income growth being underestimated. Accordingly, using the combined proportion of middle- and high-income earners could better reflect the impact of increasing years since graduation on improvements in income and income class.
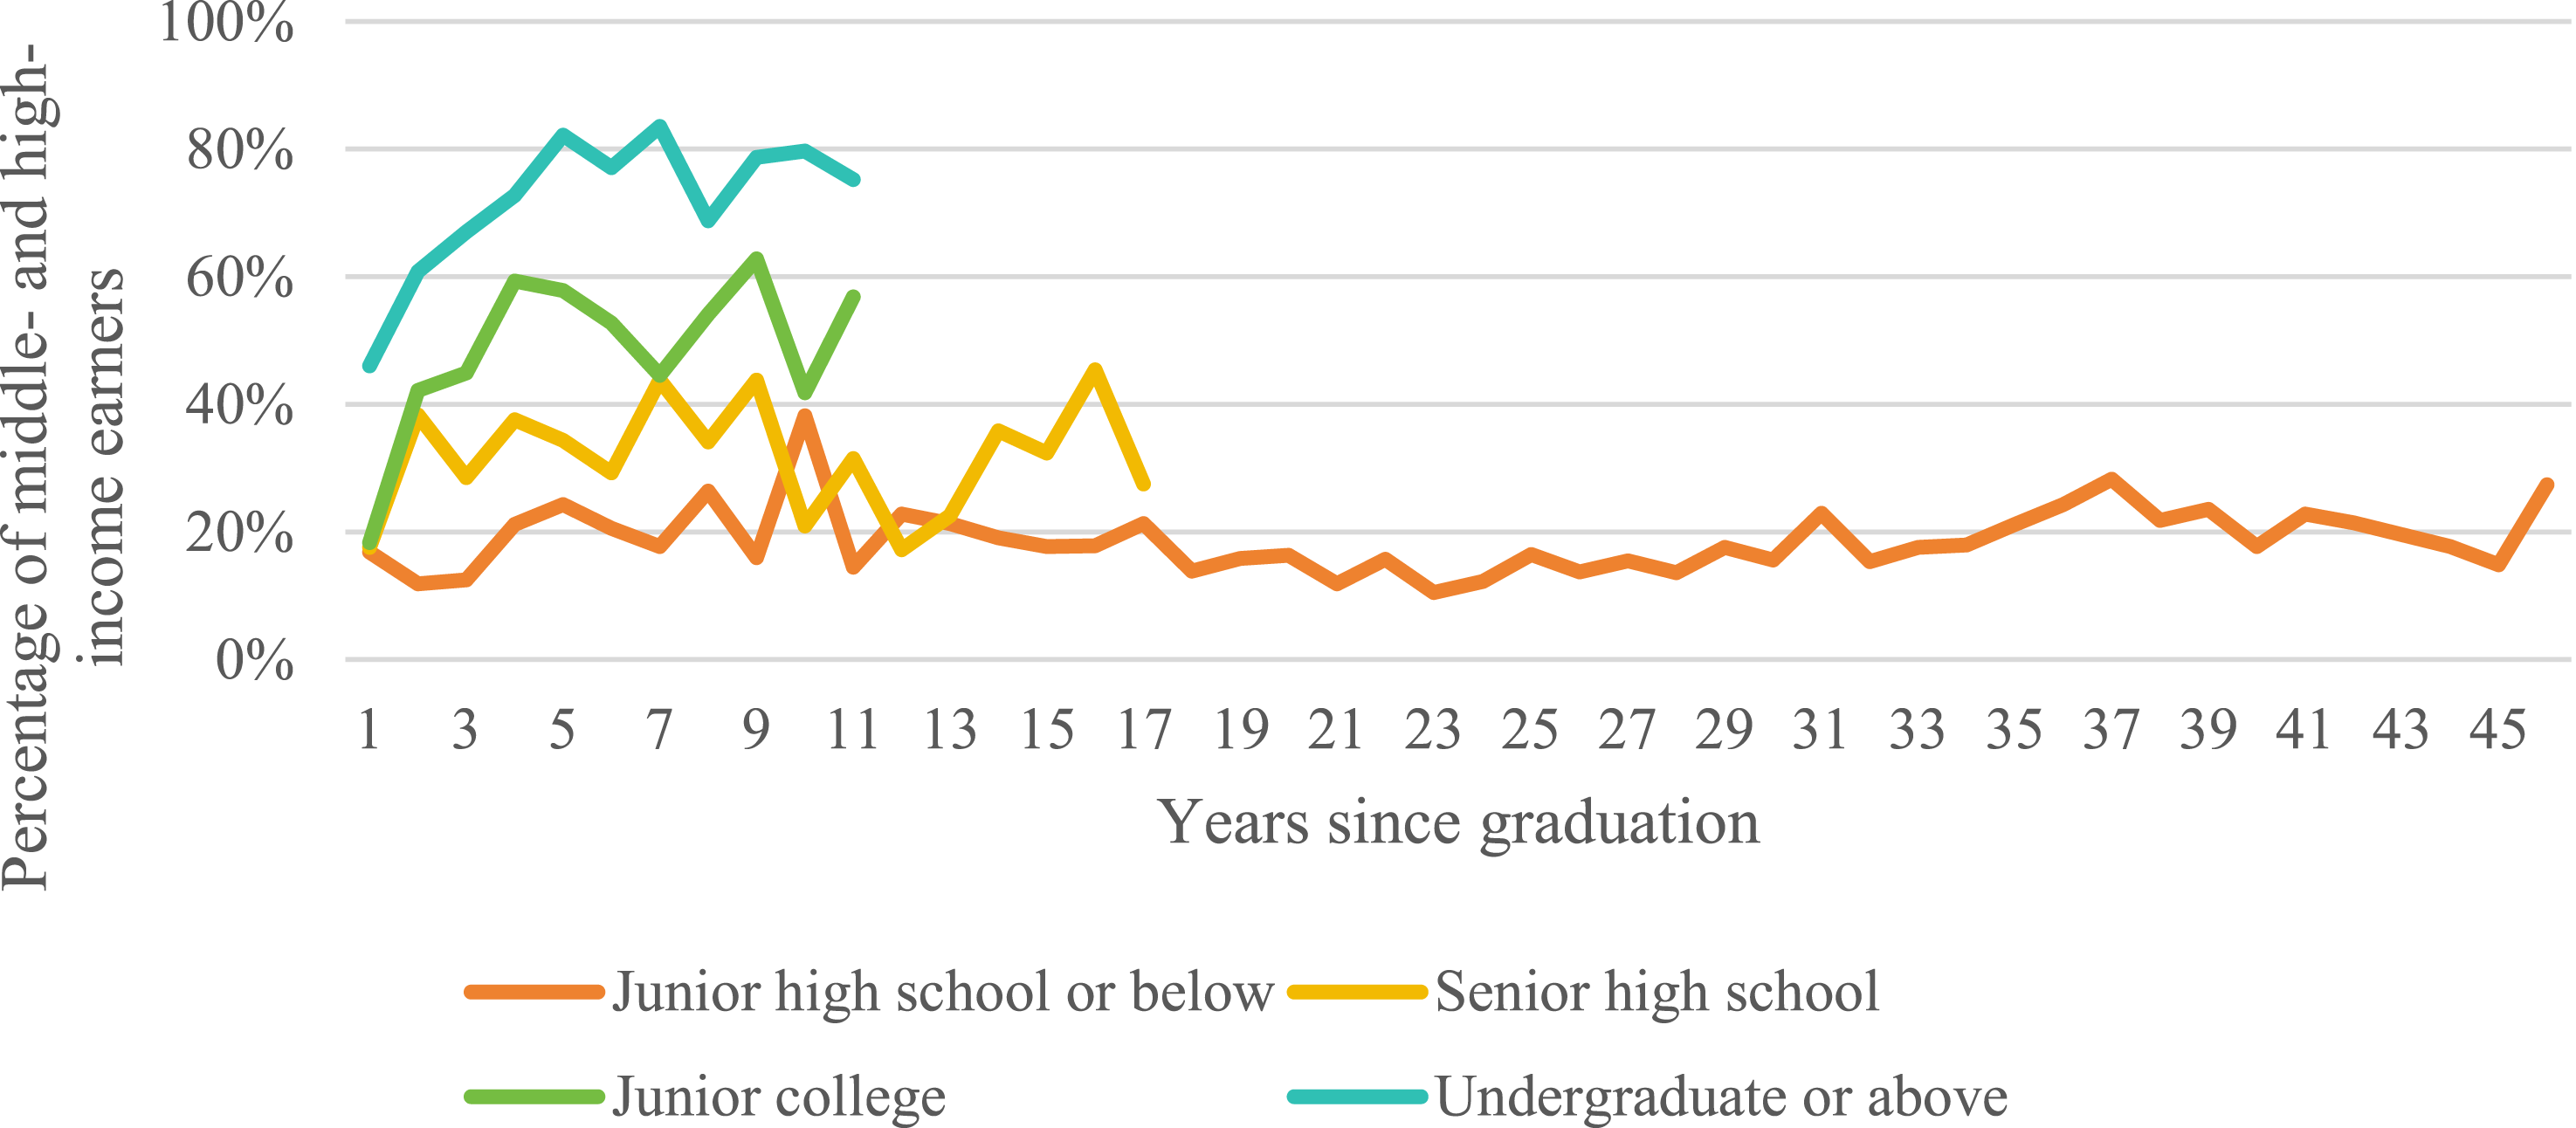
Changing trends in the proportion of middle- and high-income earners by educational attainment with the number of years since graduation in China.
Among respondents who had completed undergraduate education or above, the share of middle- and high-income earners underwent two phases of change as the number of years since graduation increased: a phase of rapid growth within the first five years of graduation, followed by a phase of fluctuations around the peak. Although 70% of respondents with an undergraduate education or above were middle- and high-income earners, the blue trend line in Figure 7 shows that relatively few new graduates could earn a middle-range income after completing an undergraduate program. Indeed, the share of middle- and higher-income earners in this group did not exceed the group average until the fourth year after graduation because of various reasons, including the fact that most job positions pay less during the probationary period. Moreover, it takes time for newly employed graduates to explore and adapt to their positions. The first five years after graduation constituted a phase of rapid growth marked by a rapid increase in income and the probability of becoming a middle- and high-income earner. The share of middle- and high-income earners saw its first peak in the fifth year after graduation, with 82% of graduates falling into the middle- and high-income categories. This was followed by a phase of fluctuations around the peak, in which the share of middle- and high-income earners ranged from 69% to 84%. Nevertheless, the proportion generally hovered around 75%–80% and fluctuated by no more than 15 percentage points, exhibiting relatively minor variations.
Among the junior college group, changes in the share of middle- and high-income earners similarly unfolded in two phases: a phase of rapid growth within the first four years of graduation, followed by a phase of fluctuations around the peak. Moreover, in Figure 7, the yellow trend line shows that the share of middle- and high-income earners increased sharply after graduation from junior college and surpassed the group average in the fourth year, with 52% of junior college graduates falling into the middle- and high-income categories. This was followed by a phase of fluctuations around the peak, in which the share of middle- and high-income earners ranged from 42% to 63%. Fluctuations ranged at 21 percentage points at most, greater than that in the undergraduate-or-above group. Additionally, regardless of the number of years since graduation, the share of middle- and high-income earners in the junior college group remained notably lower than the equivalent share for the undergraduate-or-above group.
Compared with the previous two groups, changes in the senior high school group followed a distinctly different trend comprising three phases: a phase of fluctuations around the peak within the first to ninth years after graduation, followed by that of fluctuations around the trough in the tenth to thirteenth years, and a third phase of fluctuations around the peak in the fourteenth to seventeenth years after graduation. Unlike respondents who had completed junior college and undergraduate education or above, the share of middle- and high-income earners in the senior high school group expanded rapidly—accounting for some 38%—in just two years after graduation. This is because individuals in this group tend to occupy less skill- and knowledge-intensive job positions, allowing them to adapt to their roles more quickly and move higher up the income ladder in a short period. Results also revealed that, as the number of years since graduation increased, the growth in income slowed down. Consequently, the share of middle- and high-income earners tended to fluctuate between 28% and 43% two to nine years after graduation, decline steeply and fluctuate between 17% and 32% in the tenth to thirteenth years, and rebound drastically to range between 28% and 45% in the fourteenth and seventeenth years after graduation. Furthermore, regardless of the number of years since graduation, the share of middle- and high-income earners was consistently smaller in the senior high school group than in the junior college group, revealing significant differences between the two groups for most of the surveyed years.
The group with an educational attainment level of junior high school or above also reflected a three-phase trend: a phase of fluctuations around the peak 1–17 years after graduation, followed by a phase of fluctuations in years 18–30 and another phase of fluctuations around the peak in years 31–45. In this group, the share of middle- and high-income earners reached 21% within just four years of graduation, fluctuated between 15% and 25% until the seventeenth year after graduation, and then fluctuated between 10% and 18% in their eighteenth and thirtieth years of work. The reasons for this are three-fold: (1) while migrant workers’ wages remained relatively stable, their average wage fell by approximately RMB 4,400 compared to the period spanning the fourth to seventeenth years; (2) the proportion of female migrant workers remained relatively low; (3) household size remained relatively large (at around four people). For the period spanning years 31–45 since graduation, the share of middle- and high-income earners recovered from the previous phase and fluctuated mostly between 15% and 25%. This period was marked by a downward trend in the wages of migrant workers, which declined by an average of approximately RMB 8,000 compared to the eighteenth to thirtieth years, and the continued decline in the number of female migrant workers. Nevertheless, the average household size dwindled to around 3.5, indicating that households could increase their per-capita income as the children matured and gained independence. Compared with the senior high school group, the share of middle- and high-income earners in this group was smaller for most of the years.
The four color-coded curves in Figure 7 show that the inter-group differences attributable to education attainment did not diminish with the number of years since graduation. In other words, the highest level of education attained by individuals remained central to their future income class distinctions. While the likelihood of an individual becoming a middle- or high-income earner varies significantly with educational attainment, consequent changes in the former may not be offset regardless of how many years have passed since graduation.
Changes in the proportion of the middle-income group in the United States (1976–1982)
According to the statistical standards and calculation methods used in this study, for China to achieve its goal of doubling the size of the middle-income group by 2035, the country must increase the share of middle-income earners from 24%, as of 2018, to 48%. To gain insights through international comparison, this study analyzed the PSID survey data of American household income using the Chinese government's definition of middle-class income. As Figure 8 reveals, between 1976 and 1982, the U.S. situation was similar to that of contemporary China. Between 1976 and 1977, the share of the middle-income group in the United States surpassed 24% for the first time and ranged from 22% to 25%, which was the closest to the equivalent in China in 2018. In 1982, this range reached 48% for the first time in the United States—the level closest to the expected outcome of China's effort to double the size of its middle-income group by 2035. Figure 8 illustrates the proportions of the middle- and high-income groups in the total population of the United States between 1976 and 1982. Results show that, during the period in question, the middle-income group maintained a clear trend of growth of approximately 4% for most years, whereas the growth of the high-income group remained distinctly sluggish.
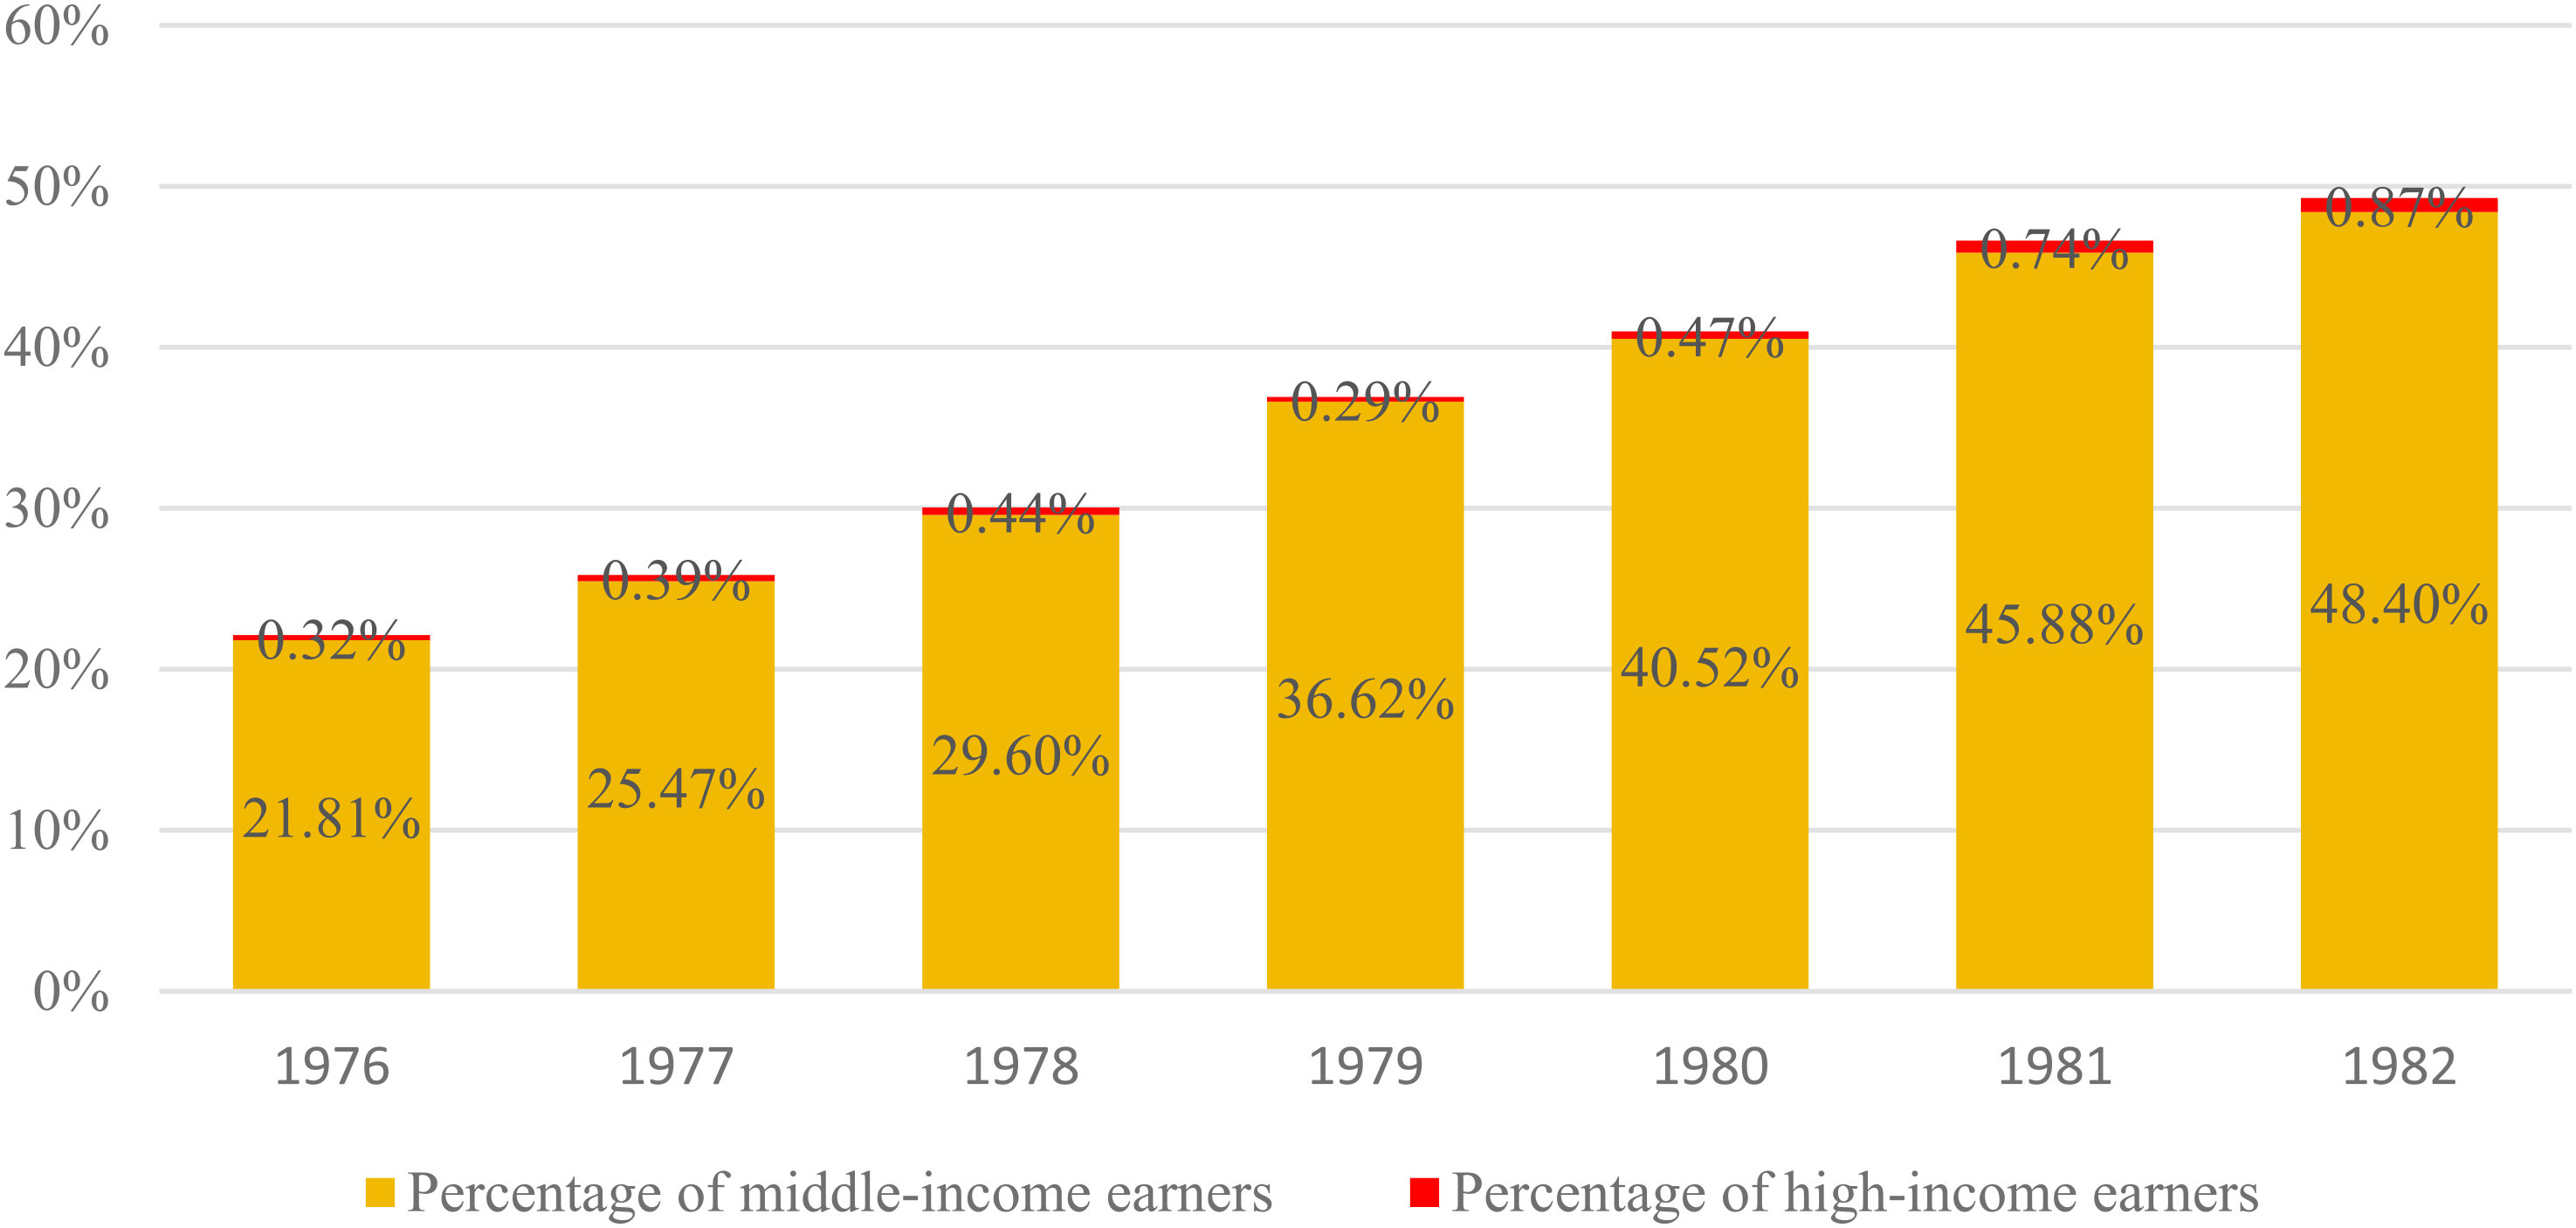
Changes in the middle- and high-income groups in the United States (1976–1982).
In Figure 9, respondents are divided into four groups based on their educational attainment—junior high school or below, senior high school, junior college, and undergraduate or above—to illustrate the changing trends in the share of the middle-income group by educational attainment in the United States between 1976 and 1982. Overall, the share of the middle-income group increased over time across all levels of educational attainment. More specifically, the proportion of middle-income earners with a junior high school education or below increased from 9% in 1976 to 28% in 1982, while that of those with a senior high school education increased from 20% to 49% over the same period. The number of those with a junior college education increased by 29 percentage points between 1976 and 1982—from 30% to 59%—while respondents with an undergraduate education or above expanded from 46% to 74%. Comparison between educational attainment levels during this period indicates that the share of middle-income earners was consistently higher among the more educated groups than the less educated ones.
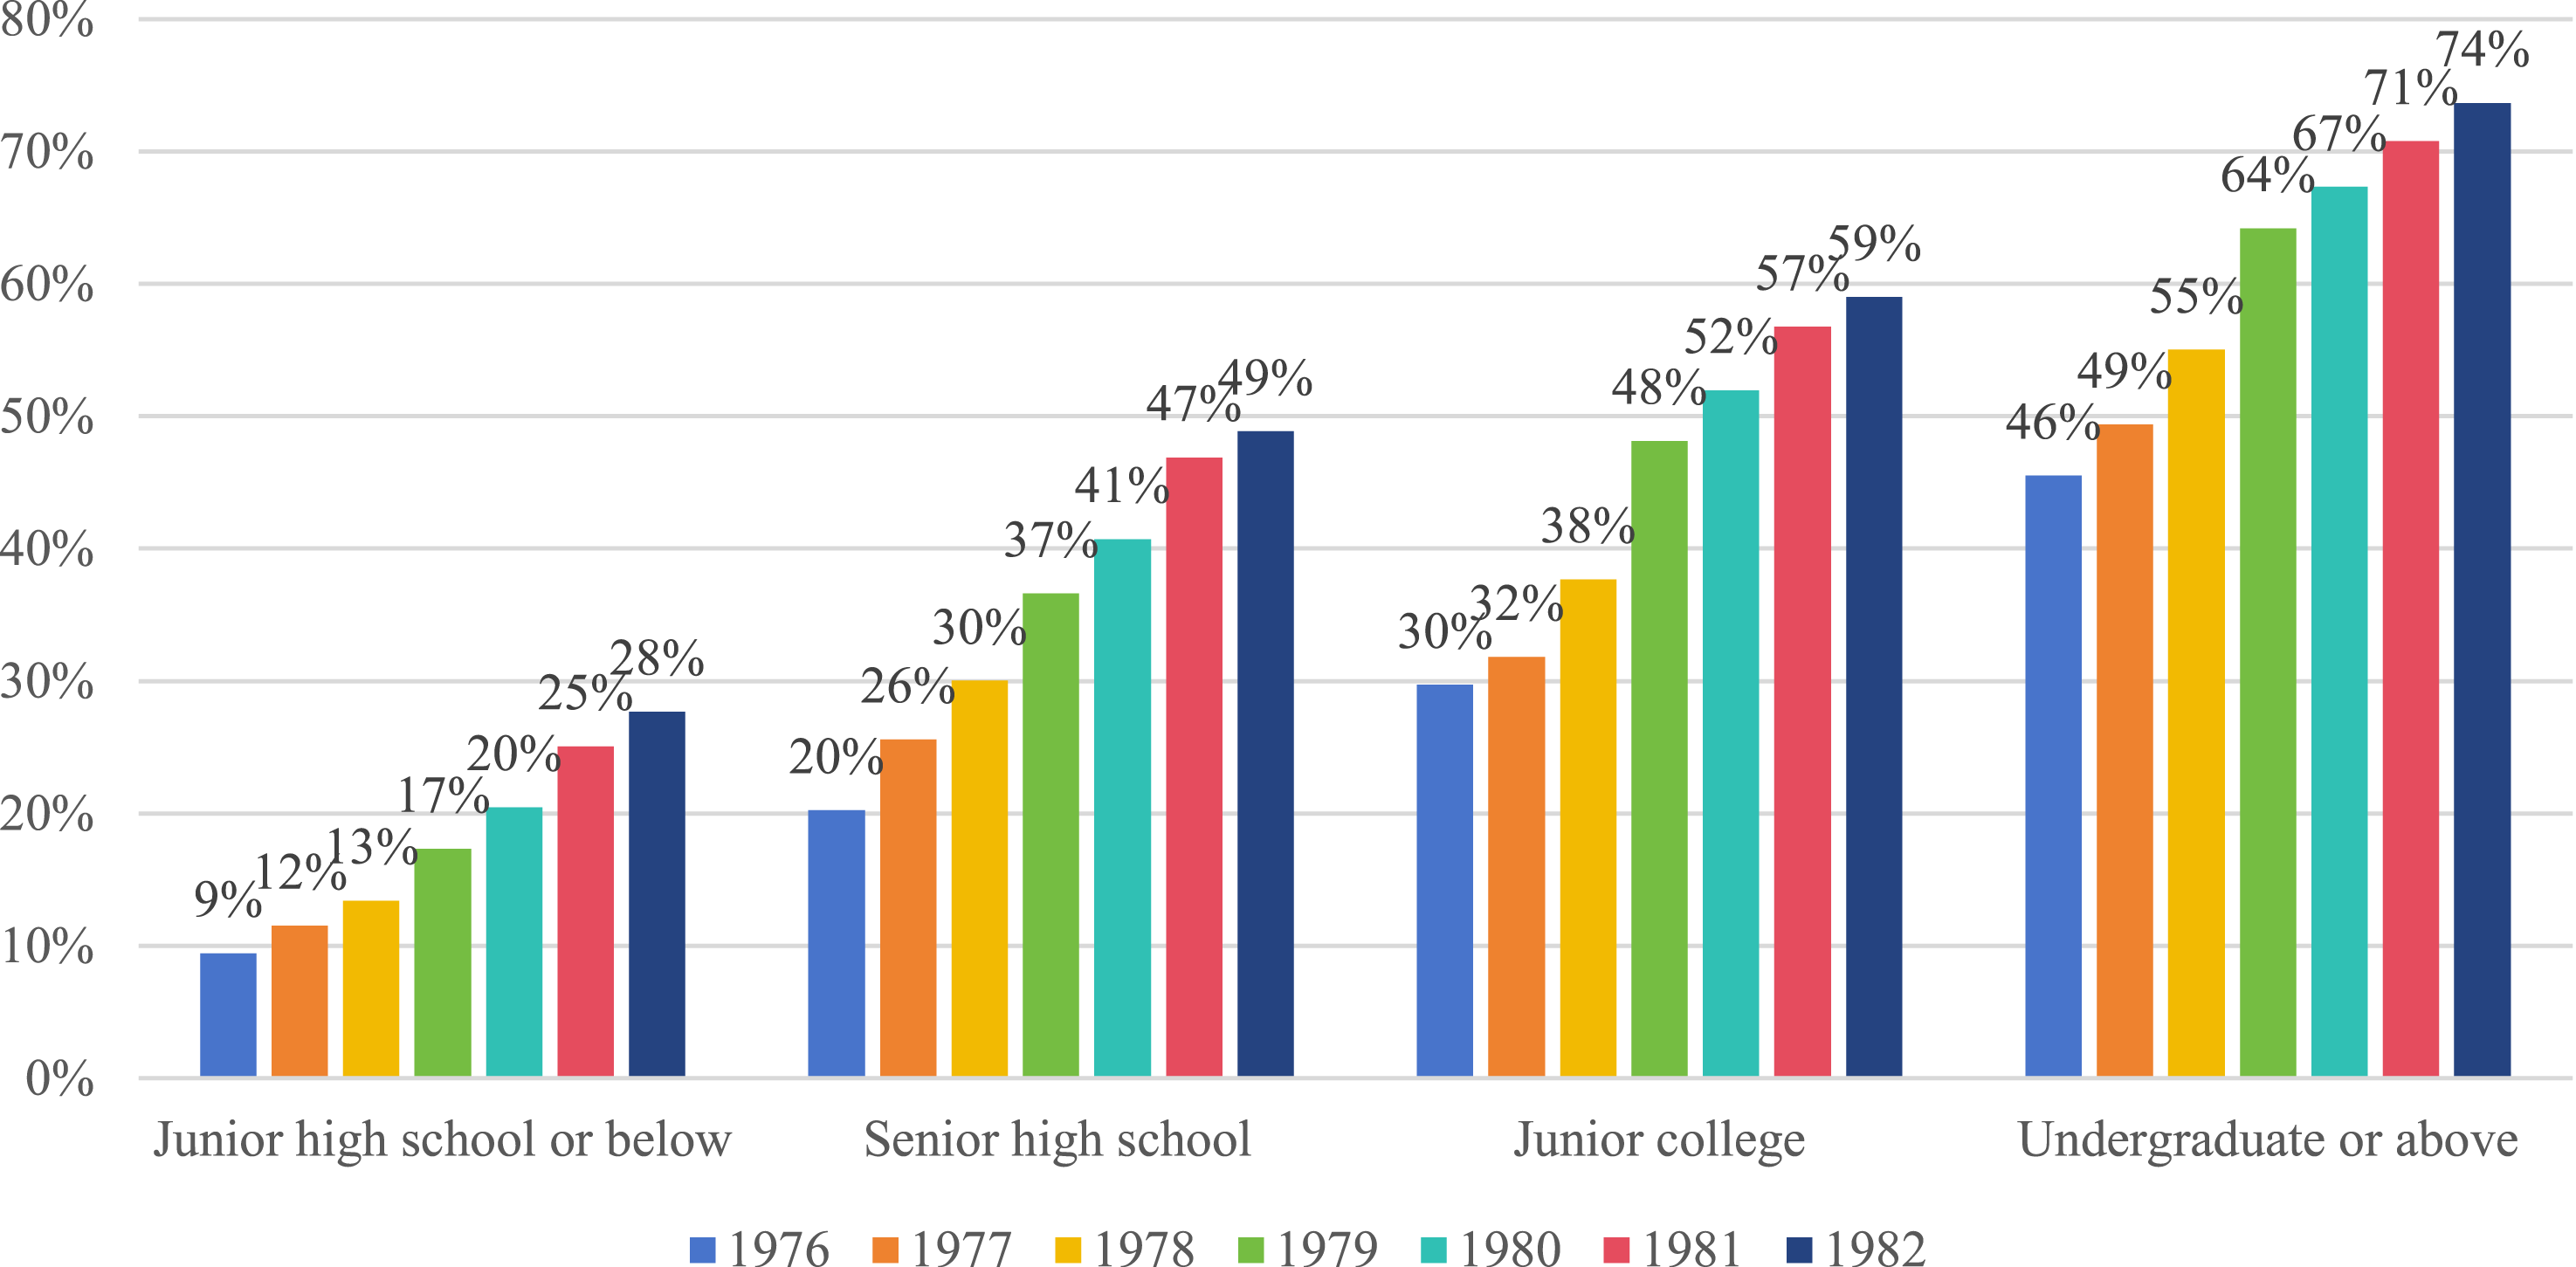
Trends in the proportion of the middle-income group by educational attainment in the United States (1976–1982).
Discussion
First, this study found that while workers with higher education qualifications comprise the highest percentage of middle-income earners, the total number of this group is relatively small. Therefore, it is suggested to further increase and accelerate the supply of higher education opportunities. According to data from recent years, in China, workers with higher education qualifications are more likely to progress into the middle-income group than those with only an elementary or secondary education. Therefore, increased opportunities for higher education enrollment should be afforded to enable more workers to receive higher education, improving their chances of moving into the middle-income bracket. Meanwhile, when the share of the middle-income group in the U.S. workforce grew to 48% in 1982, that of workers with higher education qualifications had already reached 34%. However, in China, the percentage of workers with higher education qualifications was only approaching 15% in 2018. According to empirical data from the United States, when a major economy has grown to the point where close to half of the population is earning a middle-range income, as a rule of the overall education level, nearly one-third of workers should possess higher education qualifications. Evidently, China has a considerably long journey to reach this point. To shorten the distance as quickly as possible, there is an unequivocal need to increase the supply of higher education opportunities promptly.
Second, this study found that there is a yawning gap in personal income between those with a graduate degree and junior college-level education—one that appears to widen gradually. Therefore, it is recommended to focus on undergraduate education when implementing the policy of expanding enrollment in universities. This is mainly because in terms of planning and organizing higher education, if the goal is to create more middle-income earners, providing opportunities for undergraduate education is more likely to succeed than offering opportunities for specialized education. In addition, it is also recommended to increase the quota of undergraduate places for junior college graduates, as appropriate. Offering opportunities for pursuing further undergraduate studies to junior college graduates—especially those who would clearly struggle to advance into the middle-income group—comes at a relatively low cost to the country and individuals and can significantly improve income levels. As such, future studies should focus on the post-degree income and percentage of middle-income earners among junior college graduates who pursue undergraduate studies and compare them with other graduates of undergraduate programs to provide more rigorous evidence in support of this policy recommendation.
Thirdly, this study found that for both undergraduate and college graduates, the percentage of middle-income earners at the beginning of graduation is the lowest, and the fourth to fifth year after graduation is an important period for a significant increase in percentage of middle-income earners. The inspiration of this discovery lies in the fact that there are currently few unified evaluation indicators for the output effectiveness of universities in China, and therefore, it is recommended to use the percentage of middle-income earners of graduates as an important indicator for evaluating the effectiveness of university and professional construction. In terms of data collection, a long-term tracking survey should be adopted, with a focus on important nodes such as graduation and the four to five years after graduation. Furthermore, a tracking survey every five years can be adopted.
Fourthly, this study found that the total number of high school graduates in China is large, while the percentage of middle-income earners is relatively low. The majority of people who have graduated from high school and entered the labor market comprise those who have failed the college entrance examination. Most people in this group spent their senior high school years preparing for college but received little to no employment-related education. Consequently, they failed the college entrance examination and experienced frustration upon entering the labor market. To address this situation, it is necessary to develop and implement a senior secondary education curriculum system equipped to improve students’ employability, fulfilling the educational obligation to students denied by the college entrance examination. Alternatively, some developed and developing countries can refer to pre-employment education programs for disadvantaged students in the labor market, funded by the state or public welfare organizations, to recruit enterprises, various schools, etc., to provide pre-employment education, training, and guidance, to improve the employment rate and income level of these graduates (Escudero et al., 2019; Oh et al., 2021).
Last, this study found that a smaller percentage of graduates from secondary vocational schools became middle-income earners compared to those from regular senior high schools. Therefore, drastic measures should also be taken to improve the percentage of middle-income earners among graduates from secondary vocational schools. Moreover, unlike regular high school education, secondary vocational education mainly caters to the job market. As such, graduate income levels and respective places in income classes are key measures for evaluating this type of education. According to empirical evidence from the United States, by the time the size of the middle-income group had doubled, 49% of senior high school graduates had progressed into the middle-income group. This suggests that there is hope for the secondary vocational education system to improve—perhaps even drastically—the proportion of middle-income earners among their graduates. The general focus should be on directly addressing the needs and feedback of the labor market, and based on the percentage of middle-income earners among graduates, enhancing the development of institutions and areas of specializations better received by the market while thoroughly overhauling, adapting, and closing or merging the poorly received ones.
To sum up, given China's objective of doubling the size of its middle-income group by 2035, this study analyzed data obtained from household panel surveys in China and the United States to identify the general patterns underlying the role of education in expanding the middle-income group. Based on this analysis, this study discussed several goal-setting and implementation pathways for expanding the middle-income group through the development of education. Nonetheless, this study has some limitations. Notably, this study did not apply causal inference methodologies to eliminate other possible causal explanations. Accordingly, the research findings obtained at this stage should be considered preliminary evidence. A more detailed descriptive analysis of data should provide a fuller picture of the education system and discern the relationships between different types and levels of education and various income groups. It will also clarify the short- and long-term impacts of education level on income class in a more granular and intuitive manner. Future quantitative studies should adopt more rigorous causal inference methodologies and focus on certain key areas to develop more comprehensive arguments about key issues.
Footnotes
Authors' note
Please note that the affiliation for the corresponding author, Xiuxiu Yang, has changed since manuscript submission. The current affiliation is: The Institute of Guangzhou Education Research, Guangzhou, China. The corresponding author's current email address is
Contributorship
Chen Xie was responsible for writing the bulk of the body text, mainly the establishment of the paper's ideas and the presentation of the results. He covered various aspects of the study, including exploring the role of education in fostering middle-income earners in China, elucidating the development and current status of the capabilities of education in this regard. Xiuxiu Yang was responsible for writing the Abstract and the Discussion, finalizing the paper, and responding to reviewers’ comments. She contributed by searching for literature, collecting and analyzing data, processing variables, creating charts, etc.
Declaration of conflicting interests
The authors declared no potential conflicts of interest with respect to the research, authorship, and/or publication of this article.
Funding
The authors disclosed receipt of the following financial support for the research, authorship, and/or publication of this article: The study was funded by the National Social Science Fund of China (Grant CGA190249).