
Abstract
Highlights
We examined the results of a large-scale national survey of online secondary education in China. The online survey of 33,194 high school students and 5,667 teachers has provided comprehensive and representative data regarding the quality of online education and its implementation during the pandemic. Questionnaire surveys administered to students and teachers in different grades and comparative analysis of different cohorts revealed group heterogeneity of the online learning effect. The findings have elucidated the emergency teaching situation in China during the pandemic, yielding targeted suggestions for school education following the resumption of classes.
The pandemic significantly affected global schooling (OECD, 2020). China was the first country to move formal primary and secondary education online in January of 2020. China's Ministry of Education (MOE) named this measure “nonstopped teaching and learning,” emphasizing that “school opening is delayed, but learning is on schedule.” This resulted in the largest online teaching and learning initiative in history, with both the largest number of online courses and the greatest participation of teachers and students on record (Wang, 2020).
To gain an in-depth understanding of high school students' online learning during the pandemic, the Center for Research on Education Data in the Graduate School of Education at Peking University conducted the “China National Survey of High School Online Learning During the Pandemic” before schools resumed regular offline meetings. Teachers and students from 164 high schools in eight provinces (Fujian, Jiangxi, Hebei, Sichuan, Liaoning, Guangdong, Shandong, Anhui), one municipality (Beijing), and one autonomous region (Guangxi Zhuang Autonomous Region), participated in the online survey.
Survey respondents covered all students (Grades 1–3, i.e., equivalent to K10–K12) in every senior high school and their teachers. Questionnaires mainly focused on the online learning conditions and environment, teaching preparation and supervision, evaluation of the learning effect, physical and mental health, and labor education. By May 20, 2020, the research team received 33,194 valid student questionnaires, comprising 12,033 first graders, 10,095 second graders, and 11,066 third graders, with 16,525 boys and 16,669 girls. Additionally, 5,667 teachers completed questionnaires, with the gender breakdown being 2,268 males and 3,399 females teachers. Of the teacher respondents, 96% held a bachelor's degree or above. This research was carried out during the pandemic, and it was difficult to carry out offline investigation. We used the online questionnaire survey to collect data. It was a large-scale national survey, and difficult to sign written informed consent forms with all participants. However, the survey questionnaire provided an ethical statement at the beginning, clearly stating that it does not involve personal information and that the collected data is only used for scientific research.
Brief descriptive findings
This section briefly reports the survey findings regarding online teaching equipment and Internet access, online teaching modes, online education satisfaction, changes in academic performance, physical health, mental health, preparedness for the college entrance examination and further education options, and labor education.
Online teaching equipment and Internet access
Concerning the number of electronic devices possessed by students from different family backgrounds, the survey results showed that students from the middle- to high-income families tended to own more electronic devices. On average, students from lower-income families owned 0.75, whereas students in low-income familial conditions owned an average of 0.77. In contrast, on average, students from middle-income families owned 1.33 electronic devices, and those from higher-income families owned 2.07, whereas those from very high-income families owned 2.54. Examination of adequate electronic device possession revealed that students from lower-income families were more likely to suffer an electronic device deficiency than those from middle- and higher-income families.
According to the survey results, students from rural areas possessed an average of 0.91 electronic devices, which was markedly lower than the average of 1.42 units per student in non-rural areas. Of the students from rural areas, 24.6% possessed insufficient electronic devices—a much larger proportion than the 15.3% of students from non-rural areas who also suffered a deficiency. Moreover, 37.1% of the students from lower-income families were found to lack sufficient electronic devices, whereas just 12.1% of the students from middle-income families and 6.3% of those from high-income families did not possess any of the necessary electronic devices.
Concerning Internet access, approximately 34% of the students from rural areas and 19.8% of the students from non-rural areas lacked Internet access. By household income level, 47.3% of the students from low-income families, 22.8% from middle-income families, and 15.4% from high-income families reported having no Internet access.
Concerning students’ online learning experiences, nearly 60% reported encountering technical problems due to equipment deficiency and/or Internet problems when studying online. More specifically, 56% of the non-rural students and 76% of the rural students reported such experiences.
Regarding teaching, the teacher data showed that teachers identified the “Internet environment” (approximately 40%), “electronic device malfunction” (11.82%), and “electronic device deficiency” (19%) as the most important factors influencing online teaching. Moreover, only about 50% of teachers reported being satisfied with the Internet speed for online teaching. Approximately 20% reported experiencing a lagging Internet connection three or more times a day when teaching online. However, 20% of teachers reported smooth teaching with no Internet problems.
Online teaching
Online teaching modes
Regarding online teaching modes, 81.33% of the students reported learning online by attending teachers’ live virtual classes, 31.34% reported doing online Q&A, 27.54% reported watching their teachers’ recorded classes, and 26.14% reported listening to presentations by famous teachers not affiliated with their schools.
The teacher data provided similar results. Approximately 80.67% of the teachers reported teaching live online, with online Q&A (44.96%) and WeChat phone calls (41.16%) as popular auxiliary teaching modes. In contrast, a relatively low proportion of teachers reported posting prerecorded classes (28.79%) and conducting online meetings (24.31%).
Learning materials and tests
The survey results showed that 6.22% of the student respondents did not use any learning materials during the pandemic. Among the students that did use learning materials, 50.21% only used one type, and 26.21% used electronic learning materials, whereas 24% only used printed learning materials. Regarding combining learning material types, 43.57% of the students used both electronic and printed materials. Accordingly, 76.42% of all students used electronic materials and 74.21% used printed materials during China's pandemic response.
During the pandemic, electronic test papers were significantly favored over traditional paper-based test papers. A total of 77.98% of the surveyed students were tested using electronic assessments, and of these, 47.84% completed the tests independently, whereas 30.14% did so under their parents’ supervision. In contrast, 28.96% of the students were examined using physical test papers, and of these, 14.58% completed the test alone, whereas 14.38% did so under their parents’ supervision. A portion of students (18.8%) did not do any exams during the pandemic.
Online interaction between teachers and students
The survey results indicated relatively little interaction between teachers and students in the online teaching environment. Regarding teacher–student interaction, teachers favored using students' names when posing questions orally (73.4%) and multiple choice test questions (45.3%). Approximately 40.4% of the teachers reported only using one form of classroom interaction, and nearly 8.3% reported not interacting with students at all when teaching online. Regarding classroom interaction frequency, 59.5% of the teachers reported having fewer than five classroom interactions per class on average, and 16.1% reported having fewer than two.
Satisfaction with online education
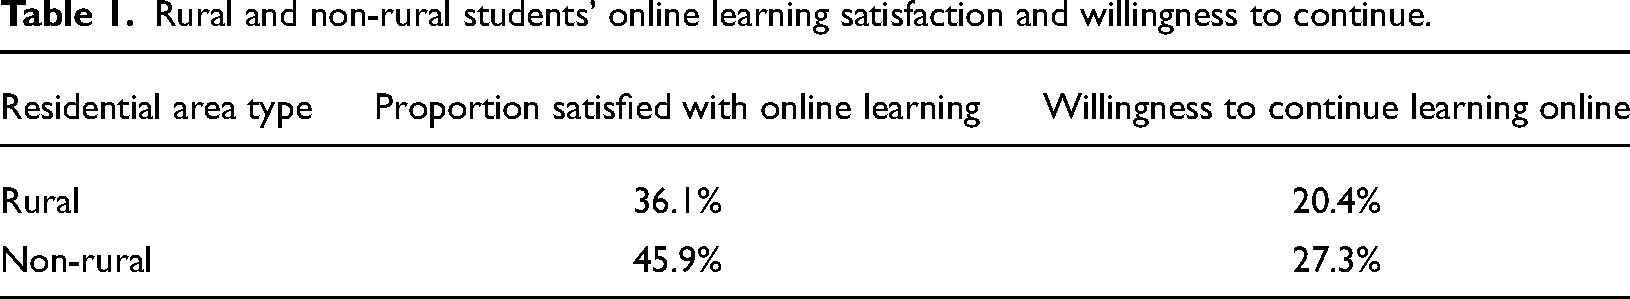
According to the survey results, only 39.7% students were satisfied with the outcome of online learning, with just 23% asserting that they would be willing to continue with online learning after the pandemic. Moreover, due to differences in equipment provision and learning environments, rural students were markedly less satisfied with online teaching and learning than their non-rural counterparts. Indeed, compared to 45.9% of non-rural students, just 36.1% of rural students reported satisfaction with their learning experience. Similarly, compared to 27.3% of non-rural students, only 20.4% of rural students reported willingness to continue using online learning. This discrepancy may be due to students’ perceptions regarding the disadvantages of online education, including the high self-discipline requirement (72.4%), low learning efficiency (54.9%), the instability of Internet connectivity (53%), and low communication efficiency (50.7%) (see Table 1).
Rural and non-rural students' online learning satisfaction and willingness to continue.
Similarly, only 26.6% of the teachers reported being satisfied with the outcome of online education, with 47.1% deeming the results of online teaching as average. Over 80% of the teachers indicated the intention to discontinue using online teaching methods after the pandemic. The survey results also showed that 60% of the teachers identified low teacher–student interaction and low communication efficiency as factors influencing their unwillingness to continue teaching online.
Changes in academic performance
Regarding academic performance, nearly half (46.95%) of all the surveyed high school students experienced a significant drop in their academic performance, whereas 34.68% maintained their pre-pandemic performance, and 18.36% showed improvement. A slightly higher proportion of third graders' academic performance improved (21.51%) compared to first graders (17.37%) and second graders (16.10%) (see Figure 1).
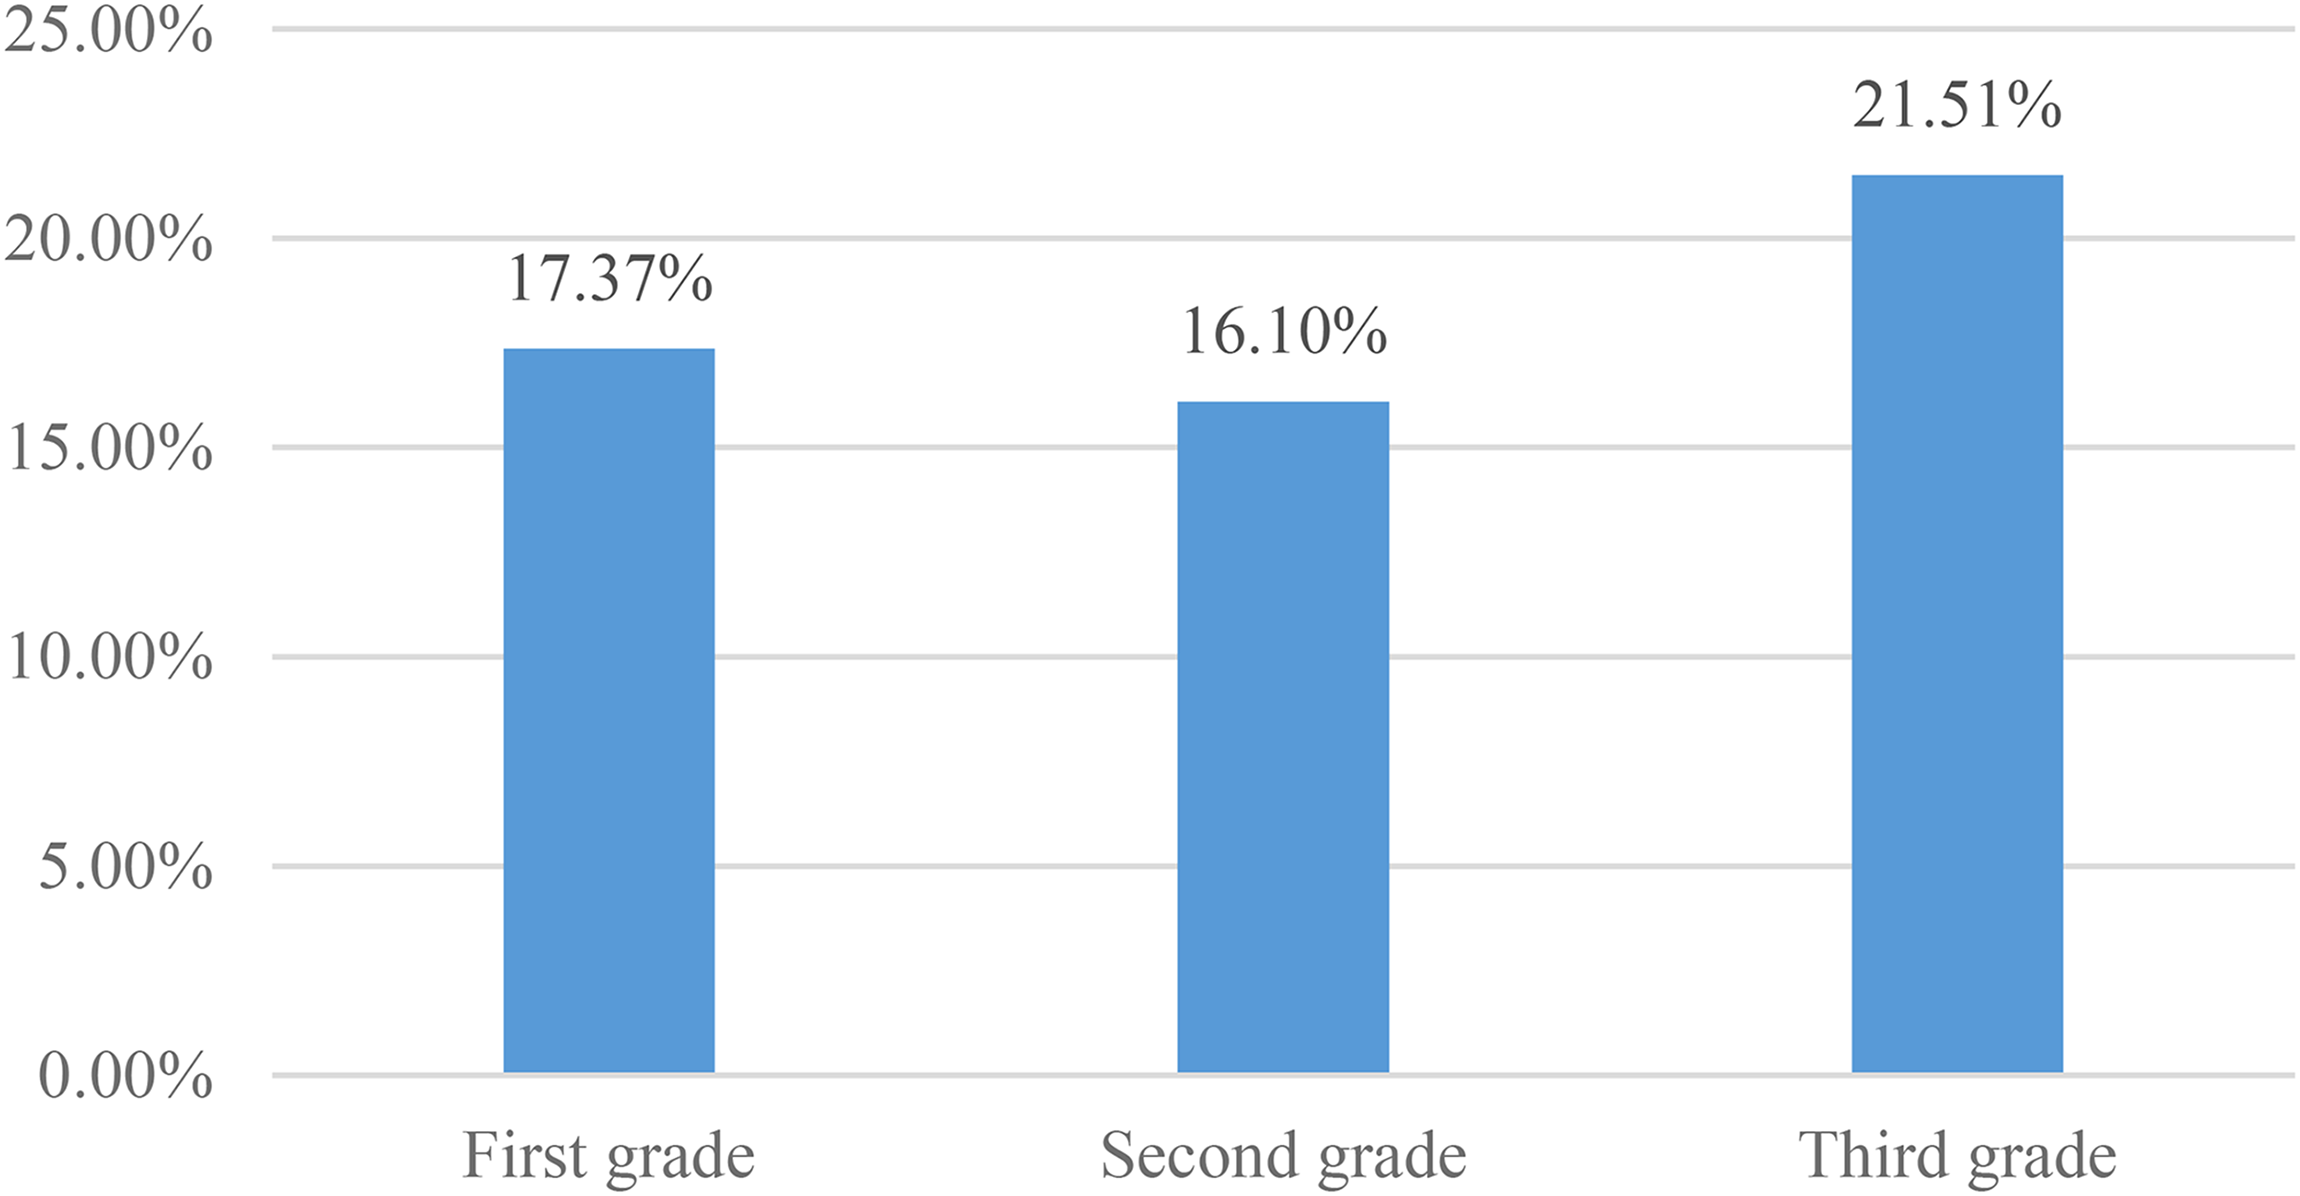
Proportion of students with improved grades.
The survey revealed differences in the impact of online teaching by subject and students’ pre-pandemic academic performance. More specifically, online teaching during the pandemic response period had a more pronounced negative impact on students' performance in science subjects. Furthermore, a greater proportion of first and second graders, compared to third graders, experienced a lower subject scores in all subjects except for Chinese. Students' science scores declined more rapidly than their scores in the liberal arts subjects. For example, 33.44% of physics students and 29.33% of chemistry students saw lower subject scores, which exceeded the number of students' with improved physics and chemistry performance by more than double (12.95% and 13.67%, respectively). However, in the liberal arts subjects, such as politics and history, the number of students who saw a decline in their academic performance only slightly surpassed those whose grades improved. For example, 15.37% of history students, 14.12% of political science students, and 15.01% of geography students showed improved subject scores, whereas 19.90% of history students, 20.97% of political science students, and 21.49% of geography students experienced a decline. Similar trends were observed among third graders.
The survey results also indicated that the impact of the pandemic differed according to students’ pre-pandemic academic performance. More specifically, the pandemic had a greater impact on low-scoring students. Students with low scores pre-pandemic were more likely to regress. For example, whereas only 17.7% of the students whose scores ranked in the top 10% of their class before the pandemic experienced a significant drop in exam scores during the pandemic, 26.5% of the students who ranked in the bottom 10% of their class before the pandemic experienced a decline in their scores during the pandemic (see Figures 2–4).
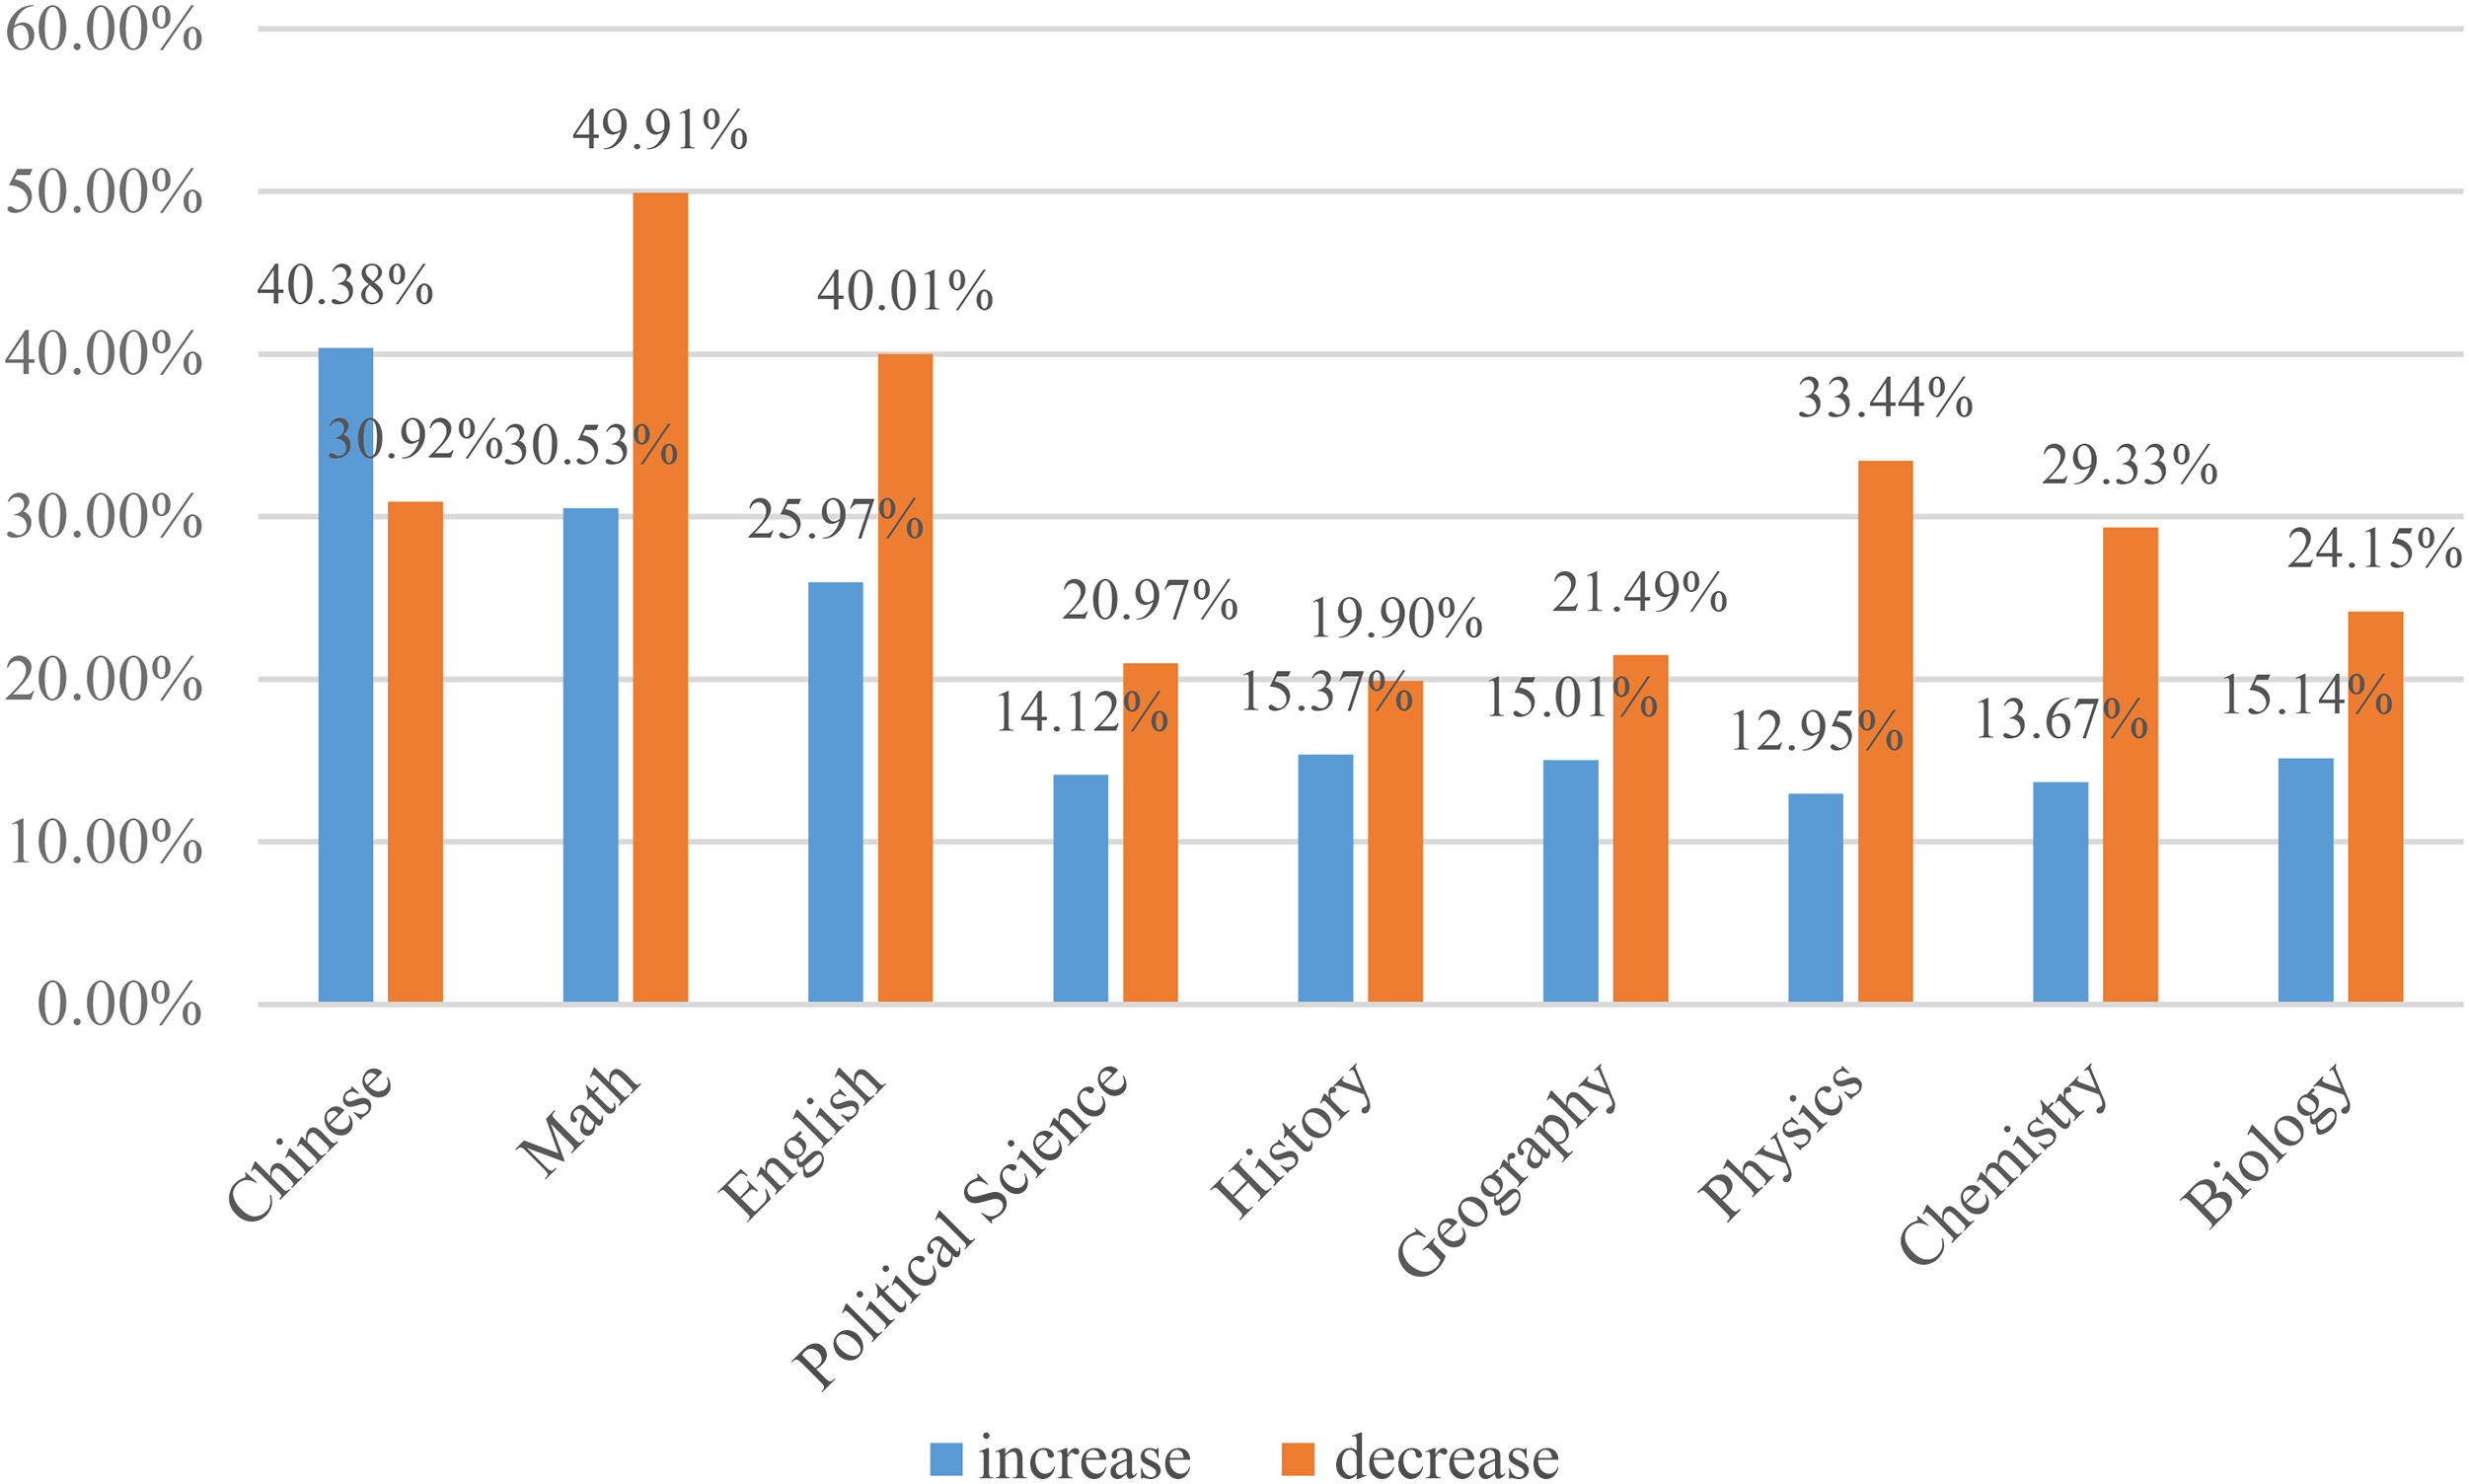
Changes in first graders' and second graders' subject scores.
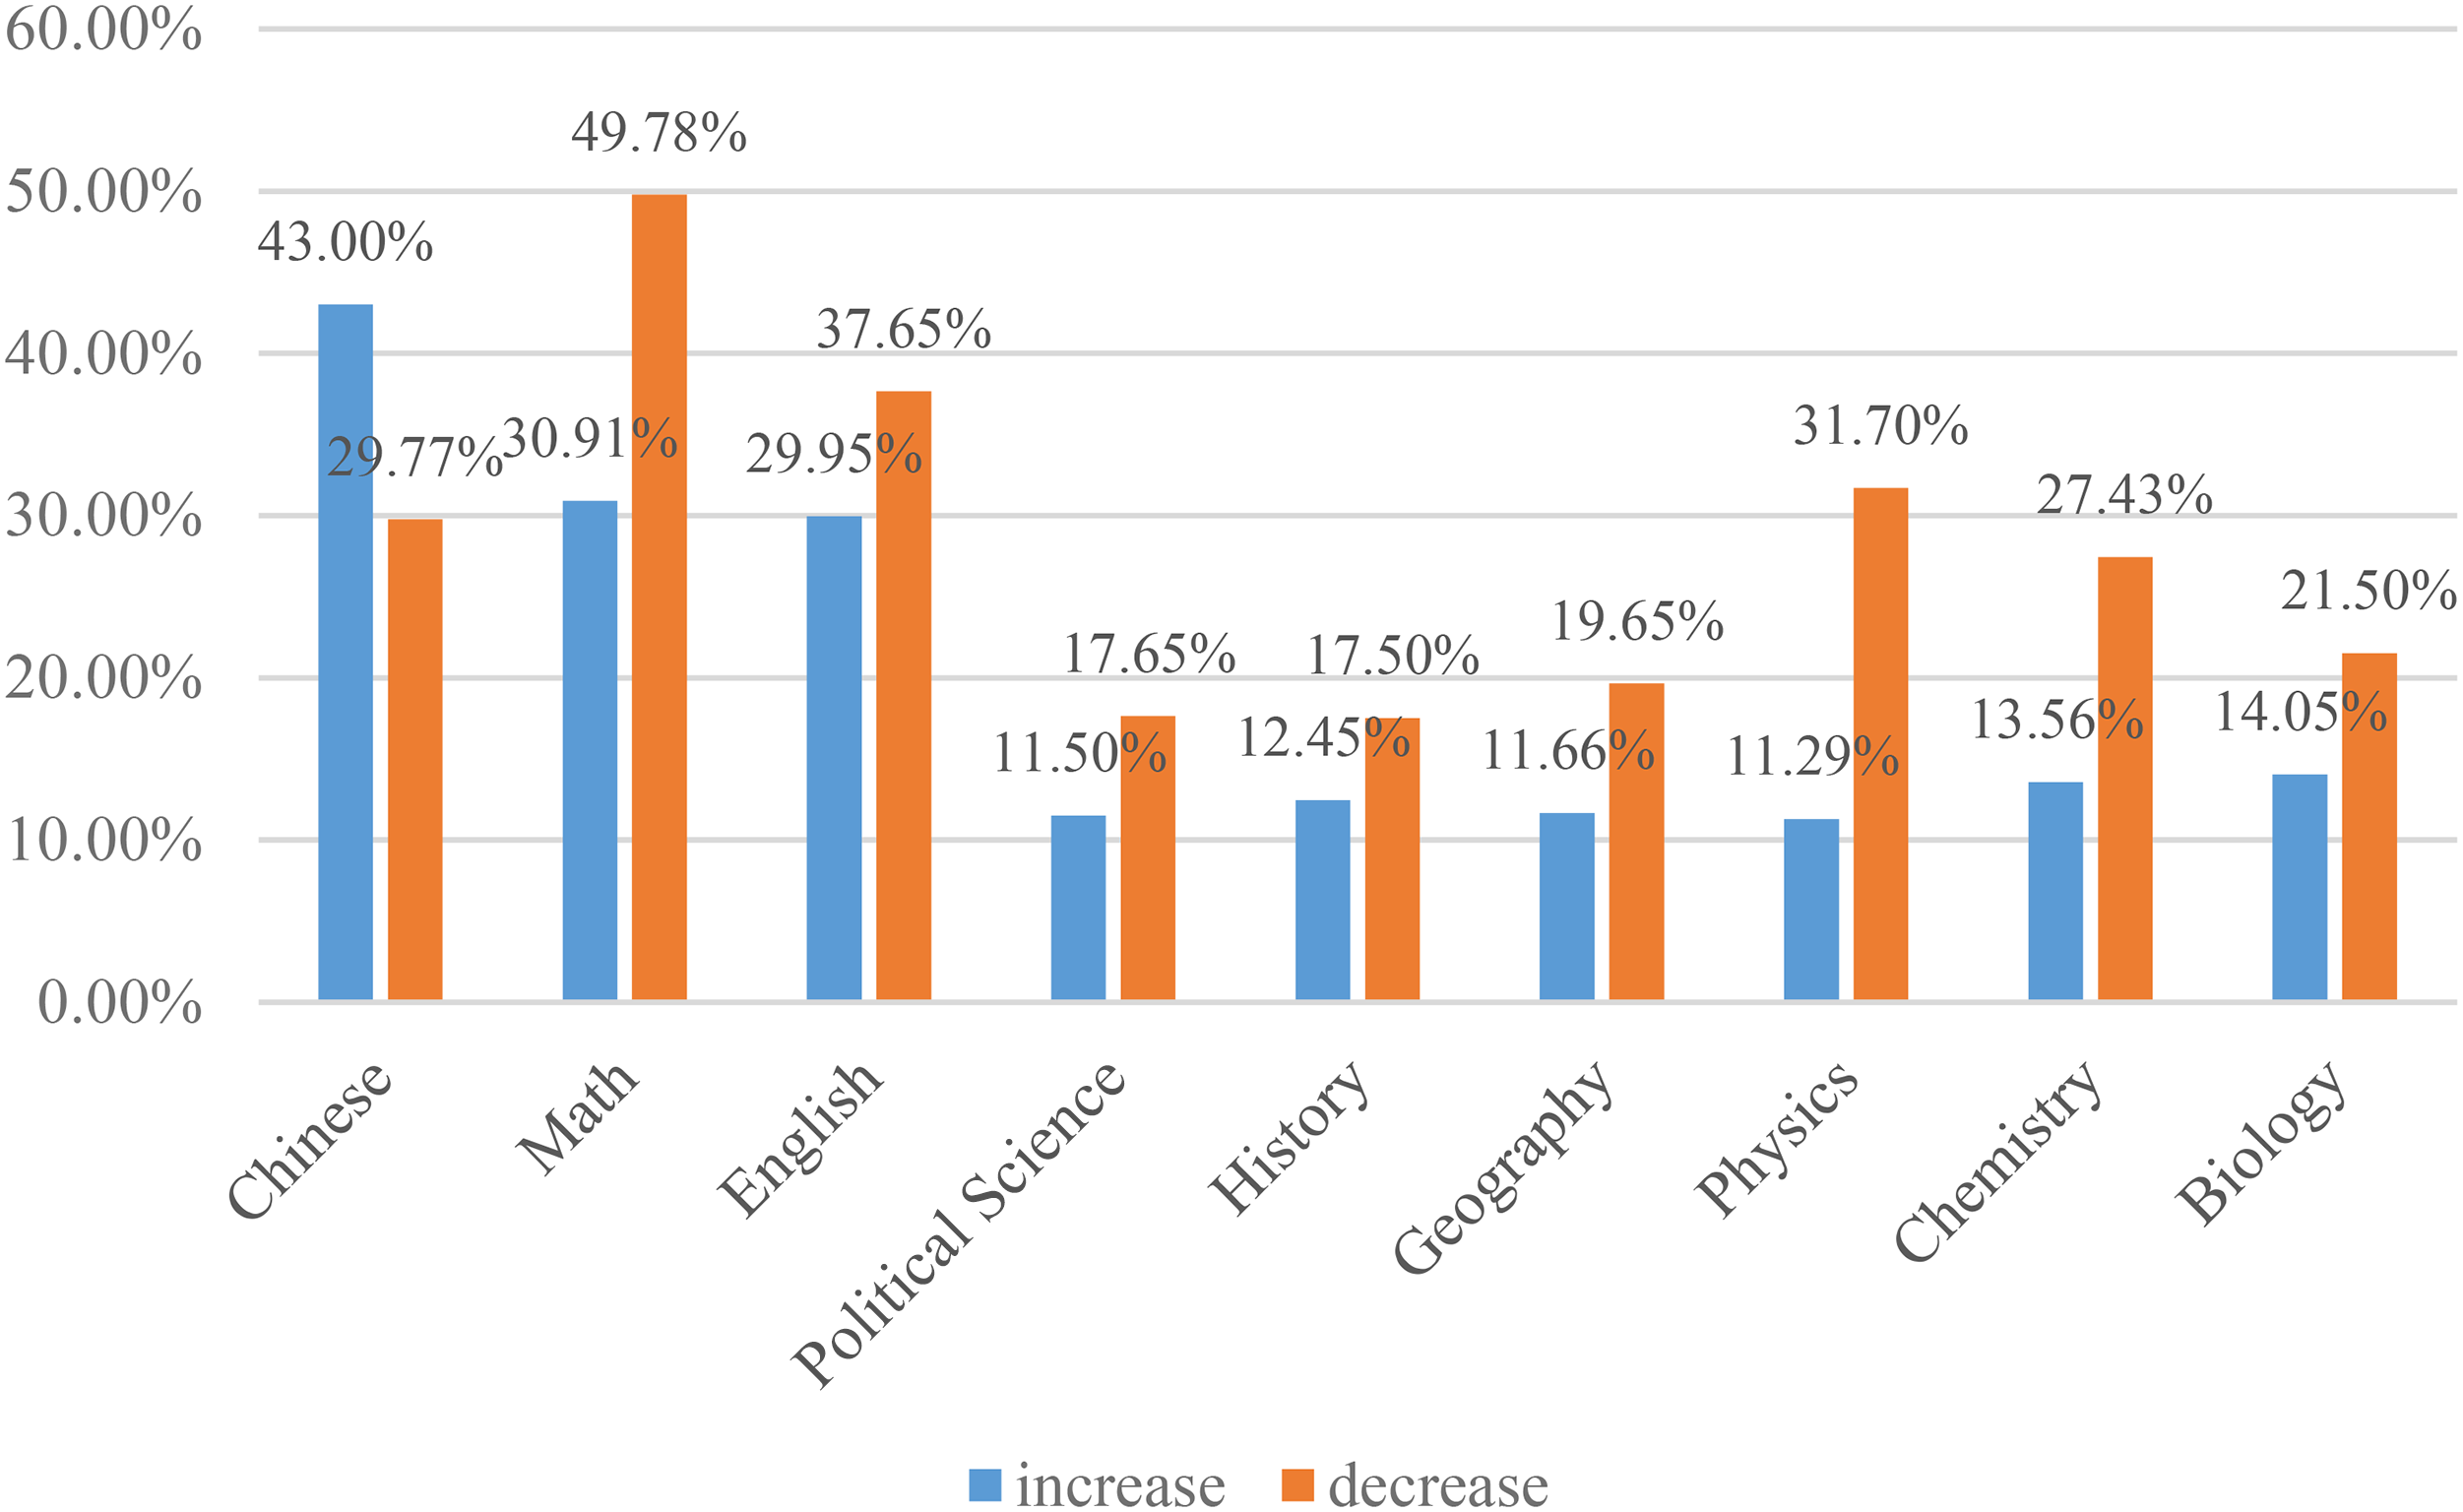
Changes in third graders' subject scores.
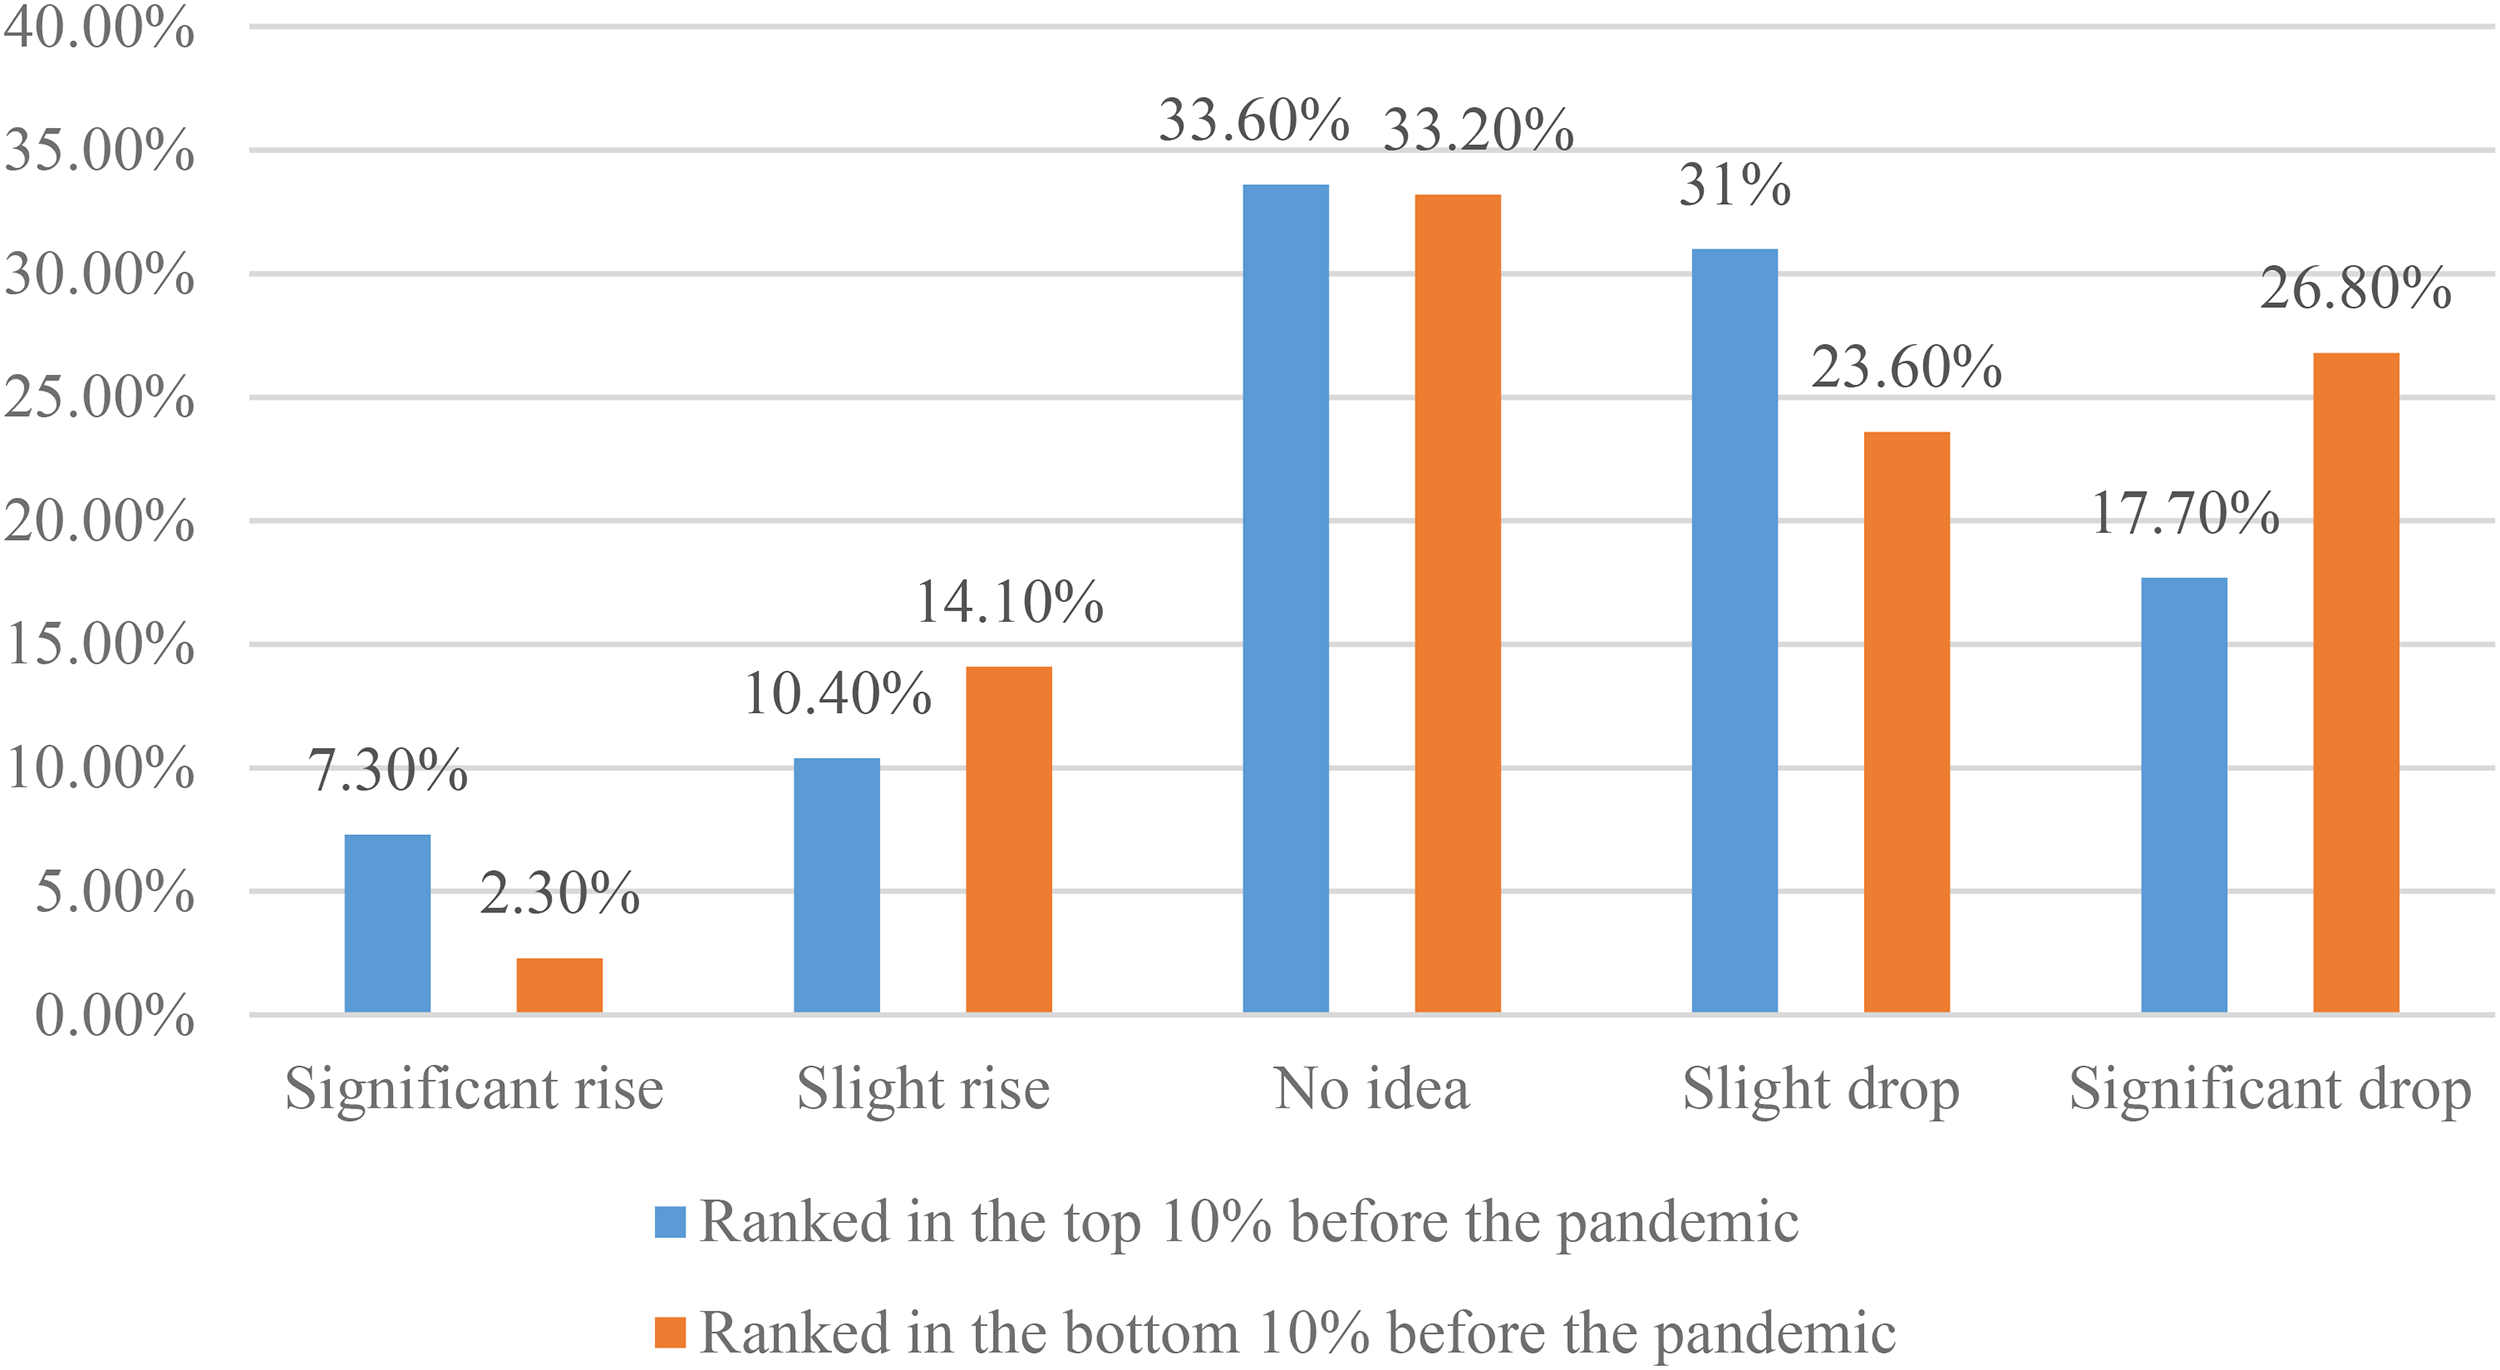
Changes in students’ performance using their pre-pandemic academic performance as a baseline.
The survey results also showed that students’ academic performance varied according to their income level and residential area type. Generally, the higher a family's income, the greater the likelihood of the student's improved academic performance. Compared to 34.9% of rural students, 43.3% of non-rural students experienced an improvement in their academic performance using their pre-pandemic scores as a benchmark. Among students from low-income households—that is, economically disadvantaged students—only 15.88% reported improved academic performance. In contrast, 18.5% of the students from middle-income families and 26.77% of those from high-income families showed improvement. Markedly, 43.75% of the students from high-income families showed improved academic performance compared to their pre-pandemic grades.
Regarding parents’ educational level, 23.1% of the students with a father with a higher education improved their grades, whereas only 17.43% of the students with a father without a higher education improved their grades. Approximately 23.23% of the students from families with high social capital improved their grades—a significantly higher proportion than students from low social capital families (17.46%).
Physical health
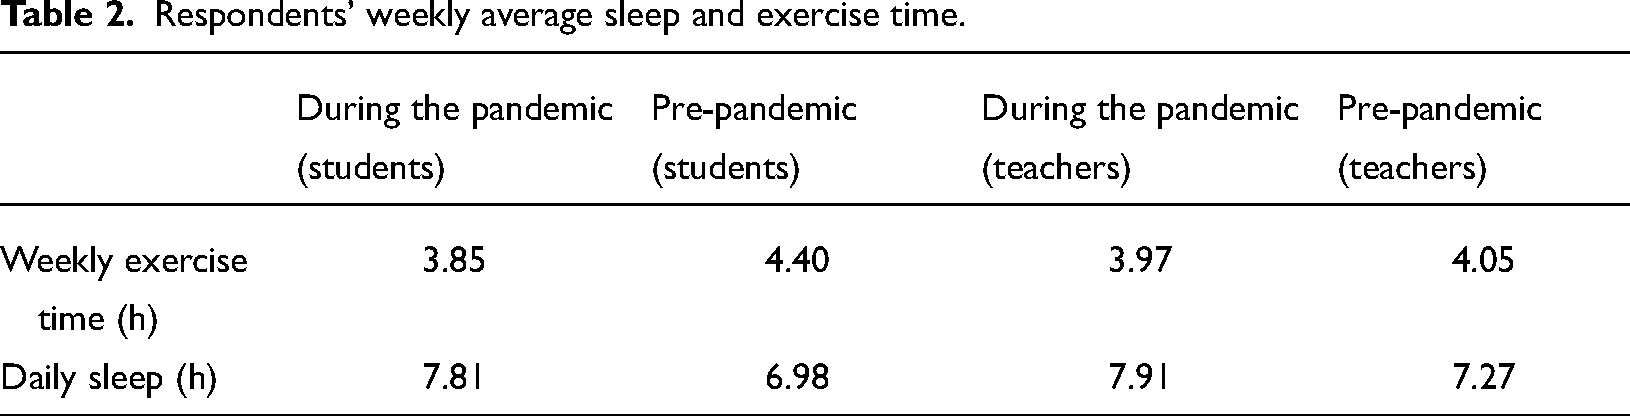
The surveyed high school students and teachers remained in good health during the pandemic, with 98.4% of the students and 98.7% of the teachers reporting never or rarely becoming sick. However, they did report a decline in weekly exercise time. Before the pandemic, students reported exercising 4.4 h a week on average, and teachers reported an average of 4.05 h; these figures dropped to 3.85 h and 3.97 h, respectively. Additionally, average sleep duration improved for both teachers and students, increasing from 6.98 h to 7.81 h (12% increase) among students and from 7.27 h to 7.91 h (9% increase) among teachers. Significantly, students still have not met the MOE guidelines published in the Comprehensive Prevention and Control of Children and Adolescents With Myopia, which stipulate 8 h of sleep per night for high school students to ensure optimal performance (see Table 2).
Respondents' weekly average sleep and exercise time.
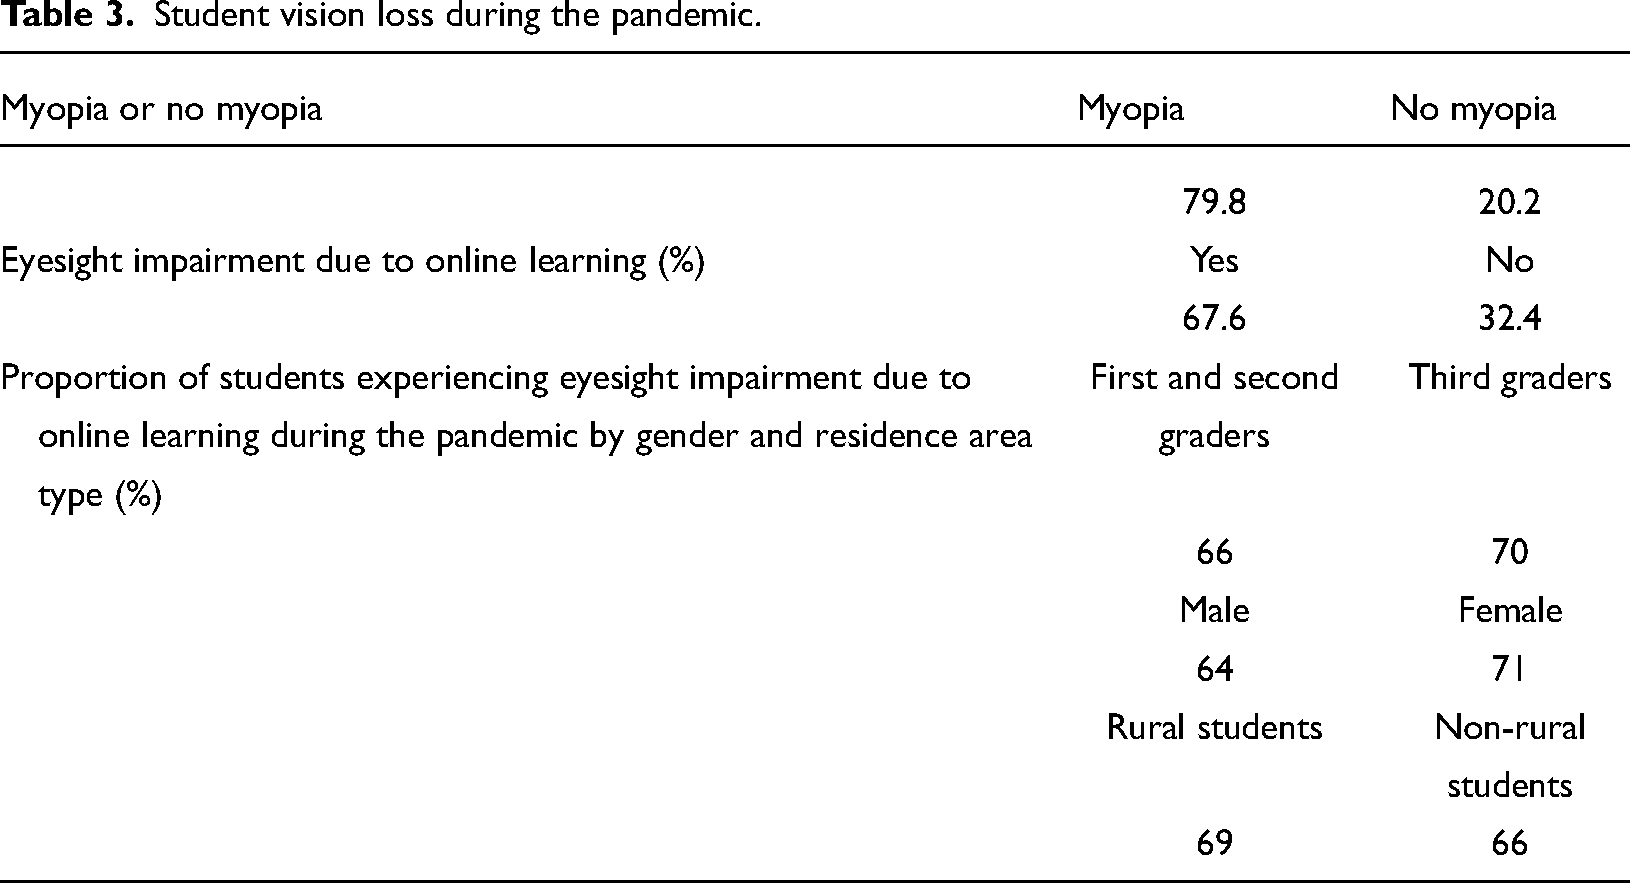
The negative impact of long-term online learning on high school students’ eyesight cannot be ignored. Approximately 79.8% reported having myopia before the investigation, and 67.6% reported experiencing impaired eyesight due to online learning. A slightly larger proportion of third graders (70%) experienced visual acuity decline compared with first and second graders (66%). Segmented by gender, 71% of females and 64% of males experienced visual acuity decline. Moreover, during the pandemic, a slightly larger proportion of students from rural areas (69%) experienced visual impairment compared with students from non-rural areas (66%) (see Table 3).
Student vision loss during the pandemic.
Mental health
The survey results indicated that students from more privileged social backgrounds had more positive attitudes. Regarding the difference between students from rural versus non-rural areas, 17% of rural students and 18.2% of non-rural students exhibited a positive attitude, including emotions like excitement, optimism, and happiness. From the perspective of family income, 35.3% of students from low-income families and 35% of those from lower-income families exhibited negative attitudes, including anxiety, nervousness, and helplessness. Approximately 28.6% of students from middle-income families and 33.3% of those from higher-income families exhibited positive attitudes. Indeed, although 18% of the students from middle-income families and 26.4% of those from high-income families showed positive attitudes, only 15.4% of the students from low-income families exhibited a positive mental state.
Regarding parents’ educational level, 18.4% of students with a father with a higher education showed a positive attitude, and 27.5% exhibited a negative attitude. Among students with a father without higher education, 17.5% demonstrated a positive attitude, and 31.4% exhibited a negative attitude. Concerning parents’ occupation, 19.3% of students with a father whose job yielded high social capital—such as executives, senior managers, professional and technical personnel, and private business owners—had a positive attitude, which was only slightly higher than the 17.3% of students with a father whose job yielded low social capital. Correspondingly, 29.5% of the students from high social capital families exhibited a negative mental state, which was slightly lower than the 30.9% of students from low social capital families who also showed a negative mental state.
The survey results showed that the pandemic greatly affected first and second graders' learning autonomy. Indeed, only 28.5% of students reported being able to concentrate on learning without disturbances from their external environment, whereas just 37.16% of students reported being able to actively learn without external pressures from teachers and parents. These results have indicated that first and second graders faced particular challenges in self-monitored learning, including indulging in more entertainment time (40.38%). However, some students reported feeling physically (30.09%) and mentally (36.57%) healthier and more comfortable during the pandemic. In contrast, third graders exhibited the highest degree of negative behavior, including tension (37.16%), fidgeting (36.07%), fear (31.61%), helplessness (30.66%), and restlessness (27.27%). Few third graders exhibited positive emotions (12.30%), including excitement (12.71%) and optimism (23.90%). Additionally, the majority of third graders (76.91%) expressed concern regarding their preparedness for the college entrance examination (see Figures 5 and 6).
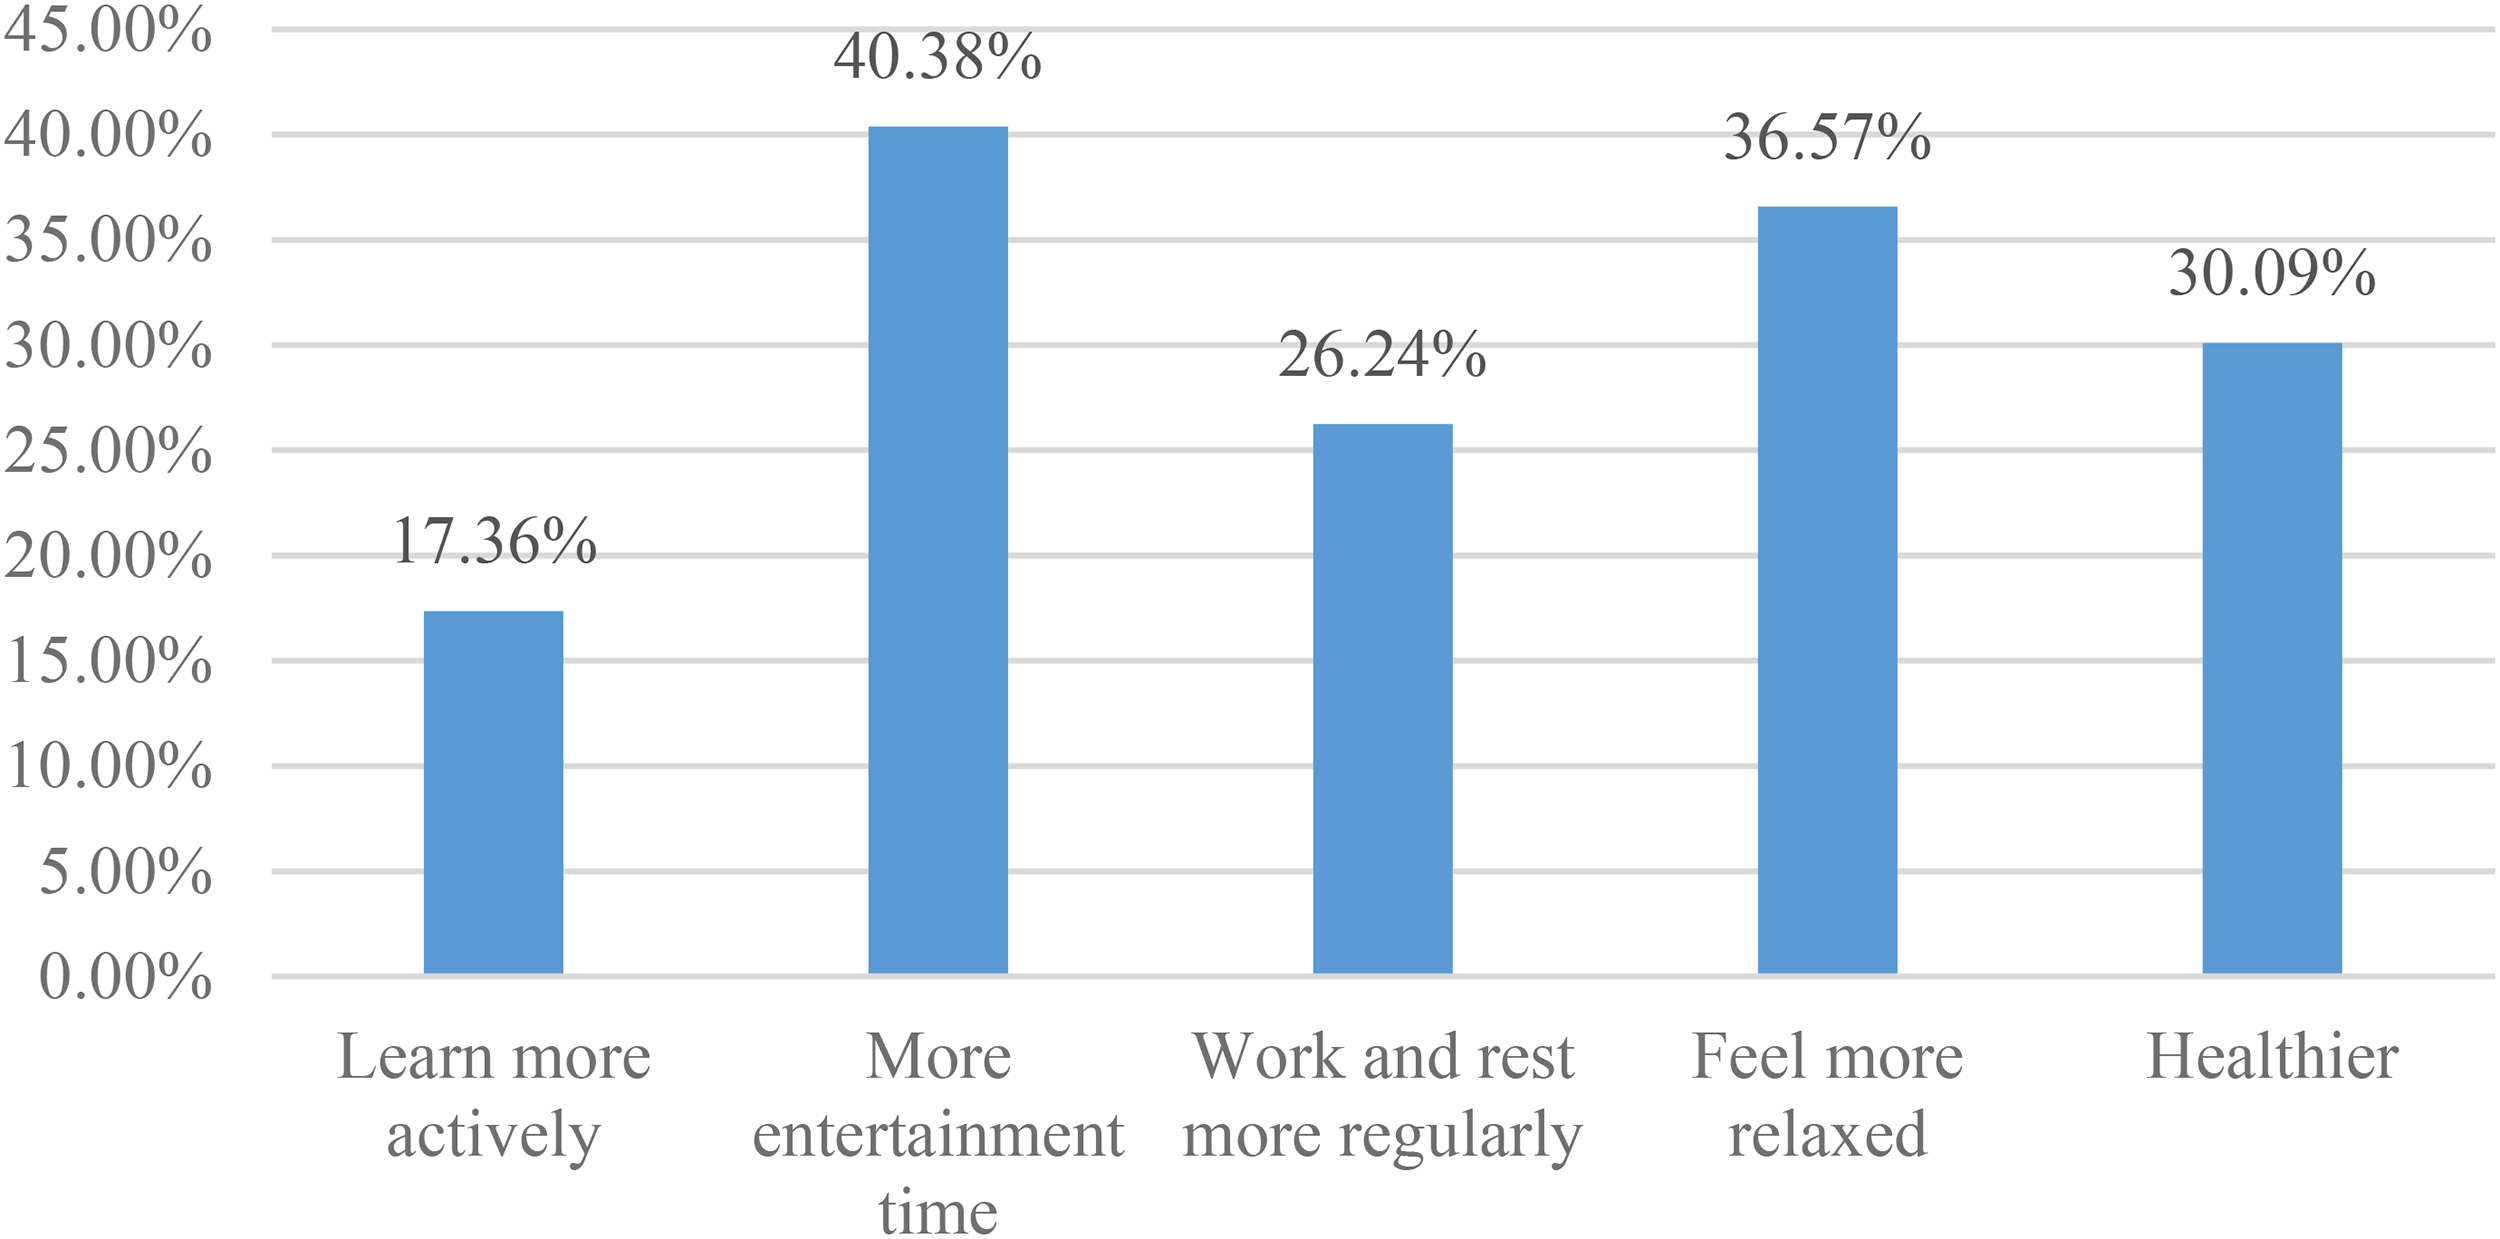
First and second graders' physical and mental states during the pandemic.
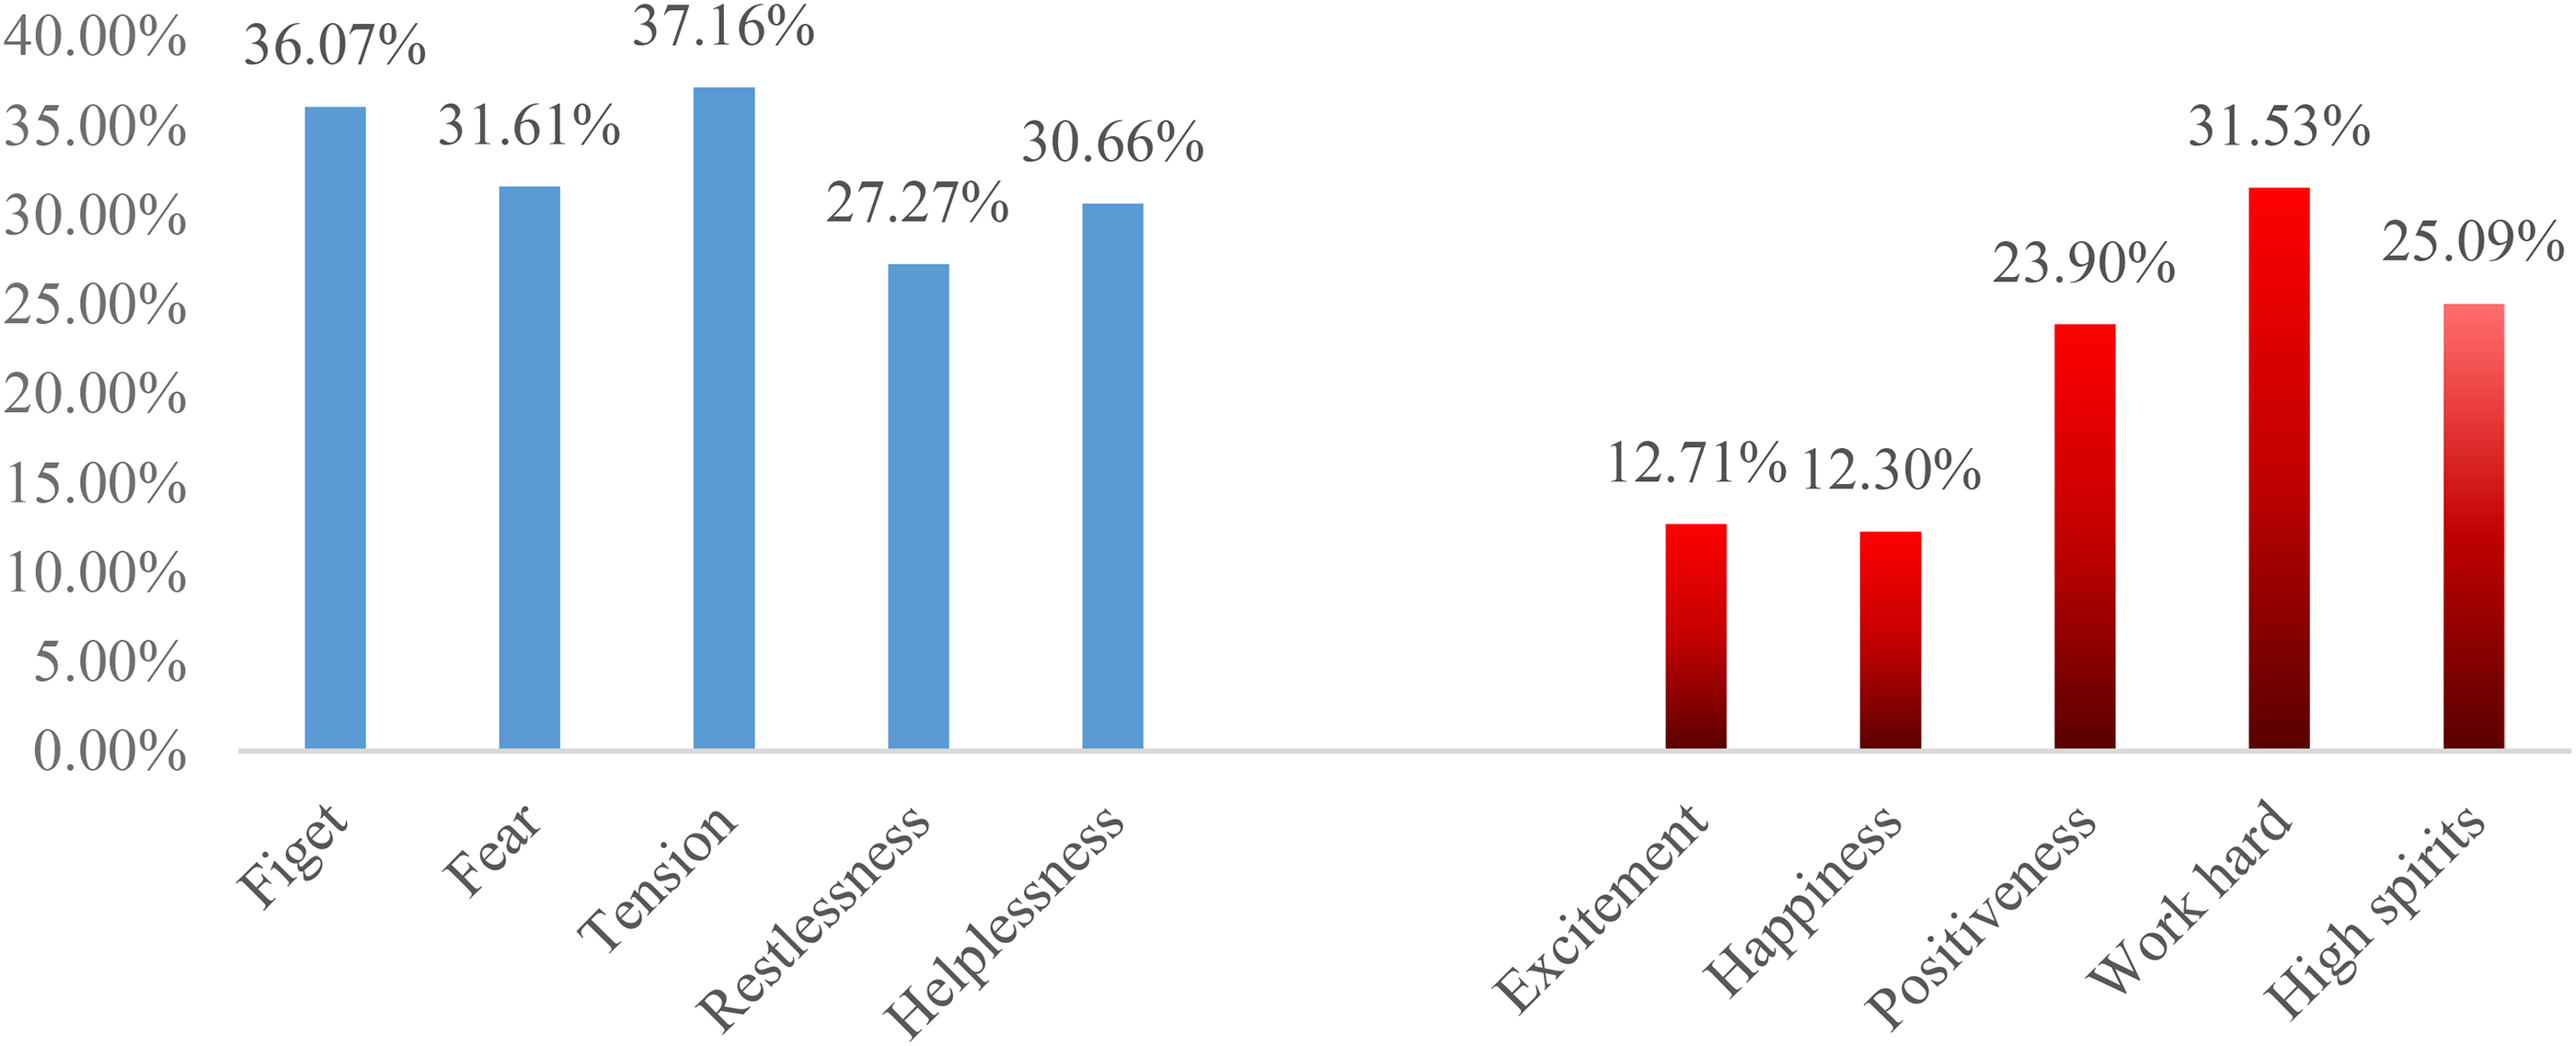
High school students' mental state during the pandemic.
Furthermore, the pandemic appears to have significantly increased high school teachers' workload and job pressure. The survey results showed that 74.78% of teachers believed that their workload had increased with the onset of the pandemic, and 61.19% perceived work pressure. Teacher respondents identified teaching (80.69%) and online teaching management (67.22%) as the main sources of work pressure. Regarding workload, teachers identified teaching tasks (44.18%) and preparing and correcting homework (56.7%) as more time consuming and labor intensive post- than pre-pandemic. Generally, although 44.18% of teachers exhibited negative emotions about daily teaching, 58.51% believed that such difficulties can be overcome or avoided going forward (see Figures 7 and 8).
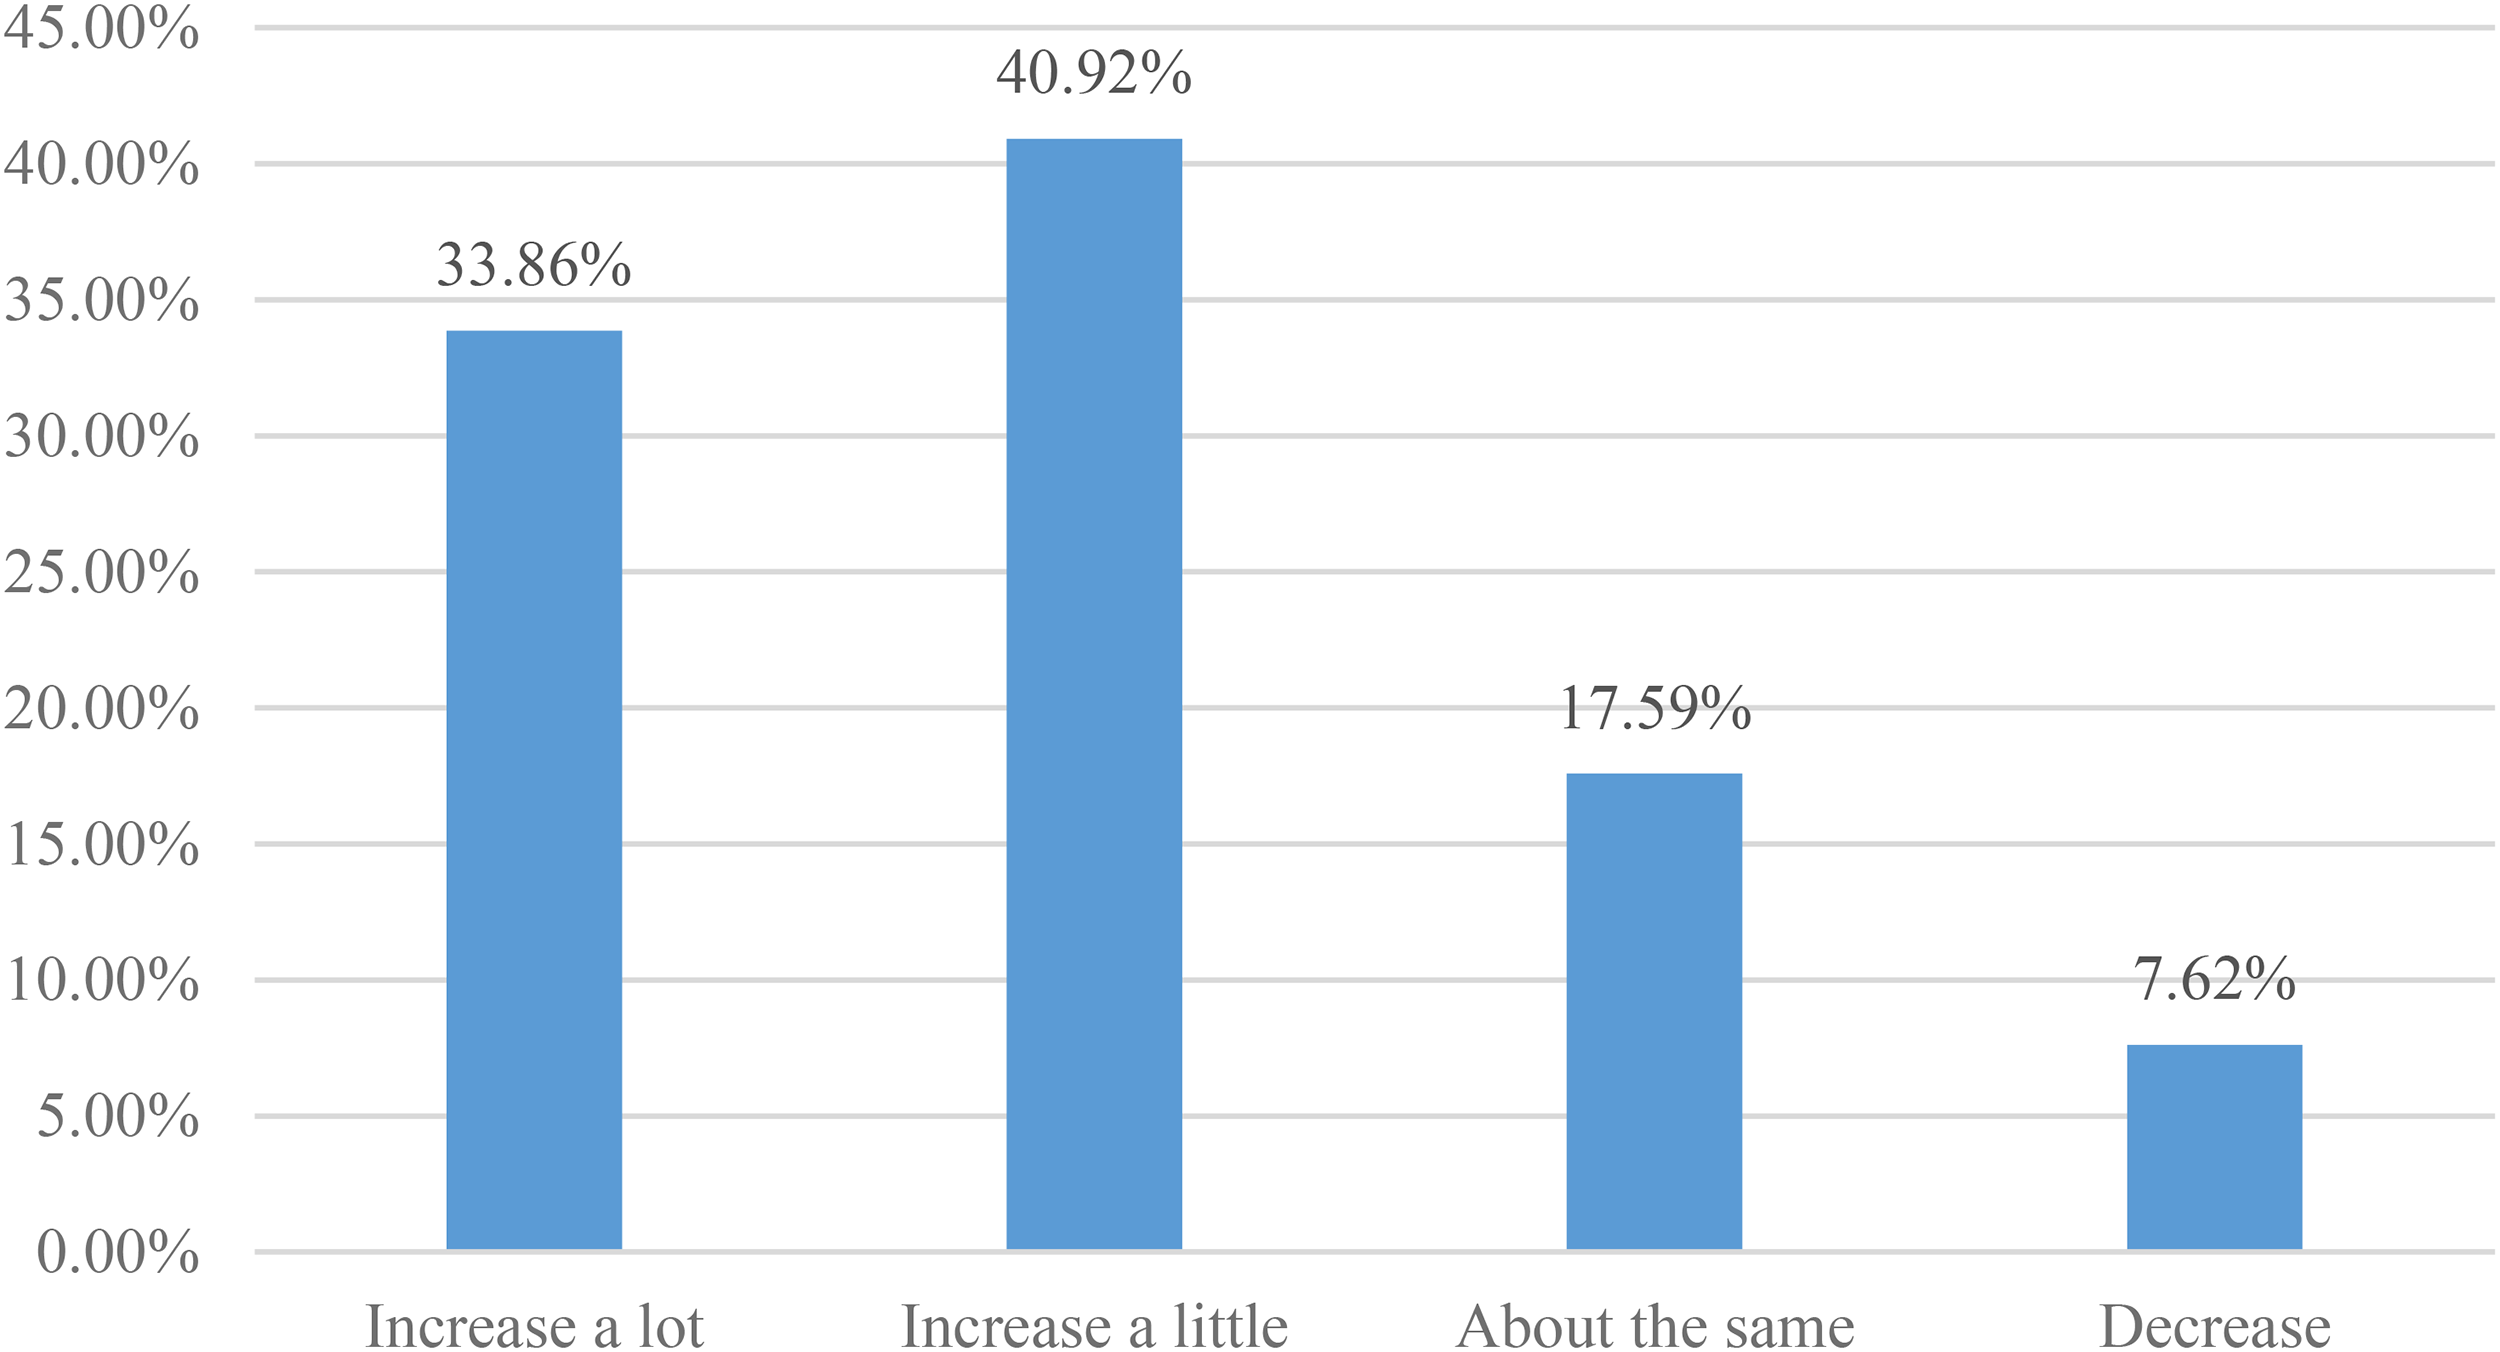
Teacher workload during the pandemic.
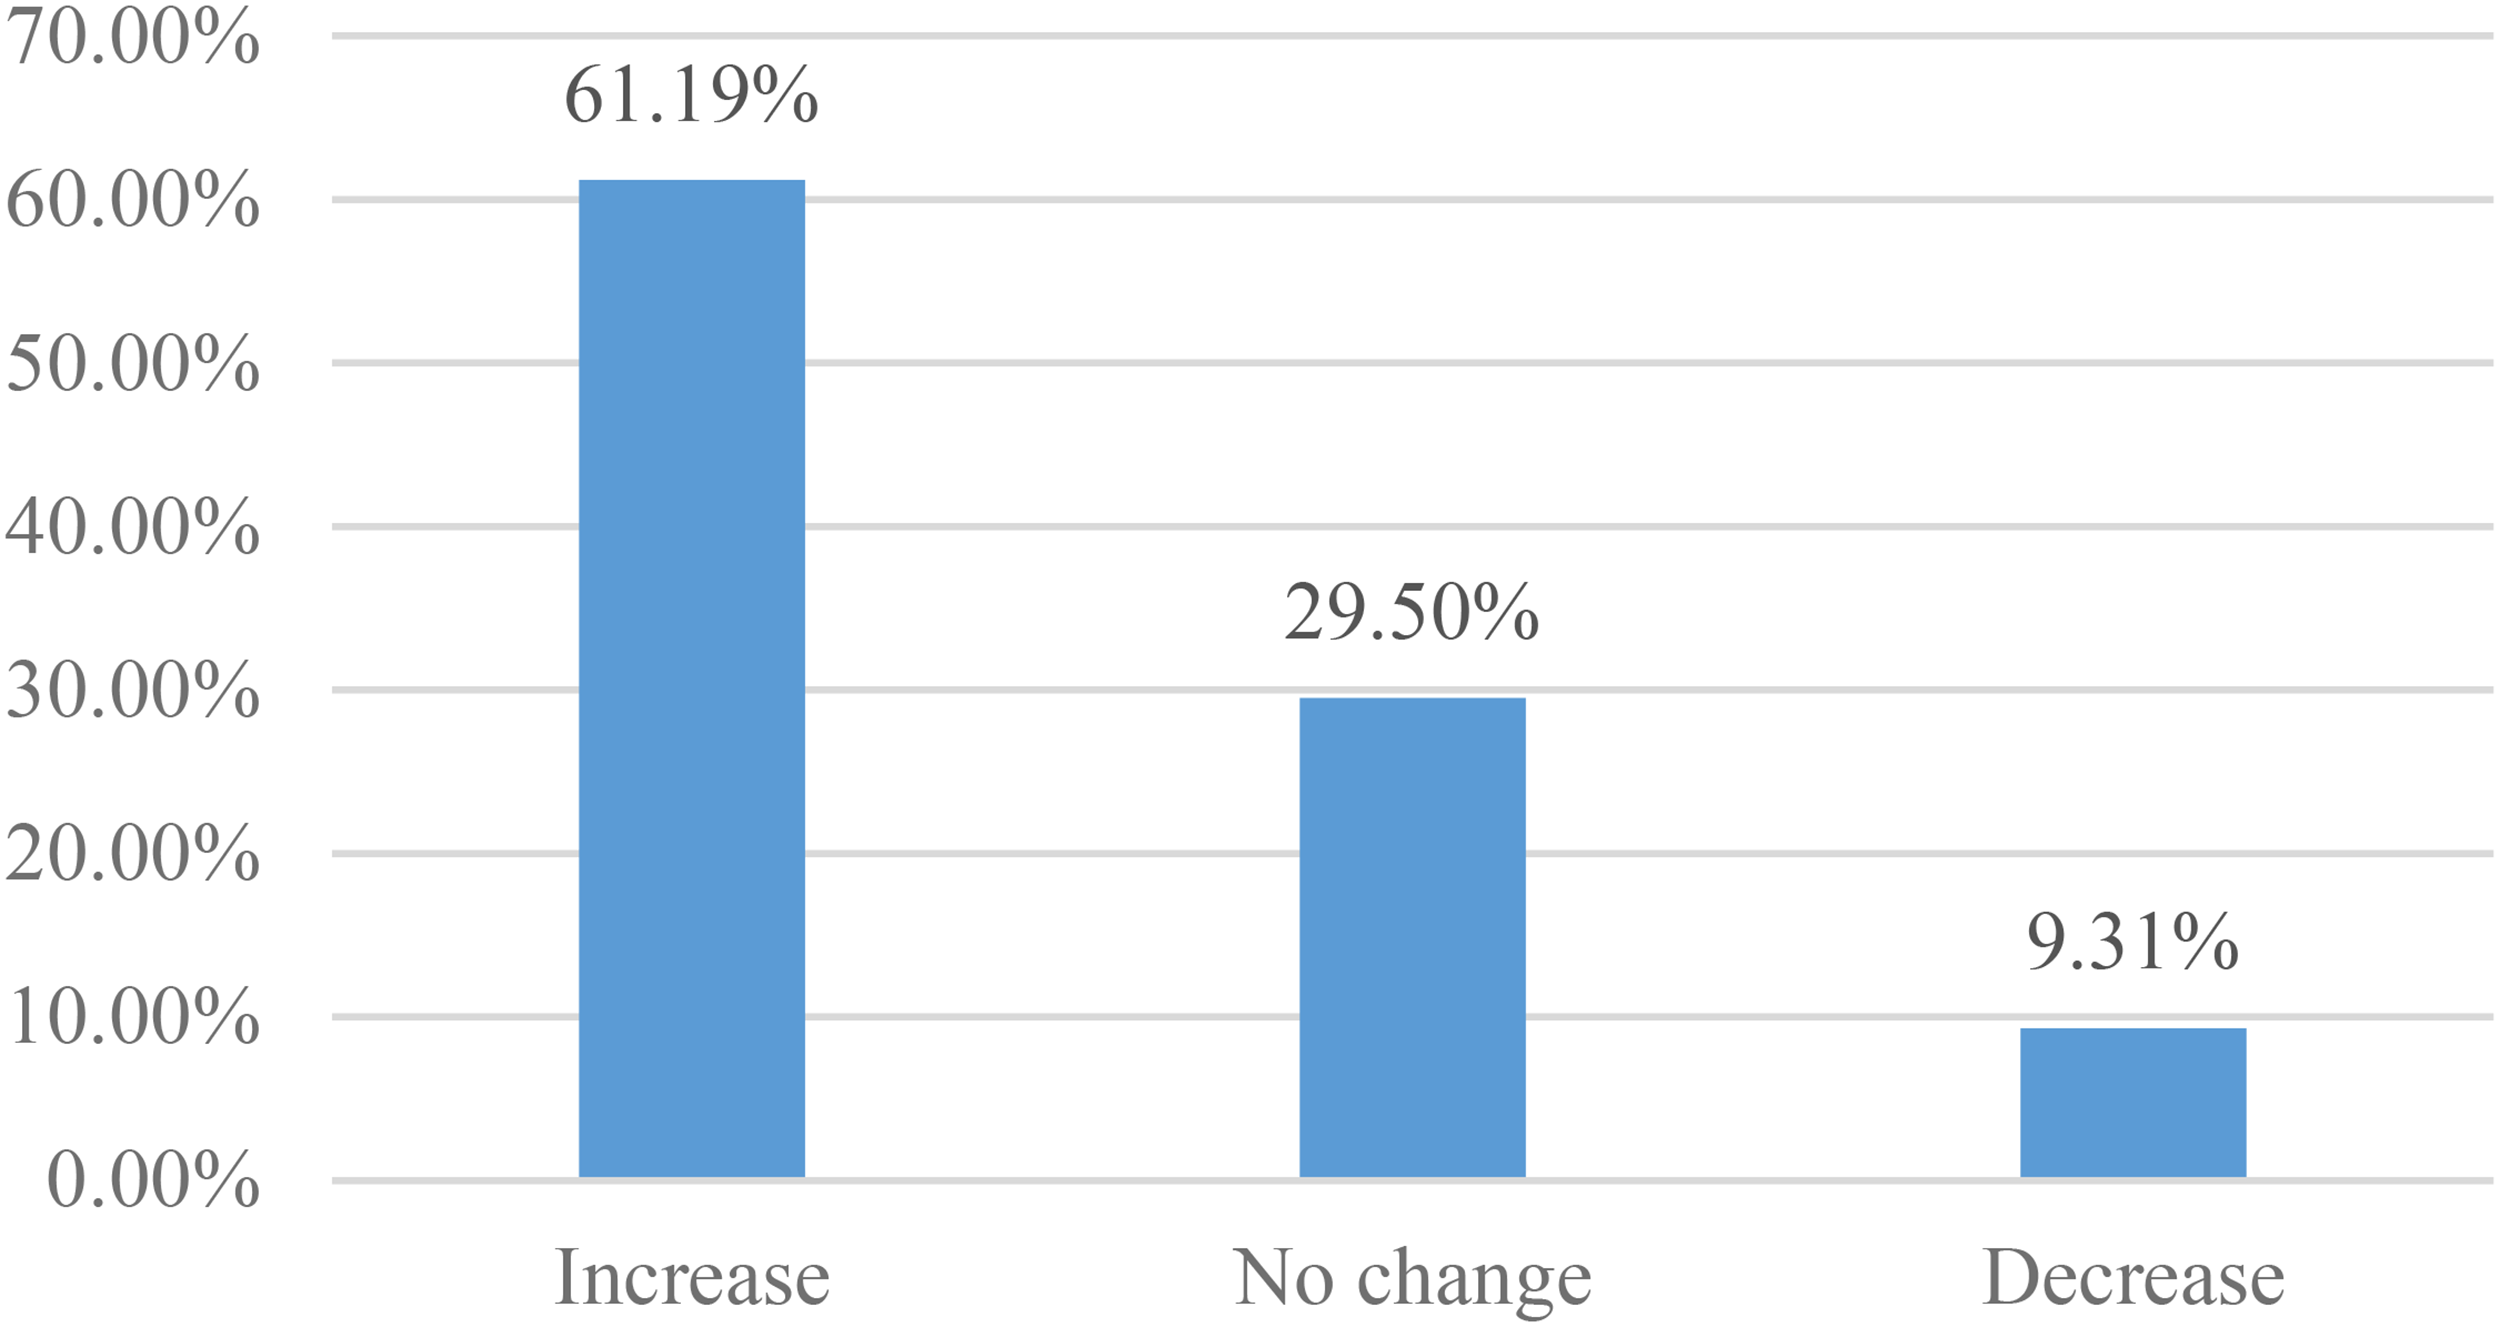
Work pressure on teachers during the pandemic.
Preparedness for the college entrance examination and further education options
Following China's pandemic response, the MOE announced that college entrance examinations would be delayed by one month. When the survey respondents were asked about their feelings toward this policy, 18.3% of students indicated their belief that it would have no impact, and 9.4% reported indifference to the delay. However, 54.2% of students responded that the postponement was insufficient and that they needed more time to prepare for the college entrance examination.
The pandemic has also negatively impacted senior high school students' expectations regarding college in several ways. First, before the pandemic, 2.99% students believed that they would not be able to attend university; this figure rose to 6.71% during the pandemic. Moreover, the proportion of students pursuing a place at a higher vocational college increased from 11.59% pre-pandemic to 15.37% during the pandemic. In contrast, the percentage of students pursuing a bachelor's degree or above declined from 85.42% pre-pandemic to 77.92% during the pandemic. Second, the pandemic has influenced students’ location considerations in the university selection context, with 25.7% of the students reporting that they are unlikely to choose a university in a location affected by the pandemic. Third, regarding choosing a major, 21.6% of students reported the intention to switch to a major with better employment prospects. Additionally, 40.7% of the surveyed high school students affected by the pandemic stated that they would consider applying to a medical program, indicating a potential increase in the number of medical students this year.
Of the surveyed teachers, 71.6% of the senior high school teachers believed that the delayed college entrance examination policy would positively affect students' level of preparedness. In this respect, 62.3% believed that postponing the college entrance examination by one month would mitigate the pandemic's impact to some extent, and 24.7% believed that the policy would largely mitigate the pandemic's impact, thus benefiting candidates. Regarding the pandemic's impact on student academic performance, 51.51% of the third-grade teachers predicted that the pandemic would negatively impact students’ college entrance examination results, with 62.3% believing that the exam scores would be significantly lower than the pre-pandemic figures.
Labor education
The survey results indicated that student participation in housework increased. More specifically, the proportion of students who participated in housework more than three days per week increased from 28.7% before the pandemic to 48% during the pandemic, and the proportion of students who engaged in more than 2 h of housework per week increased from 25.1% to 43.0%. These findings have indicated that traditional offline education may encroach on students’ time for housework. Moreover, among the students who participated in housework less than three days a week, only 32.7% believed that manual labor helps cultivate desirable personal habits—a markedly lower proportion than those who held the same belief among the students who participated in housework more than three days a week (47.4%). This has suggested that participation in housework facilitates the development of a positive attitude toward labor and good living habits.
Footnotes
Contributorship
Congbin Guo is the project leader, and he is responsible for the application, implementation, and completion of the project. In this article, Congbin Guo is responsible for research design and method verification. Zhuzhu Xu is responsible for questionnaire design and data statistics. Chenchen Fang is in charge of documentation and data visualization. Bo Qin is accountable for writing highlights, revising articles, and responding to editorial questions.
Declaration of conflicting interests
The authors declared no potential conflicts of interest with respect to the research, authorship, and/or publication of this article.
Ethical statement
This research was carried out during the pandemic, and it was difficult to carry out offline investigation. We used the online questionnaire survey to collect data. It was a large-scale national survey, including 33,194 high school students and 5,667 teachers. So, it is difficult to sign written informed consent forms with all participants. However, the survey questionnaire provided an ethical statement at the beginning, clearly stating that it does not involve personal information and that the collected data is only used for scientific research.
Funding
The authors received no financial support for the research, authorship, and/or publication of this article.