
Abstract
As part of a broader research program, we sought to conduct surveys with social media users in several African countries to gauge their definitional understandings of online hate and mis/disinformation; awareness of content moderation processes; and flagging/reporting. The challenge, however, was how to conduct survey research in difficult-to-reach places, some of which are affected by violent conflict, and within a limited budget. Social media platforms present unique opportunities for researchers to recruit participants in these contexts. These platforms show promise in reaching participants who would otherwise be unreachable, but they pose significant limitations as well. Given that our aim was to reach social media users, we used Facebook to advertise our survey, drawing on the breadth of research on using the platform as a research tool and the fact it has a large user base in the targeted countries. In this article, we explore the practicalities, challenges, and limitations of Facebook as a tool for survey research in African countries.
Keywords
Introduction
The turn against seeing social media as primarily a liberating or democratizing force has resulted in greater attention being paid to its role in inciting hate and exacerbating violent conflicts. Against this backdrop, our research set out to explore the reasons driving users to flag/report online hate and social media mis/disinformation in Africa—or, conversely, why they choose not to. The continent has the world’s lowest rates of user reporting, which—given social media platforms are how many people in Africa experience the internet (Essoungou, 2010)—has significant implications for identifying harmful speech and training algorithms to identify such comments, particularly in local languages (Fick and Dave, 2019). There are multiple possible explanations for this, including different understandings of what hate speech is or fear of surveillance (European Union Agency for Fundamental Rights, 2023). These user-centric explanations are compounded by deep inequalities in how social media platforms approach content moderation and services in Africa. Platforms often fail to translate their community guidelines into local languages, nor is it possible to directly report harmful content in most African languages (De Gregorio and Stremlau 2023; Fick and Dave, 2019). This limits the opportunities for users to understand moderation standards—that is, what to report—or how to report online hate speech by flagging content. We therefore sought to conduct surveys with social media users in several African countries to gauge their understanding of online hate and mis/disinformation; their awareness of content moderation processes and artificial intelligence (AI); and their engagement with flagging/reporting online content. The challenge, however, was how to do so in under-researched and difficult-to-reach places, some of which are affected by violent conflict, and within a limited budget.
Technology has shifted how we collect, analyze, and present data, including survey research (Zindel, 2023). Since the height of survey research in the 1990s, there has been a significant decline in both response rates 1 and quality (Wozney et al., 2019), with those responding thought to be “substantially different from those who do not,” limiting their representativeness (Schneider and Harknett, 2022: 109). Furthermore, surveys are becoming increasingly expensive to administer (Grow et al., 2022; Rosenzweig, 2020), while providing more limited and inaccessible data (Biemer and Lyberg, 2003), which is often provided later than required (Murphy et al., 2013). Such issues are amplified when it comes to surveying underrepresented groups, such as those from Black or minority ethnic communities, countries in the Global South, and rural areas (Rosenzweig, 2020; Wozney et al., 2019).
Our aim of including conflict-affected countries and difficult-to-reach regions in Africa meant we were quoted very high prices and/or lengthy timelines by survey companies that do offer some services on the continent. Most limiting, we were unable to find companies willing to conduct surveys in many of the countries we wanted to target (such companies often had a strong focus on the large economies of Kenya, South Africa, and Nigeria, with little capacity in between, particularly for more marginal markets such as South Sudan, Rwanda, or Ethiopia). This, coupled with concerns about the growing use of research panels, encouraged us to seek out more creative, experimental approaches.
Given our focus on social media users’ behavior, it made sense to explore these platforms as a tool for accessing users. After much deliberation, we determined that Facebook, 2 given the breadth of research on using it as a research tool and the fact it has the largest user base in the targeted countries (Neundorf and Öztürk, 2021), offered the most promising possibilities. Numerous researchers, mostly from the Global North, have turned to social media ads—specifically on Meta platforms 3 —as an effective, low-cost tool 4 for recruiting survey respondents (Stern et al., 2020). Meta’s advertising platform allows researchers to target specific ages, postal codes, gender identities, sexual preferences, education levels, and more (Wozney et al., 2019). Moreover, surveys can be administered in multiple languages in a time-effective way (Gregori and Baltar, 2013). 5
Despite the breadth of research using Facebook (and other social media platforms) for survey recruitment, significant knowledge gaps remain regarding how it performs and its limitations (Archer-Kuhn et al., 2022), particularly outside of North America and Europe. Scant guidelines exist on how to evaluate recruitment strategies and there is little consensus among previous studies on how best to conduct research (Archer-Kuhn et al., 2022: 799). 6 As Wozney et al. (2019: 5) argue, recruiting via social media is a “promising but imprecise science.” Importantly, we found only a limited number of studies recruiting from within Africa. Thus, despite going into our survey with a broad awareness of the limitations faced, we were unsure precisely how they might manifest in Africa.
What follows is an interrogation of how our data collection was influenced by using Facebook as a research tool. The first phase of our research focused on Ethiopia, Kenya, and South Africa, which were selected based on their differing structures of governance (from more autocratic to more democratic). We wanted to see how the contrasting regimes interacted with perceptions of hate speech and mis/disinformation, and how users perceived the government’s role in content moderation. Given there was some research on how Facebook ads had performed in Kenya (see Rosenzweig, 2020), we used the country as our pilot, before scaling up to Ethiopia and South Africa. In our second phase, we extended our survey to Ghana and Zimbabwe. 7 Combined, these countries largely mapped onto the countries within our broader study on social media and conflict in Africa. 8 Moreover, they were places where we could facilitate focus groups to contextualize survey responses. 9
As we aimed to explore the feasibility of using social media advertising to target hard-to-reach populations in African countries, we sought to trial Facebook’s operational efficacy in overcoming barriers in reaching under-researched populations, studying its potential and limitations in an African context. As opposed to conventional surveys where populations are targeted based on known criteria, conducting survey recruitment via social media involves relying on the largely unknown infrastructure of the social media company’s advertising algorithm to do so. Our approach did not aim to be representative, as was clear from the outset that this is nearly impossible to do with research using social media. Importantly, however, there was little discussion in existing research on how the ad infrastructure influences who responds to surveys. We know that using Facebook’s advertising algorithms as a recruitment strategy would influence our results—but we wanted to explore how it would do so. What biases does using Meta platforms as a recruitment strategy introduce? How are these amplified in African countries, where Meta platforms are already operating in problematic ways? 10 In what follows we outline the decisions we made in trailing this research method and how these influenced our outcomes. We highlight the ethical implications of this method and how the so-called “black box” problem of the AI systems governing ads 11 limits the potential of using Meta platforms as a tool for survey recruitment.
Phase 1: Piloting in Kenya and scaling up to Ethiopia and South Africa
The University of Glasgow recommends hosting social media ads for survey research on a university’s primary Facebook page (Neundorf and Öztürk, 2021). However, given the University of Oxford’s (hereafter, “Oxford”) Facebook page is centrally controlled, and the fact we needed to closely monitor and adapt our ad campaign, we chose instead to use a Facebook page managed by our own Oxford program. Bearing in mind previous research that indicates traffic results in the best response rates, we set up the ad as an auction 12 with the objective of driving traffic to a website—in our case a Qualtrics link (Neundorf and Öztürk, 2021; Schneider and Harknett, 2022). We set a spending cap of 300 GBP and a daily budget of 20 GBP, paying per link click to our survey, with a performance goal of maximizing the number of clicks (Neundorf and Öztürk, 2021; Schneider and Harknett, 2022). In terms of audience, the only parameter we input was location: Kenya. Otherwise, the default parameters were used: ages 18–65+ years and all demographics, interests, and behaviors. Based on this, Meta estimated our potential audience as 12,100,000–14,300,000, with a daily reach of 32,000–92,000 users, that they estimated would achieve 267–772 actual link clicks on our ad. The estimates for reach and link clicks vary based on budget, input criteria, and ad placements (Meta, 2024a). We used the suggested setting of Advantage+, which allocated our campaign budget across multiple placements based on where they were likely to perform best (Meta, 2024b). In total, we created 20 different ads to be used in all-but-one of the avenues it is possible to advertise on via Meta Ads manager. 13
Of these 20 ads, four ran with multiple variations in terms of text or picture location. While each ad was unique, we drew on a pool of key phrases (variations on “Complete this University of Oxford survey on social media for a chance to win 30,000 KSH”) 14 —and images: the Oxford logo; the Oxford logo with the Faculty of the Law logo; or the Oxford logo alongside the key phrase (see Figure 1). We selected which to use based on the ad’s presentation format—for example, the number of words visible on-screen or the size of photo that could be uploaded. Some ads were more effective than others, prompting us to update the images used and how the text was worded to better reflect the ad’s message.
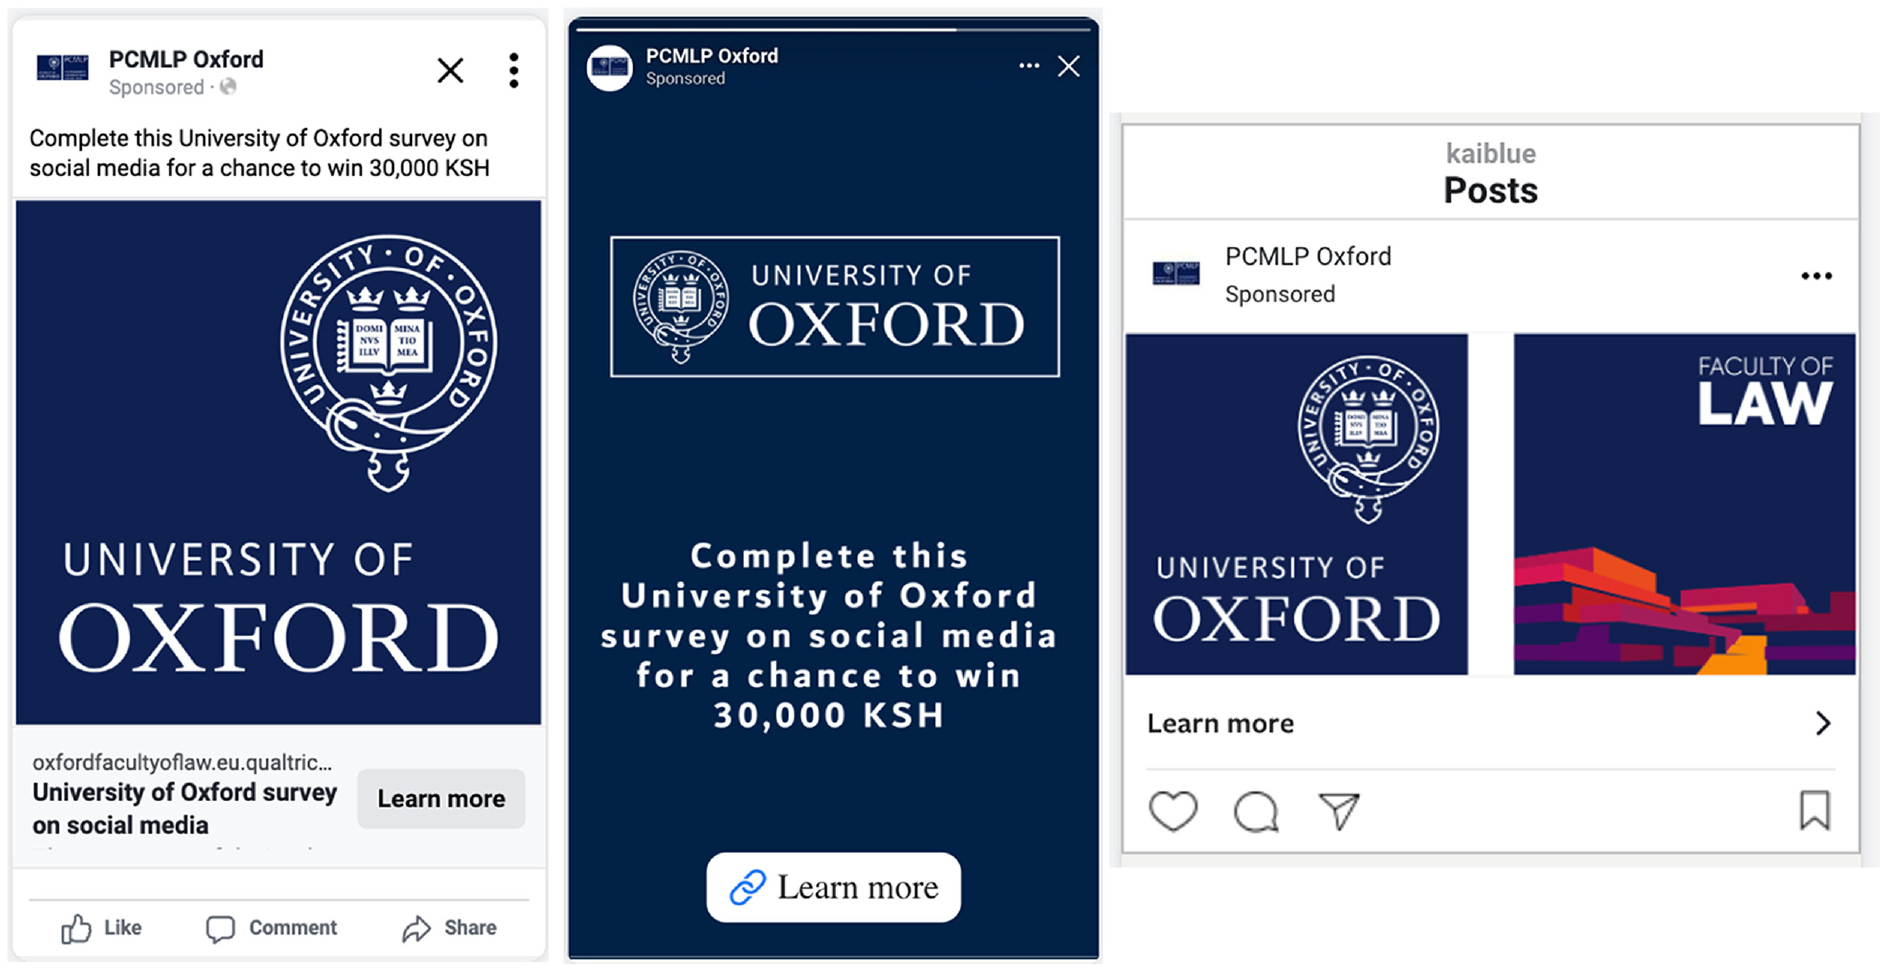
Ad in Facebook feeds, Facebook stories, and Instagram Profile feeds (right to left).
The ads ran for slightly less than 2 weeks, from 14 to 26 December 2022, during which time there were 1993 survey responses, costing a total of 239.35 GBP (0.12 GBP per respondent). Collectively, the ads reached 310,976 people in Kenya, 15 with the content displayed 756,655 times (impressions). This correlated to 7942 link clicks, at a cost of 0.03 GBP per click. Of those who clicked on the link, 3.98% completed the survey.
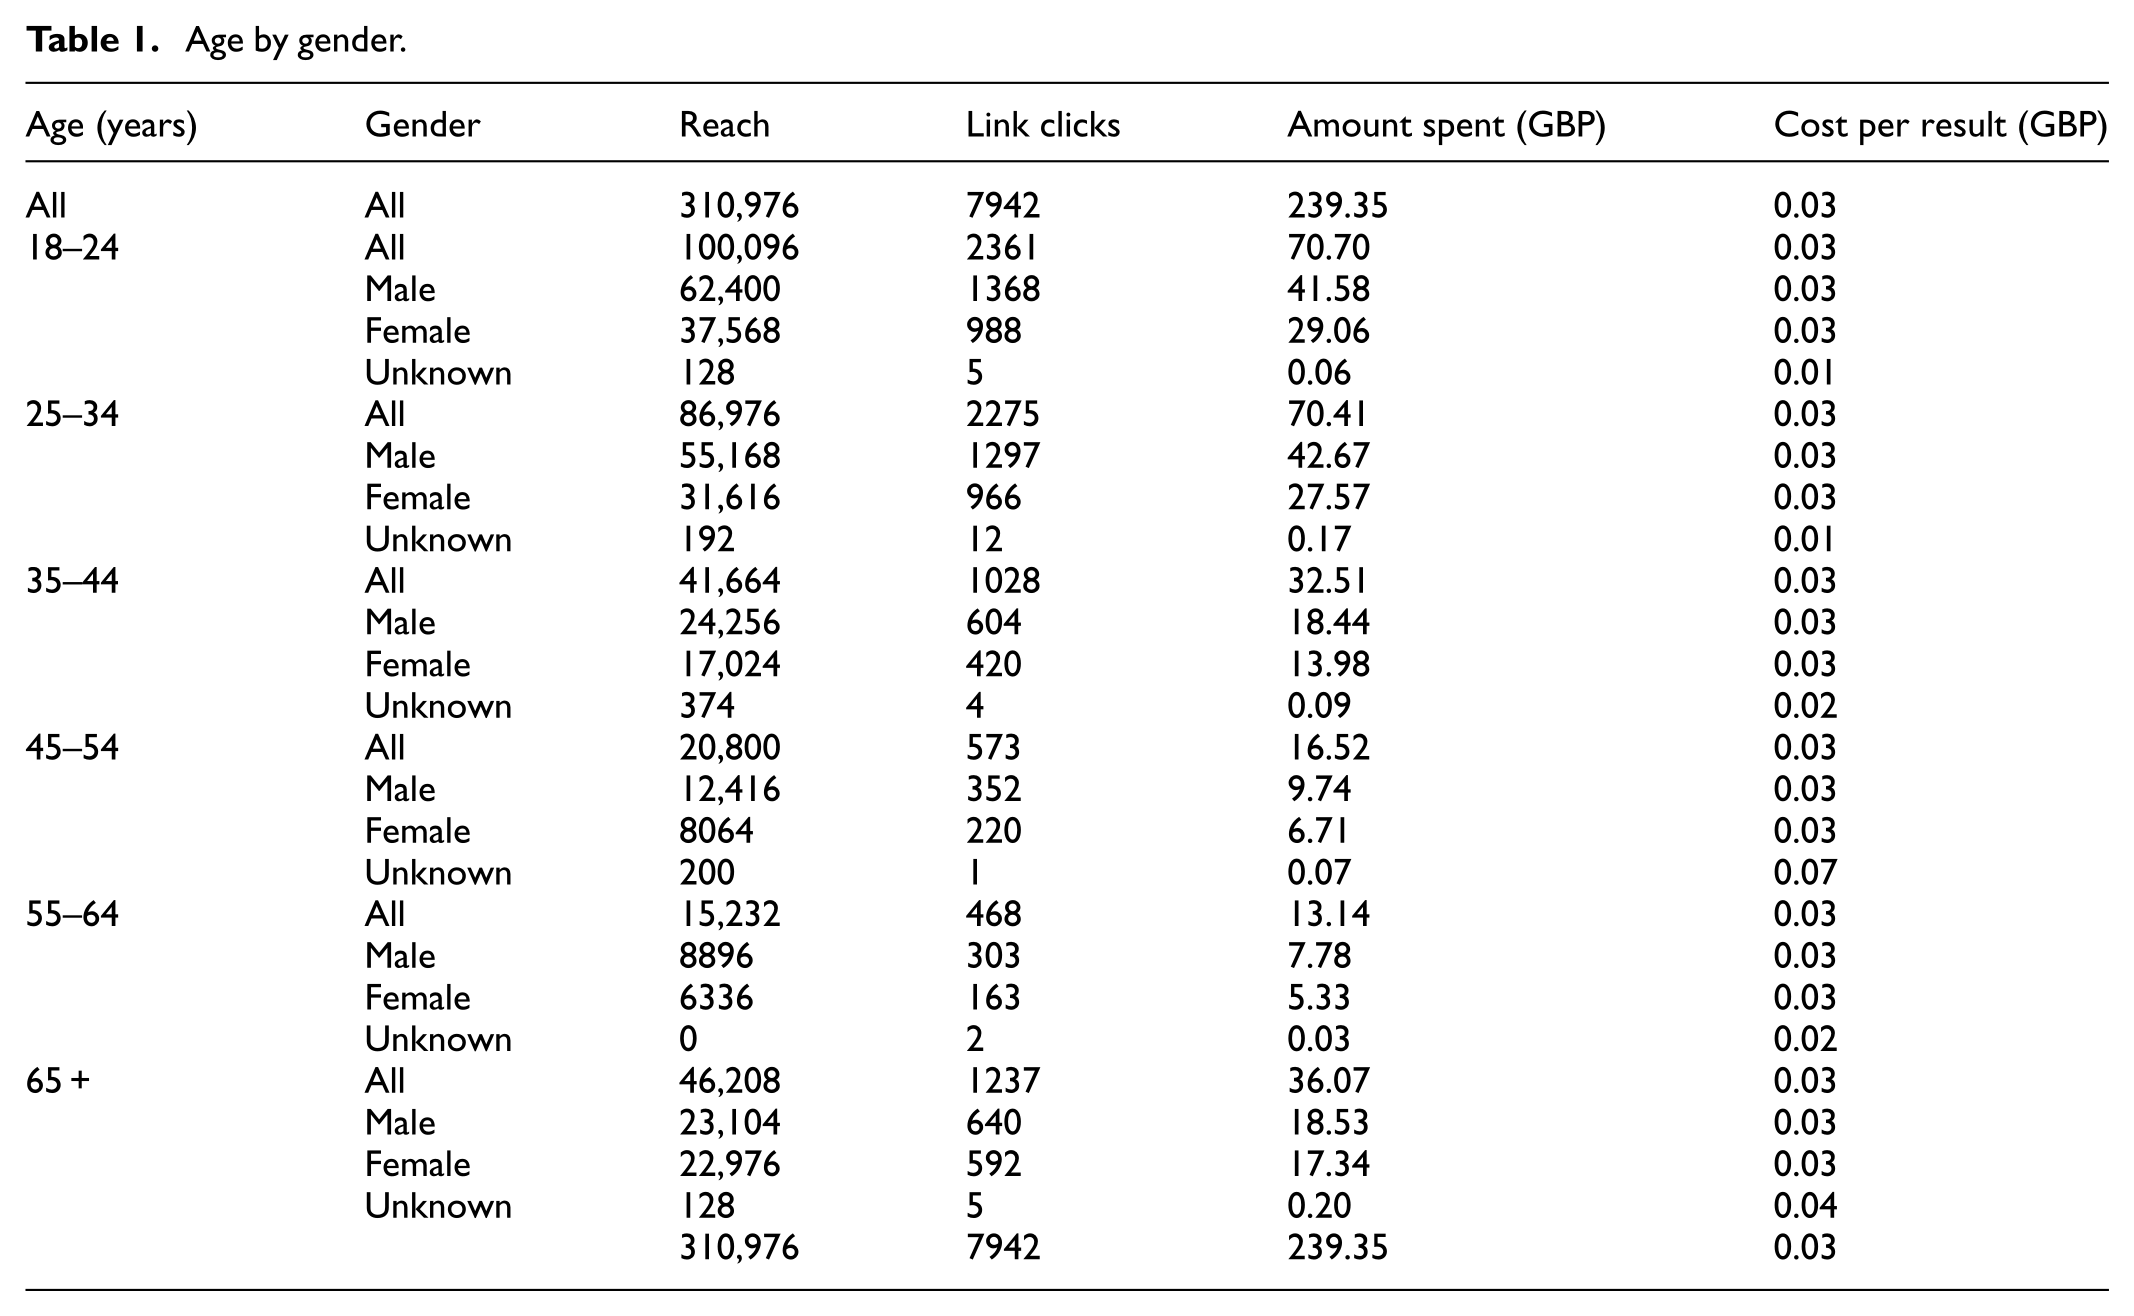
The ads reached more men (n = 186,240; 59.9%) than women (n = 123,584; 39.7%) 16 —something that held true, although to varying degrees, across all age groups (see Table 1). This breakdown corresponded in turn to more men clicking on the survey link (n = 4564; 57.4%) and completing the survey (n = 845; 62.3%). 17 In terms of age, over half the respondents were below the age of 34 (n = 187,072; 60.1%). This gender and age breakdown roughly accords with what we would expect based on who uses Facebook in Kenya (NapoleonCat, 2023a).
Age by gender.
The survey performed far better than we expected, both in terms of response rate and quality. We received numerous open-text responses, the quality of which was very high, with many participants providing comprehensive responses in paragraph form. One limitation that became apparent, however, was that the majority of respondents were from Nairobi. 18 Despite having attempted to target the entirety of Kenya, it appeared in practice we had reached the areas where the most active internet users resided.
Another limitation was that the majority of our respondents were highly educated. Of those who provided education-related demographic data (n = 1351; 67.7%), 76.5% had a college or university degree, while almost everyone (98.82%) had a high school education. These figures stand in contrast to national population statistics, which indicate 24.5% of the population has finished high school and just 3.5% have completed tertiary education (Statista, 2020).
Despite being aware we would not get a representative sample, we were nevertheless surprised by the disproportionate number of university graduates in our sample. Having spent months trying to engage with Meta to understand how its ad algorithms work, the best answer we could get came from the Ads Platform assistance team, who told us the algorithm used for the entirety of Africa is trained off a European dataset. While this is unsurprising given what we know about AI infrastructure and the under-representation of data and data programmers from African countries, 19 it is striking, and the algorithm’s biases presented limitations when it came to interpreting our results. For example, have we collected data from those with the most European-like spending patterns of those within Kenya, such as elites and high-income earners?
Focus group participants in Nairobi and Mombasa noted our ads were similar to others they were receiving: that is, education-related. Facebook tries to target those most likely to click on the ad. Thus, the marketable item was Oxford itself rather than the specific content of the ad. Additionally, the more an ad is clicked on, the more the algorithm learns about the type of person likely to click on it, which runs almost directly opposite to a desire that researchers often have to sample for diversity across a population. In fact, the ad learns the most during the first 50 clicks, after which the sample becomes more biased, reflecting those who initially clicked on it (Olamijuwon, 2021). Although respondents in Kenya were primed to engage with content from Oxford, this was not the case for the other countries we later ran ads in. Most notable for our study was how perceptions of Oxford’s involvement related to participants’ engagement with the ads.
The Oxford logo not only mediated who was targeted, but the degree of trust they had in the ad’s legitimacy. In the Kenyan focus groups, we repeatedly heard comments such as “it is Oxford so you assume it is real” or “I knew that it was ok to give out my demographic details at the end because I trust Oxford.” The sentiment that the ad had to be “real” because Oxford has the resources to “go after” anyone using its name in a scam repeatedly came up. 20 Ultimately, our conclusion was that this favorable perception of Oxford as an educational institution correlated with the high response rate. Across the eight countries we have run the survey in thus far, 21 Kenya still holds the highest response rate. One likely reason for this is the UK’s historical relationship with Kenya, particularly in education, although the perception of Oxford among other surveyed countries that had similarly experienced colonialist exploitation by the UK (e.g. South Africa, Zimbabwe, Ghana) varied.
Despite these limitations, the success of the Kenya survey (i.e. low cost, high response rate, high level of quality responses) prompted us to launch it—with modifications—in South Africa and Ethiopia through Meta’s ad infrastructure.
Extending to Ethiopia and South Africa
Our first modification in Ethiopia and South Africa was to add regional ad parameters in order to ensure better representation across the respective countries. As our ad platform was limited to a maximum of 40 GBP per day per ad, we decided to create entirely separate ads by region. In South Africa, we did this at the provincial level, while in Ethiopia we used the federal government’s regional breakdown: nine regional states and two administrative councils. The South African and Ethiopian versions of the survey also had two additional questions: What region do you live in? And: Would you define where you live as rural or urban? 22 Our aim was to better capture where respondents lived and understand if Facebook was still targeting those living in urban areas.
While there are important differences between regions, the overall ad metrics offer insights. Despite Ethiopia having fewer Facebook users than the other two countries surveyed up to this point (see Table 2), the ads there reached far more profiles than in South Africa or Kenya—indeed, they were seen by half of all Facebook users in Ethiopia.
Ad metrics for Phase 1 research countries.
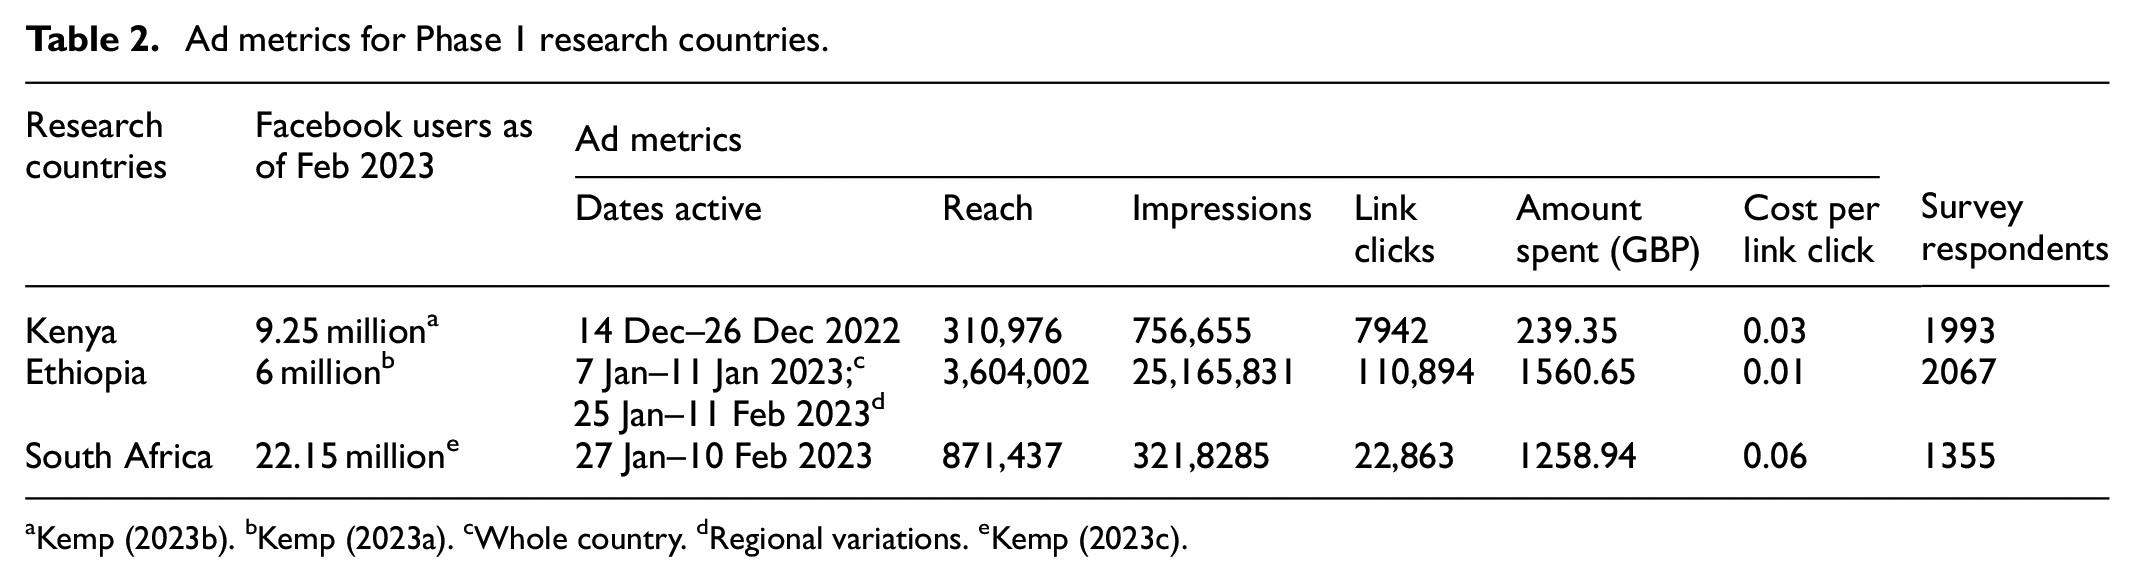
Kemp (2023b). bKemp (2023a). cWhole country. dRegional variations. eKemp (2023c).
This wider reach resulted in a higher number of link clicks to the Ethiopia survey, but did not cost significantly more than the other surveys. Ethiopia also had a higher overall budget—with 11 regional surveys each with a total cap of 140 GBP and 10 GBP per day, in contrast to South Africa’s nine regions. Thus, we would expect the South African survey to cost less simply because there were fewer unique ad campaigns.
However, we spent twice as much per link click in South Africa then we did in Kenya, and six times more than in Ethiopia. Moreover, the South Africa survey yielded fewer respondents (n = 1355). 23 Although, compared to the Kenya survey, it reached more potential respondents and prompted three times more link clicks, but only led to about two-thirds the number of responses. In other words, users were seeing the ads on their profiles and clicking on them at a similar rate to the Kenya survey, but were less likely to actually begin the survey on Qualtrics.
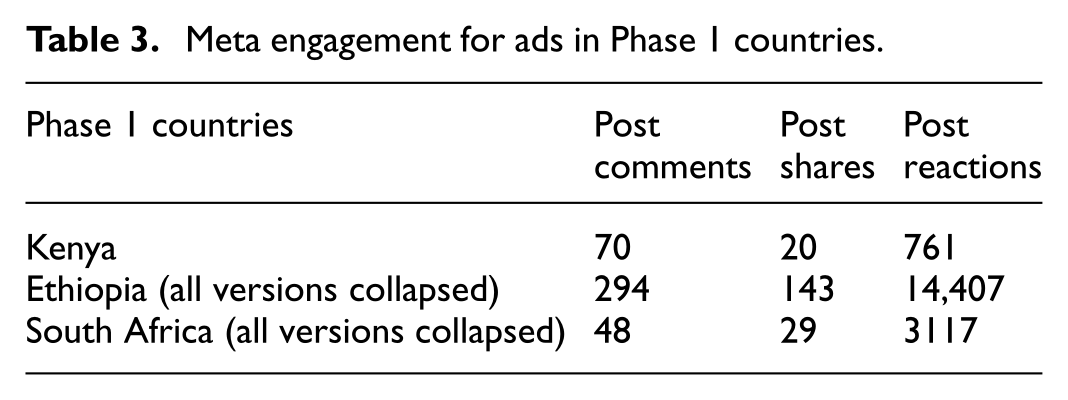
In exploring why this happened, we looked at the comments posted on the South African survey ads, which turned out to be more negative than on the other surveys (e.g. “this is a scam”; “this is fake”). We were hesitant to read too much into these, however, given there were significantly fewer comments on the South African ads than the Kenyan and Ethiopian ads (see Table 3).
Meta engagement for ads in Phase 1 countries.
The focus groups helped us contextualize the lower response rate and higher associated costs in South Africa. Most respondents told us that around 70% of their social media feeds were ads, causing them to scroll through without engaging with the content. They were also highly suspicious of ads, believing most to be scams. Interestingly, in contrast to Ethiopia and Kenya, the Oxford logo provoked suspicion regarding the ad’s legitimacy, with participants saying they did not understand why Oxford would be advertising on the topic or why it would care about hate speech and mis/disinformation in South Africa. Participants also noted that it would be easy for a scammer to use the Oxford logo given it is readily available for download and that the logo of a local university would have inspired greater trust. Despite this, the focus group participants present had proceeded to click on it. When asked why they did so, they referred to the prize draw and the fact they only had to provide their name and email address to be considered. Specifically, given we did not ask them for bank details, they felt they had “nothing to lose.”
Suspicions came into play again when we invited the South African survey respondents to participate in focus groups in Johannesburg and Cape Town, 24 with a 20 GBP (equivalent) stipend offered in return for their time. 25 Johannesburg participants described being cautious about coming to the focus groups and called us multiple times to confirm our identity. Many showed up with a friend or family member “just in case.” Skepticism also made it difficult to give out the cash prize from the random draw. To deliver the prize, winners had to fill out a university form with their bank details and other personal details, including their address and phone numbers. Despite repeated attempts, it took nearly eight months of going down a randomly generated list to get someone to claim the prize. 26
Upon further prompting, many Johannesburg focus group participants indicated they often receive ads for surveys promising payment or paid opportunities: jobs, forex-related, get-rich-quick, etc. In their words, our ad fit within that framework. Thus, rather than fitting into a larger ad schema related to education, the ad appears to have been distributed to people more likely to click on financial opportunity ads. This roughly correlated to the type of participant in the Johannesburg focus groups. The Johannesburg focus group participants described being unemployed, with few having gone on to higher education. In Cape Town, by contrast, almost all participants had an undergraduate degree (many even had a Masters degree), and the participants described the ad in the context of an education-related ad theme. 27
A more complex picture emerged in Ethiopia, partly due to the survey topic’s stronger cultural traction in light of the civil conflict afflicting the country. Numerous focus groups participants 28 spoke of being directly impacted by violence provoked by online hate speech or mis/disinformation—often a loved one being killed or injured. As such, they said they had engaged with the survey due to the topic. Interestingly, very few realized there was a cash prize associated with the survey. Moreover, while in South Africa we would invite about 15 people to focus groups and only five to seven would show up (in one instance, only a single person came), in Addis, all invitees would show up, with none mentioning that they thought the focus group might be a scam. 29
Despite the survey’s limitations, which became clearer as time went on, we were encouraged by the fact social media had allowed us to access difficult-to-reach populations and that responses in all three countries had yielded a high level of detail.
Phase 2: (Attempting) roll out in Ghana and Zimbabwe
Phase 2 of our data collection sought to expand our research to regions already subject to ongoing fieldwork in our program on social media, conflict, and development, thereby allowing us to test the limits of Facebook as a research tool. Ghana was the next country selected, based on the prevalence of English, the high percentage of Facebook users, and the in-country fieldwork our team was already engaged in.
We adopted a similar approach to previous surveys, setting up 10 region-based campaigns 30 and 20 different ads. On the day it was set to launch (17 April 2023), we noticed one version had failed to process, 31 having come back with a flag indicating the survey violated Facebook policies. We assumed this was an error given our record of running the survey elsewhere without issues. We therefore made a surface-level change—moved the position of a period—and relaunched it. The ad was processed, and the various ads ran for several days before all were flagged. We were able to relaunch them the next day without any changes, but approximately 24 hours later our entire Facebook profile was disabled and all the ads shut down (see Figure 2).
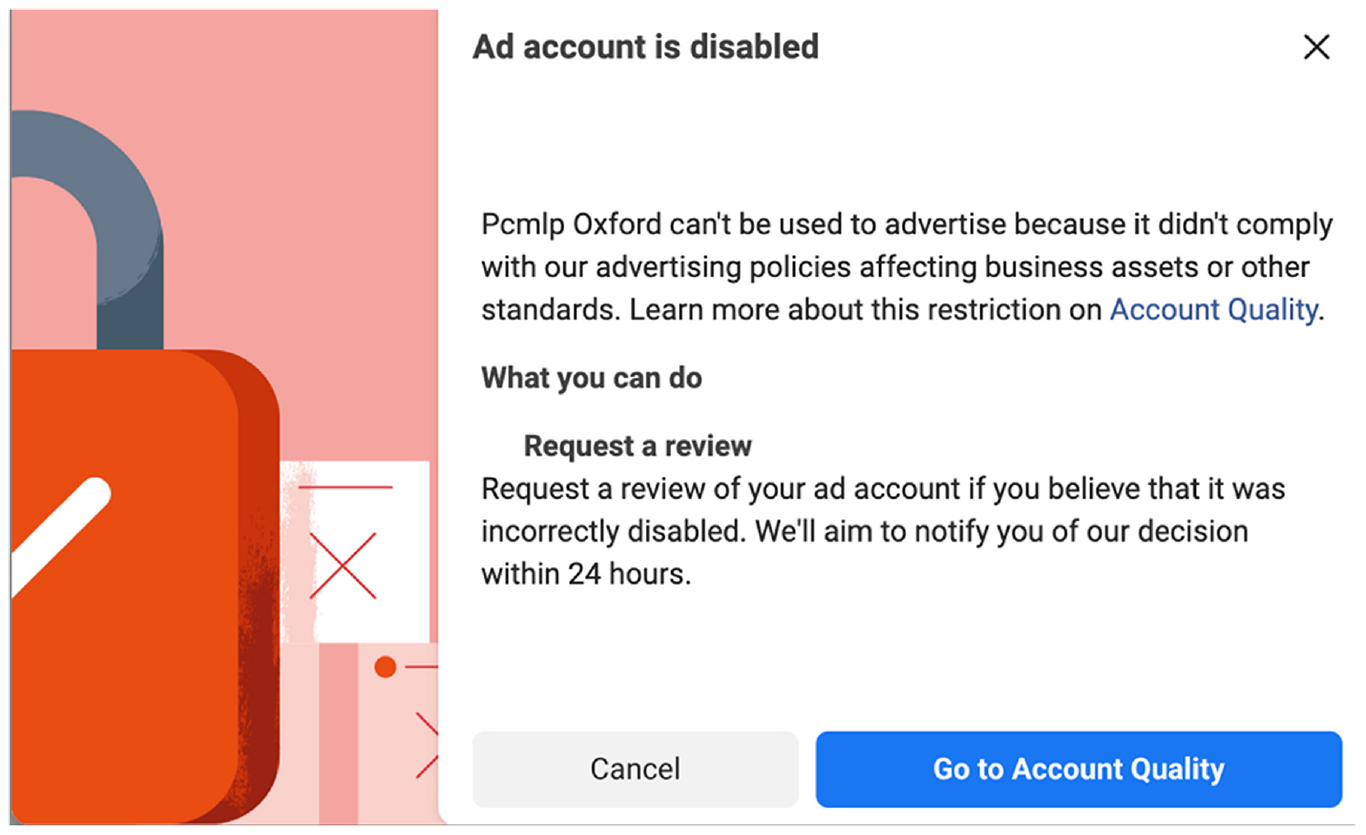
Ad disabled memo.
We immediately requested a review of the decision through a series of click-throughs, although this provided no means of explaining why we had made the request. Our request was rejected 24 hours later, leading to a “final decision” that our ad account was to be permanently disabled with no right of appeal (see Figure 3).
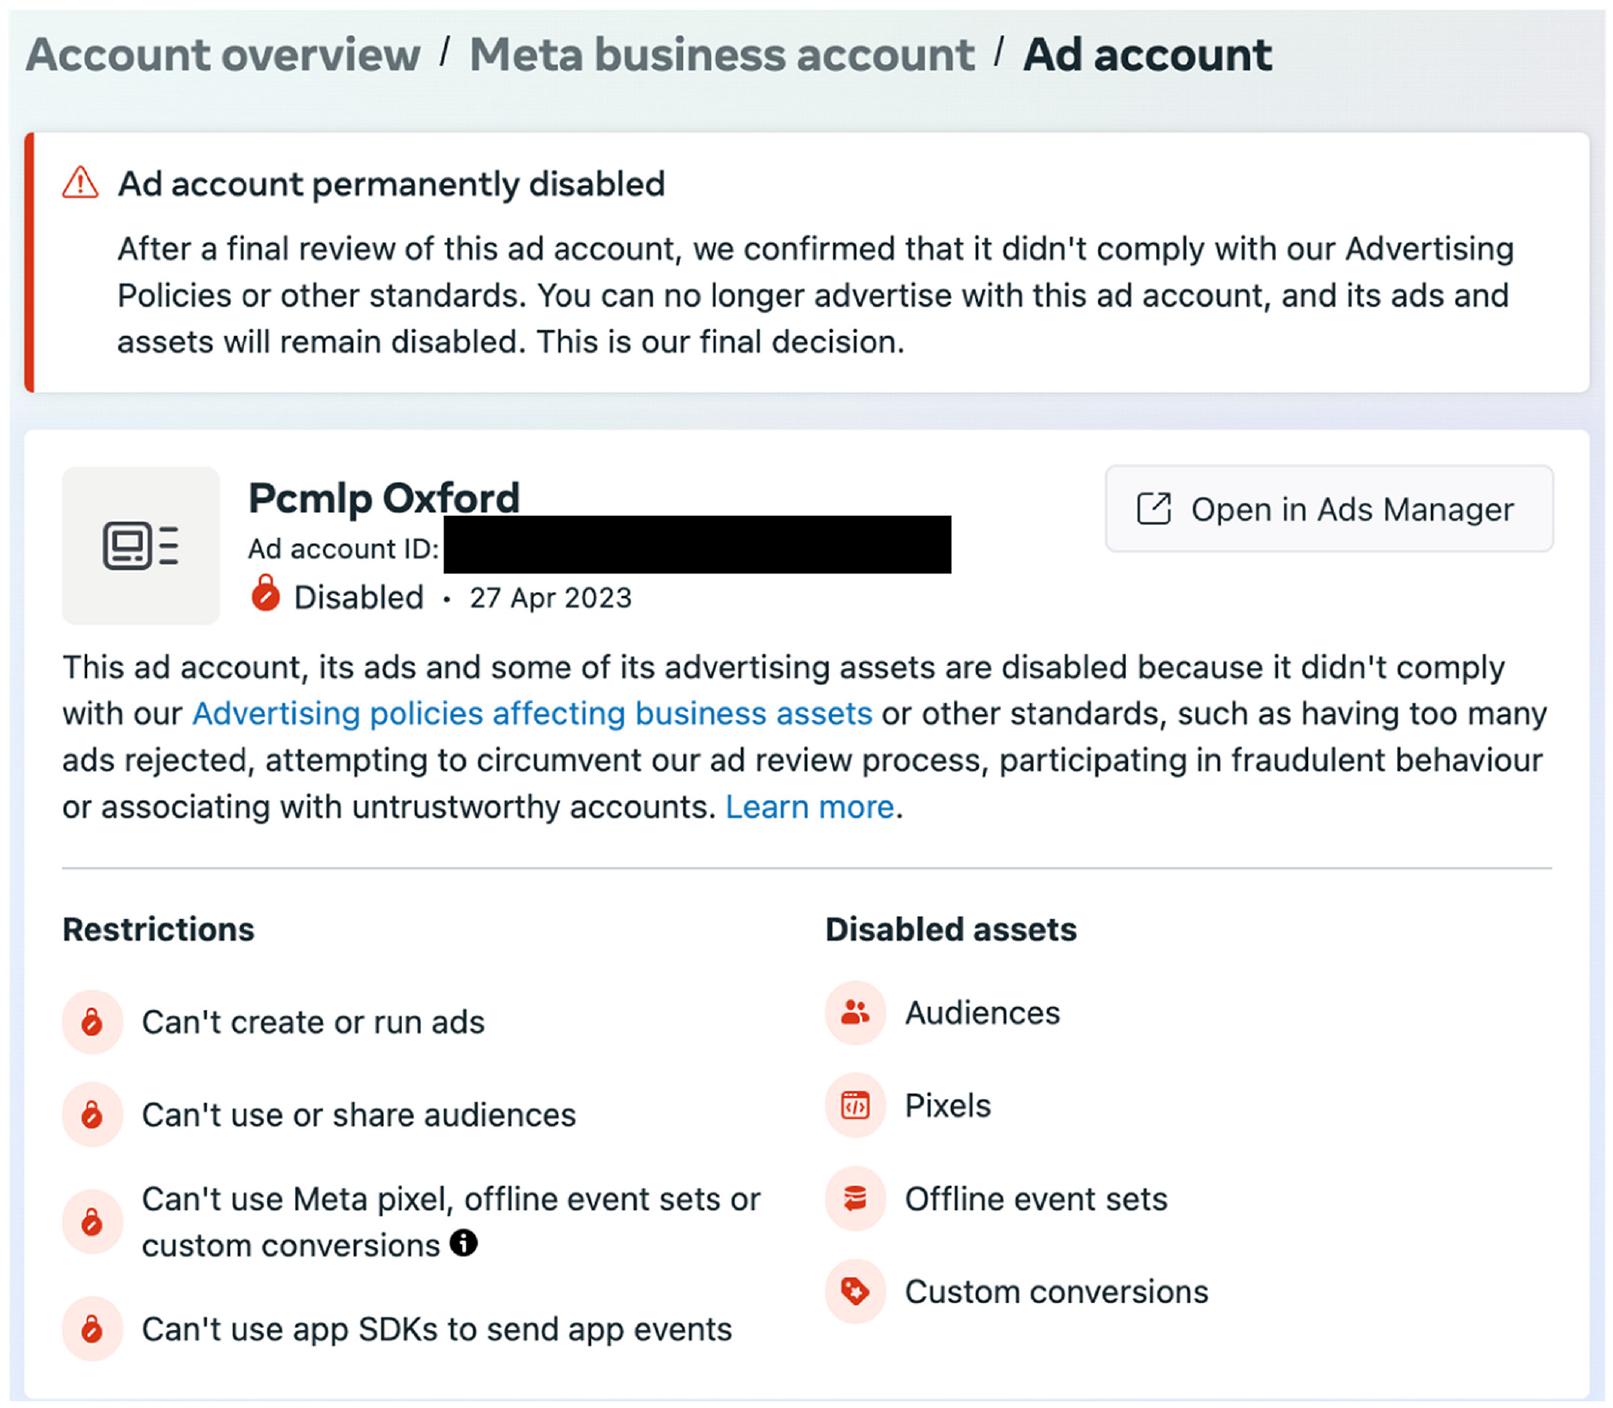
The final decision memo.
Facebook only informs you that you have violated its policies, not which one. Upon trying to figure the latter out, the only thing we could ascertain was that the reasons were “not political” (see Figure 4).
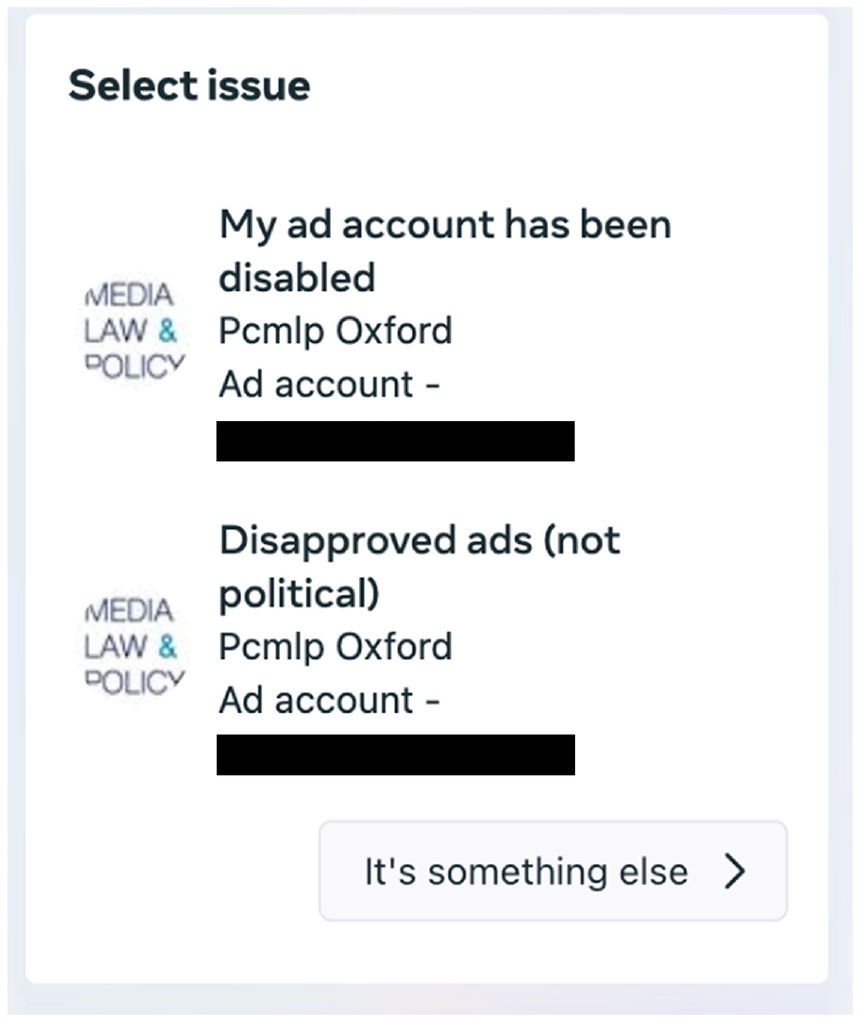
Not political.
We immediately called our Meta advertising contact, 32 who told us they would escalate the matter and bring the ad account back online within a week. Nevertheless, our account was disabled on 27 April 2023 and remains so today (January 2024). Despite numerous discussions with employees at multiple levels and repeated assurances they could not see why the ads violated any policies, our account was never reinstated. The most likely explanation for the issue came from an ad specialist, who told us there had been an update to the ad infrastructure shortly before we ran the Ghanaian ad, and that it had “messed” with some of the ads. He said he was “seeing this kind of issue now” and suggested we start over with a new Facebook profile and page. We were reluctant to do so without knowing exactly what led our ads to be flagged, in case it happened again.
Nevertheless, having exhausted all options to recover our ad account, 33 we decided to create a new profile and ad page. In particular, we wanted to understand whether it was an issue unique to our ad in Ghana that had led to our profile being shut down, or something else, such as the ad infrastructure update. We therefore copied the ads we had previously used in Kenya, Ethiopia, and South Africa to the new profile’s Ads Manager. This time, however, we were only able to process 17 (of 19) 34 versions of the ad for launch (rather than 20 of 21), supporting the hypothesis that there had been an update to the system.
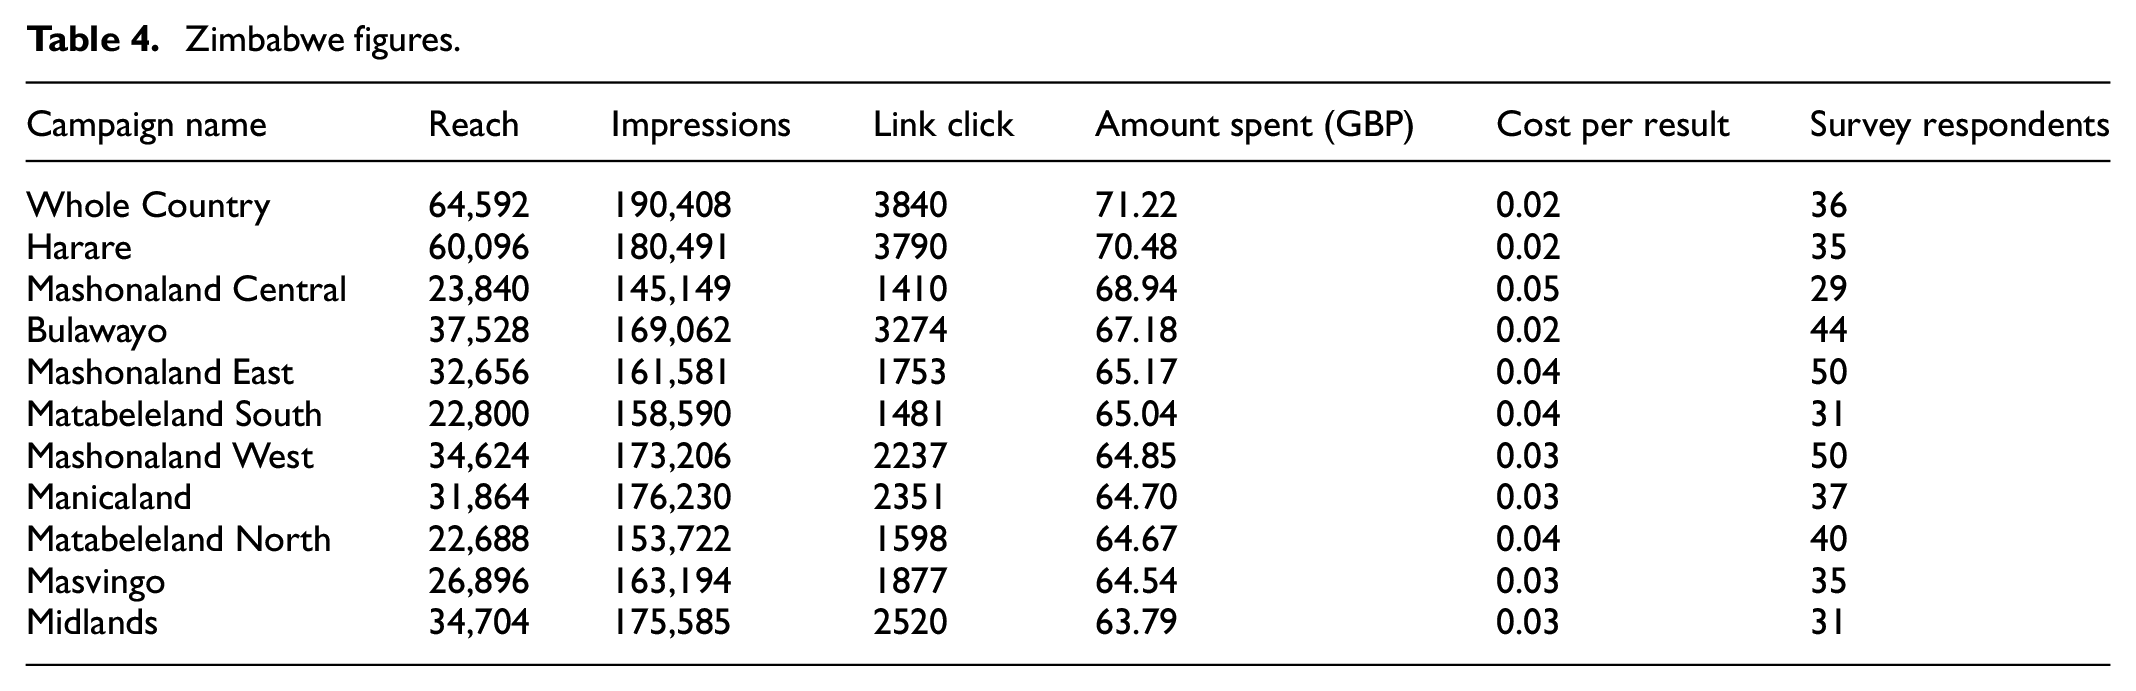
We launched the survey in Zimbabwe for an initial two-week period starting 12 July 2023. Alongside a national-level survey, we created individual versions of the ad for each of the country’s 10 provinces. 35 Both the regional-level surveys and the countrywide one were set to a maxium spend of 10 GBP per day and 140 GBP total. Contrary to our previous experience, the survey garnered a minimal number of responses, including days when we received no new responses at all. Across all 11 variations, we received 418 responses over the two-week period, with one potential factor being the fact that Zimbabwe has a lower number of users on Facebook (1.8 million in July 2023) (NapoleonCat, 2023b). Initially, we thought our ad had been deprioritized. However, despite the Zimbabwe survey having less overall reach than previous surveys, the reach per Facebook user was in fact high. One possibility is that separate versions of the ad reached the same profiles. Moreover, although we received more link clicks for this survey than was the case for Kenya and South Africa, we paid more per click, implying Facebook had to work harder to get them. On top of this, the higher number of link clicks yielded fewer survey responses (see Table 4). Reflecting on this, we hypothesize that Facebook possesses less user data in Zimbabwe with which to target ads.
Zimbabwe figures.
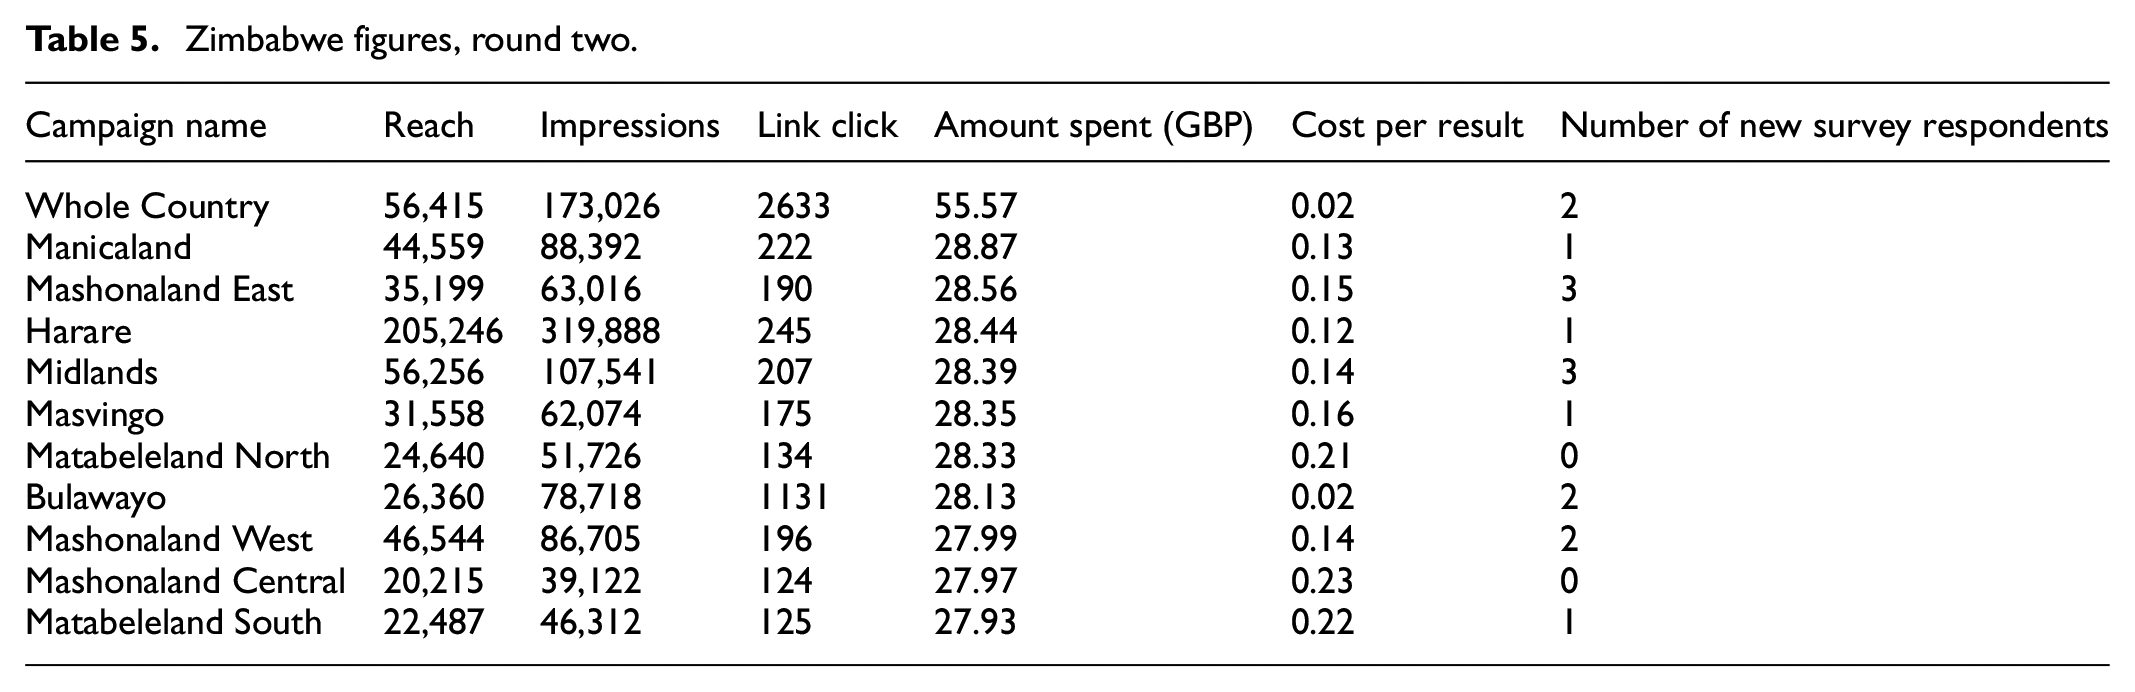
Overall, we spent 730.58 GBP on 418 respondents (1.75 GBP per response)—our most costly survey yet. We initially thought that, similar to South Africa, the online comments may be negative, prompting distrust in the ad. However, the 11 regional surveys received a collective total of just nine comments. Following the advice of Meta, we switched from focusing on link clinks towards attempting to “maximize daily unique reach.” Meta suggests this can work better in areas where the user profile is less clear, as it pushes your ad to as many profiles as possible. We therefore wanted to see if this resulted in any meaningful difference in response rate. The Zimbabwe survey campaigns were relaunched on 17 August 2023 and ran for two days before we shut them down. These two days cost 338.53 GBP, translating into the highest cost per link click yet and yielding just 16 new responses (21.16 GBP per response). In other words, although the ad reached people (see Table 5), it did not alter the trajectory of survey respondents.
Zimbabwe figures, round two.
We switched back to the goal of maximizing link clicks and once again relaunched the campaign, running it for a total of two further weeks. Although the final ads campaign was a success, more than doubling our response rate to 1131, we would need to conduct focus groups to assess exactly what happened. Did the ads need more time to “teach” themselves who was more likely to respond to the survey in Zimbabwe? If so, what does this tell us about the profile of Facebook users in Zimbabwe?
The fact we were successfully able to run the Zimbabwe ads suggested it was not the content of our ads in Ghana that had been flagged. We therefore re-launched the Ghana survey, which this time was allowed to run for the full two weeks. However, despite Ghana having significantly more Facebook users (NapoleonCat, 2023c), the ad campaign only managed to recruit participants at a similar rate (n = 1055) to the Zimbabwe campaign.
Discussion
While using Facebook to reach hard-to-access populations in Africa offers opportunities, and, in many cases may be the least-bad option, it poses significant limitations. Fully assessing the extent and impact of these limitations is difficult due to the so-called “black box” problem of the AI systems governing ads and the lack of transparency about how they work (Grow et al., 2022; Kalimeri et al., 2020; Zindel, 2023). As Rosenzweig (2020: 4) explains regarding a study using ads for surveys in Mexico and Kenya, “the internal workings of Facebook’s algorithm are opaque and may make targeting decisions using variables that we did not include.” Relying on Meta’s infrastructure to administer ads means we lose control over many aspects of data collection. In Ethiopia, for example, although people accessing Facebook at the time of our survey had to use a VPN, Facebook was able target them quite accurately. Their IP addresses—when collected by Qualtrics via Facebook—still recorded them as in Ethiopia, despite the predominance of European and US IP locations. Not only is it unclear what data-points Facebook uses to determine location, ad algorithms can be updated (Cahill et al., 2019) and ad platform features are often changed or disabled (Jan and Dwoskin, 2019; Pötzschke, 2021). Overall, ad policies and practices are “ever-changing” (Pekarsky et al., 2022; 9).
Our focus groups provided important insights into what set our survey respondents apart from their peers in-country. Through this, we were able to glean a number of basic limitations that affected the demographics. First, we only ran ads in English, which excluded a significant number of people who speak other languages. Moreover, given the specialization of many of the terms involved (e.g. “misinformation”), 36 the survey relied on a high degree of literacy. In countries where general literacy rates are low, let alone for English (e.g. Ethiopia), this limited who could take up our survey. Second, doing the survey required mobile data and/or an internet connection. Thus, many people would likely have been disincentivized from doing the survey due to data costs (Rosenzweig, 2020). Relatedly, we could only reach areas where internet or mobile networks were available and sufficiently strong during the periods we ran the surveys. Many of the surveyed regions, however, suffer from rolling blackouts, power outages, and, in the case of Ethiopia, internet shutdowns. In addition, there are micro-level factors—such as the time of day the ad was delivered—which may have influenced who saw or responded to the ads (Stern et al., 2020). Was it always delivered at the same time of day? If this was during working hours, did it affect who responded to the survey? Ford et al. (2019) detail how factors like holidays and the weather can also influence who is on social media when ads are running.
Some studies have uncovered inconsistencies within the demographics reported by Facebook, with Rosenzweig (2020) finding that only 30% of survey self-reports matched what Facebook reported as being the respondent’s education level. There is also evidence of Facebook disproportionately targeting certain demographics. Zindel (2023) and Olamijuwon (2021) point to an age bias, with younger people over-represented. Wozney et al. (2019), meanwhile, find that women are more likely to be recruited by ads in the Global North. Shaver et al. (2019), too, find women to be over-represented in their study. On the other hand, systematic reviews by Thomson and Ito (2014) and Zindel (2023) find it is men who are over-represented, possibly due to women being less represented in the Facebook user population. There have also been suggestions that ads target different race/ethnicities. 37 In South Africa, Duffett (2015) found that ads were most effective in leading to clicks by the Black population. In Canada, by contrast, Pekarsky et al. (2022) found their ads resulted in a sample that was almost exclusively white.
Beyond the lack of clarity on how Facebook targets ads, there needs to be clearer protocols on how to run Facebook ads for social science survey recruitment. Rosenzweig (2020), for instance, finds attention checks during a survey are particularly important in low-income contexts when remuneration is offered, 38 as otherwise people may blindly click through the survey in order to claim the reward. In our case, we did incorporate a cash prize draw. Numerous researchers have found that draws involving cash prizes increase response rates (Ichimiya et al., 2023; Kapp et al., 2013; Thomson and Ito, 2014). In attempting to determine the ideal cash prize amount, Thomson and Ito (2014) found that it varies by country according to GDP. 39 To achieve a 13% response rate in Bangladesh, for example, the prize would need to be 50 USD, whereas in the United States the prize would need to be 385 USD (Thomson and Ito, 2014: 209). Given our prize value was relatively high in relation to the GDP of the surveyed countries, this likely influenced our response rate.
There are also questions around best practice for engaging with ads while they are running. We did not proactively promote the ads on our Facebook page, nor did we police comments—essentially, we let the ads run and observed what happened. Others, such as Bennetts et al. (2019) and Green et al. (2021), find that engaging with the Facebook page (e.g. reposting the ads; removing negative comments) can increase response rates. This area warrants future exploration. Relatedly, Stern et al. (2020) find that video ads are more effective when it comes to recruiting, in particular, young respondents—we used only photos, partly because videos consume more data, which is expensive for many in Africa. Many previous studies (e.g. Marino et al., 2022; Rosenzweig, 2020) also recommended using pixel conversions to track completed surveys. This involves setting up a “Thank You” website participants are directed to once they click on the survey’s “done” button (or equivalent). This enables those running the survey to pay according to the number of respondents who land on the Thank You page—that is those who completed the survey—rather than the number of people who clicked on the link to the survey (as we did). It is possible our response rate and payment data would have looked different had we chosen to do the former.
Another challenge thrown up by surveys conducted via Facebook is that it is difficult to control for duplicate survey-takers (Rosenzweig, 2020). While we did track IP addresses, it is difficult to tell if it was the same person completing the survey multiple times or several different people in same household each doing it once. There appeared to be few, if any, duplicates in the data, although we cannot be certain.
Online survey research also raises broader ethical quandaries, potentially opening the door to a new type of helicopter research focused on extracting data for Global North institutions and agendas (Horn et al., 2023). In the case of our research, we consulted local academic partners on the drafting of survey questions in many of the countries and conducted focus groups to contextualize our responses. Nevertheless, the risks of Global North researchers harvesting data from Global South countries without considering the local context poses concerns. Another ethical question concerns the collecting of IP addresses. Specifically, what are the implications of having access to such geo-coded data in areas like Tigray, Ethiopia, where discussing hate speech is extremely sensitive? How do we ensure the wrong people do not leverage the Facebook ad infrastructure? Ultimately, as Ford et al. (2019) and Rosenzweig (2020) point out, ethical review boards tend to have little understanding of how social media functions, meaning there are few checks and balances.
Conclusion
Despite the limitations discussed above, we found Facebook to be a useful, relevant tool for survey research in difficult-to-reach places. It is, however, important to engage with biases in the system and recognize that algorithms and advertising parameters may shift without any explanation being given. There is little transparency surrounding how social media platforms operate generally, let alone how their monetization mechanisms work.
We therefore urge researchers to consider surveys as just one part of wider in-country research programs. Focus groups were instrumental in adding context not only to our survey response content, but the pathways through which participants engaged in the research, shedding light on who is and is not represented in the research. Given this, we propose that best practice is to conduct focus groups in multiple areas of a research country, as we found differences in participant demographics based on focus group location.
Researchers in the Global North must also be careful to not reinforce practices of helicopter research whereby researchers in the Global North “pop in” and harvest data from the Global South. Methodological approaches rooted in Global North knowledge centers are often applied uncritically or, at best, innovatively tailored to fit local realities. Research in the US has revealed how methods driven by what Zuberi and Bonilla-Silva (2008) refer to as “white logic” and “white methods” can reinforce discrimination or marginalization. Using sociological statistics as an example, the authors argue that many methods were developed to support eugenics. The legacy of these methods can be seen in the racialization of census and police data in many Global North countries, where the lived experiences of Black and minority ethnic groups are not captured as effectively as their white counterparts (Zuberi and Bonilla-Silva, 2008). Although the scholarship by academics at African universities on inequalities in methods has thus far been less robust, there is an urgent need for reflection. Given the rapidly increasing use of social media surveys among research practices, we risk a helicopter research crisis unless research inequalities are acknowledged and brought to the fore. In short, we need to understand who is represented in social media surveys before analyzing what the collected data reveals.
There are some quite profound challenges here in how we interpret data from surveys recruiting via social media. While it was never our aim, it is clear that cross-national comparisons cannot be undertaken using social media recruitment. There is potential to use individual country datasets in silos, but doing so requires contextualization with focus groups and, ideally, greater transparency on the part of Meta about how its ad infrastructure and algorithms work. It is crucial to understand this at a very local level not only nationally but regionally in each country. We were able to start gathering this information, but only by approaching our research as exploratory, enabling us to take a wide approach to data collection and refine as we went. Using the same parameters for inclusion across countries, results in significantly different sampled data. Of course, we expect this. Social media is not singular across Africa, despite that our initial conversations with Meta suggested that the advertising algorithm was singular across Africa. We would expect to see unique phenomena within countries reflected in social media practices in distinct ways. It is, however, difficult to assess what social media companies categorize as distinct populations within African countries, notwithstanding consideration for inequalities in access reflecting who is and who is not on social media to begin with.
Footnotes
Declaration of conflicting interests
The author(s) declared no potential conflicts of interest with respect to the research, authorship, and/or publication of this article.
Funding
The author(s) disclosed receipt of the following financial support for the research, authorship, and/or publication of this article: This research is part of the ConflictNet project (The Politics and Practice of Social Media in Conflict). It has been funded by the European Research Council (ERC) under the European Union’s Horizon 2020 research and innovation program (Grant Agreement No. 716686, ConflictNET).