
Abstract
Relational event models shift the analytical focus away from network ties defined in terms of transitions between mutually exclusive states of connectivity, to bonding processes emerging from observable flows linking senders and receivers of action. In this framework, the possibility to connect social mechanisms of theoretical interest to sequences of observed relational events depends on the relative speed at which these mechanisms operate. Building on established non-parametric methods in survival analysis, in this paper we introduce a new approach to the analysis of the internal time distribution of relational mechanisms of broad theoretical interest in research on the evolutionary dynamics of social and other kinds of networks. We propose general algorithms that may be adopted to study the time structure of theoretically relevant network mechanisms. We illustrate the practical value of our proposal in an analysis of a large sample of high-frequency financial transactions observed over a period of 11 years. We show how the internal time structure of the social mechanisms that control flows of market transactions is sensitive to institutional change in transaction regimes induced by successive financial crises. The results we report invite reflection on a new notion of network “structure” incorporating change as one of its constitutive elements. The study suggests a number of conjectures that provide broad conceptual bases for the development of testable hypotheses about the forces that shape the evolutionary dynamics of network structure.
Keywords
Because social mechanisms operate over time (Abbott, 2007; White, 1970), network dependencies that produce—and, simultaneously, are reproduced by, such mechanisms play a major role in the evolution of social systems (Abbott, 1997; Padgett and Powell, 2012). Conversation (Gibson, 2005), technology-mediated communication (Stivala et al., 2020), participation in on-line communities (Wellman, 2001), contribution to crowd-sourced production projects (Lerner and Lomi, 2020), interorganizational collaboration (Amati et al., 2019), and economic transactions (Williamson, 1979), represent only a small sample of empirical examples where network dependencies shape the evolutionary dynamics of social interaction.
In all these cases, understanding the dynamics of social behavior hinges on our ability to reconstruct accurately the time order of sequences of events connecting multiple social actors (Butts and Marcum, 2017; Gibson, 2000). Yet, network dependencies cannot be unambiguously identified when the time order of the underlying flow of relational events connecting senders and receivers of action is ignored (Perry and Wolfe, 2013). This is an issue of considerable generality because behavior becomes “social” as soon as an individual “emits a behavior directed at one or more entities in his or her environment” (Butts, 2008, p. 155).
Consider reciprocity, for example, perhaps the simplest form of dyadic dependence (Snijders et al., 2006)—and one of the most theoretically important (Fehr and Gächter, 1998) and empirically studied (Molm, 2010). For an event
Differences in the time to reciprocity across dyads generate a distribution of waiting times. Reciprocity is not just a network statistic, but rather the outcome of an underlying time-dependent process of reciprocation (Kitts et al., 2017). As an evolving social process, reciprocation (unobservable) generates time-dependent patterns of reciprocity (observable): at any one point in time, a dyad census will reflect the relative speed at which reciprocation operates (Faust, 2007). In other words, the dyad census will reflect reciprocity, but not necessarily reciprocation. A similar argument holds, and holds in fact even more strongly, for more complex forms of dependence involving more than two actors such as, for example, cyclic and transitive closure (Amati et al., 2019). It is likely that social actors will need some time to construct—and then recognize, and then test—the social structures implied by social mechanisms, a conjecture suggested by recent experimental studies conducted on human subjects (Zerubavel et al., 2018).
Implicit in this argument is the view that dependence structures do not just give rise to local configurations of network ties (Robins and Pattison, 2005). The general intuition that inspires this paper is that dependence structures induce—but at the same time are shaped by—time-dependent mechanisms regulated by their own internal clock. The general objective of this paper is to characterize these patterns of time dependence, and provide an empirical illustration of how this characterization may be practically useful in the analysis of relational data. More specifically, the main objectives of this study are to: (i) document variations in the internal time structure of network mechanisms associated to dependence structures of broad theoretical interest or contextual empirical relevance; (ii) implement context-independent algorithms that may be generally adopted to reconstruct the internal time structure of network mechanisms starting from sequences of observed relational events, and (iii) examine how network mechanisms typically considered in empirical studies as endogenous generators of network change, themselves change over time and across institutional contexts.
We pursue these interdependent objectives in the context of data that we have collected on interorganizational exchange and dependence relations coordinated through a market interface designed to connect sellers and buyers of liquidity (Lomi and Bianchi, 2022; Bianchi and Lomi, 2022; Bianchi et al., 2020). More specifically, we examine how repetition, reciprocation, generalized exchange, and transitivity mechanisms shape—and emerge from time-ordered sequences of high-frequency financial transactions.
The empirical setting we examine to seek support for our qualitative argument is commonly represented in network terms (Marti et al., 2021). Paradoxically, financial transactions are characteristically ill-suited to dynamic network modeling because of the difficulties inherent in the definition of meaningful states in data generated by high-frequency, second-by-second interactions among market agents (Zappa and Vu, 2021). Conventional network representations require time aggregation of events into ties (Bianchi et al., 2020; Finger and Lux, 2017). In this way, information on the internal time of network mechanisms is typically lost. In financial transactions, ignoring the timing of exchange events may be particularly problematic.
In this work we document the internal time structure of basic network mechanisms. For instance, we observe that the time to reciprocation in financial transactions may vary from few minutes to months. Relatedly, we examine how this internal time structure changes systematically between exchange regimes determined by various development stages that may be identified within the recent global financial crisis. We find that the internal time of network mechanisms not only varies considerably across mechanisms, but also that such time is affected systematically by exogenous institutional changes (Lomi and Bianchi, 2022). We conclude by discussing the empirical, methodological and theoretical implications of our study for future research on network evolution.
The temporality of network structure
The problem of understanding the structure of social interaction starting from the observation of individual events figures prominently in the agenda of contemporary research on social relations (Butts, 2008, 2009; Butts and Marcum, 2017; Golder and Macy, 2011; Golder et al., 2007; Perry and Wolfe, 2013; Rivera et al., 2010; Stadtfeld et al., 2017; Vu et al., 2017; Wang and Huberman, 2012). Yet, with the exception of a limited number of studies (e.g., Amati et al., 2019; Kitts et al., 2017; Lee et al., 2019; Moody, 2002; Stadtfeld et al., 2017) relatively little empirical work is available that has explicitly documented temporal and contextual variations in the constructive mechanisms underlying social structure.
Under conditions of time-specificity and sequential constraints, “past history creates the context for present action, forming differential propensities for relational events to occur” (Butts, 2008, p.160). This fundamental insight on the path-dependence of individual action (March and Olsen, 1983) was originally limited to the analysis of conversation (Gibson, 2005; Mondada, 2019), but is progressively becoming more central to our understanding of a broader range of social phenomena like, for example, small group dynamics (Leenders et al., 2016), and interorganizational coordination (Lomi et al., 2014).
The empirical application we develop in this paper documents the internal time structure of basic mechanisms of network dependence that include repetition, reciprocity, as well as related forms of triadic closure such as, for example, transitive and cyclic closure. We narrow the focus on the dynamics of reciprocation—the social process associated with reciprocity—in its direct (restricted exchange) and indirect (generalized exchange) forms. Indeed reciprocity is responsible for more complex structures of dependence that are of key importance in the building of social structure (Burt, 1992; Coleman, 1988; Uzzi, 1996, 1997).
The network mechanisms of interest in the empirical part of our study are described in Table 1 along with their antecedent configurations from which they derive.
Description of network mechanisms and their antecedent configurations.
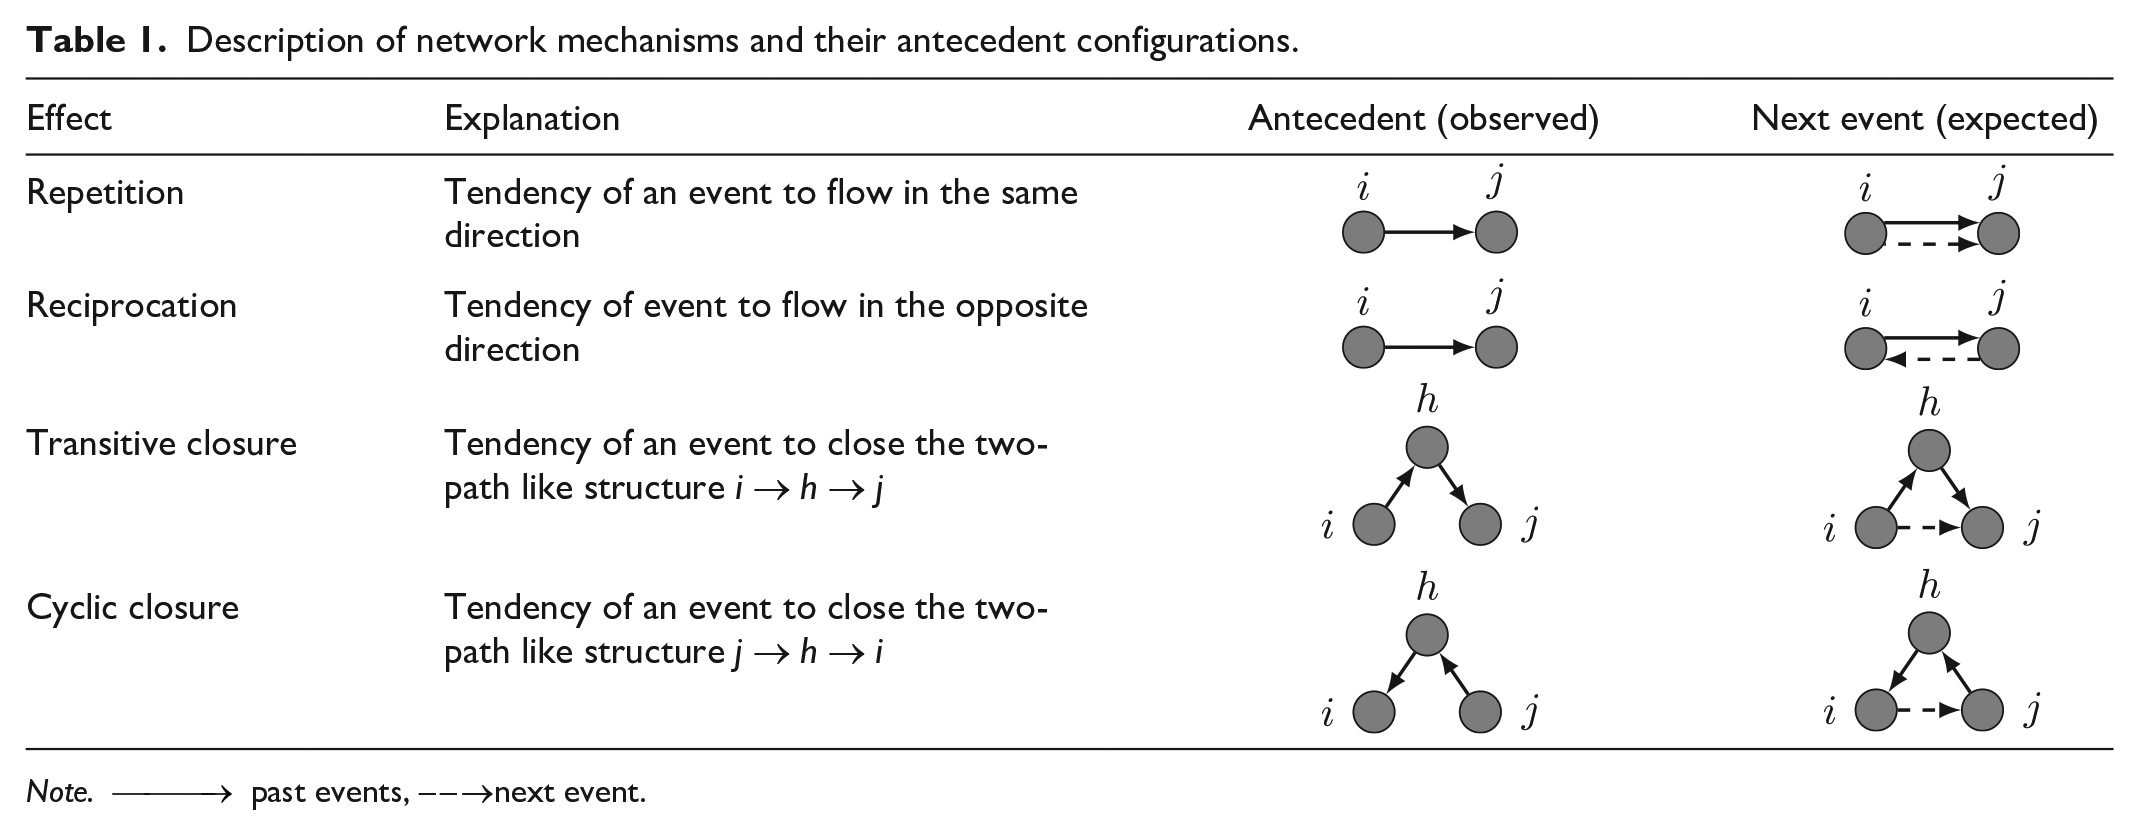
Note.
The distribution of the internal time of each mechanism involves measuring the time elapsed between the emergence of a time-localized pattern of events and its antecedent configuration. Time to reciprocation, for instance, measures the time elapsed between two consecutive directed actions involving the same pair of senders and receivers. The time to transitive and cyclic closure is the time required to close two-path like structures—that is, structures of dependence that may connect two nodes
The process that crystallizes relational events sequences into local structures of network dependence is reported in Figure 1. The graphical representation reports a hypothetical sequence of 15 relational events occurring between three actors
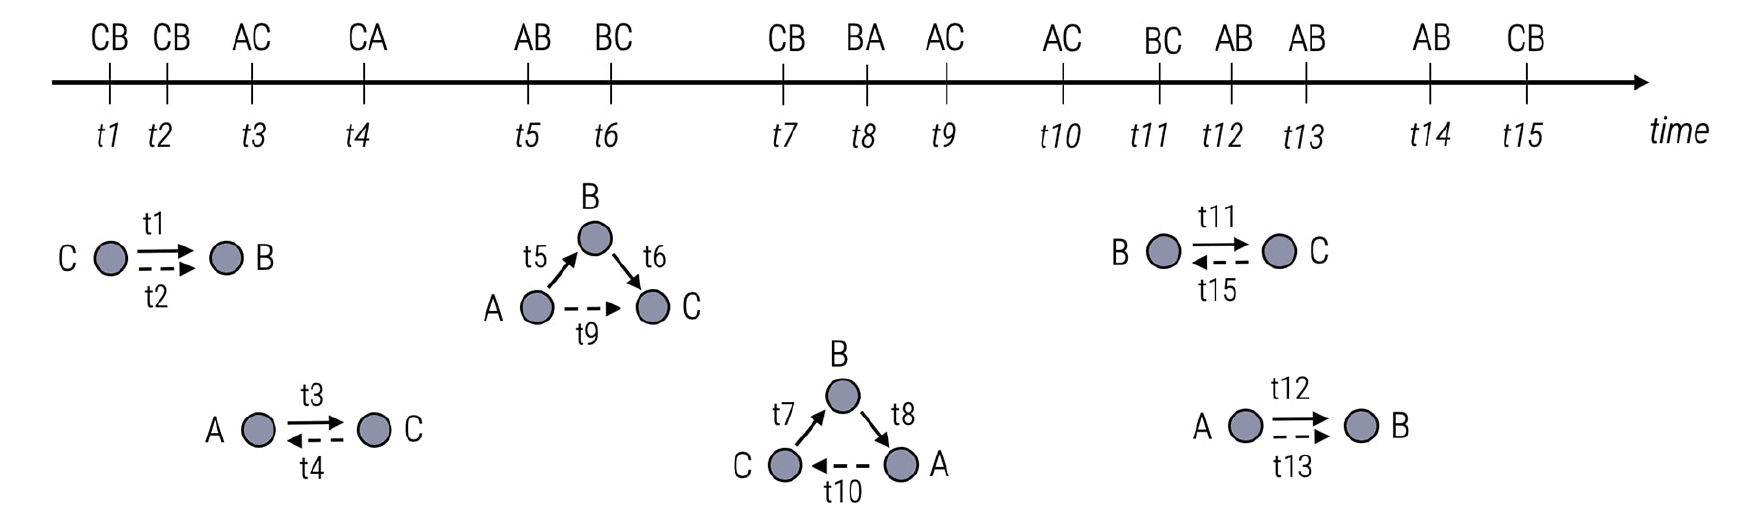
Formation of network-like structures of dependence from sequences of relational events. For each social mechanism its antecedent is reported. Examples of such mechanisms are repetition, reciprocity, transitive and cyclic closure.
As our empirical application illustrates, (i) different mechanisms exhibit differences in their distributions of internal times; (ii) the same mechanism displays differences in its distribution across distinct exchange regimes.
Material and methods
Setting and data
We situate our study in the context of financial markets. Specifically, we focus on the European interbank money market, a secondary financial market that allows banks facing contingent liquidity constraints and banks having excessive liquidity to manage their resource needs. Funds are exchanged via bank-to-bank transactions conducted through a technology-mediated market interface. The traded financial instruments are considered cash equivalents, and typically have overnight maturities–– that is, loans stipulated one day, must be reimbursed the day after. The object of main analytical interest is the sequence of events generated by high-frequency financial transactions.
Several studies have examined the network of transactions between European banks. In the typical empirical study, the network structure is obtained by aggregating flows of transactions into stable trading relationships that are then examined in terms of their topological network properties (e.g., De Masi et al., 2006; Finger et al., 2013; Fricke and Lux, 2015; Iori et al., 2007, 2008). More recent studies have revealed an interest in the social mechanisms matching buyers and sellers on the trading platform. Finger et al. (2013) have shown that the interbank market exhibits random network qualities at the daily scale but systematic structures over longer periods like months or quarters. For quarterly aggregated networks of credit provision, for example, Finger and Lux (2017) have found that the existence and extent of past credit relationships is a major determinant for future credit extensions. Bianchi et al. (2020) have proposed a longitudinal network model based on latent trajectories to study the evolution of reciprocal giving behaviors in consequence of the exogenous shocks that have severely affected the European interbank market since 2008. Applications of relational event models to the analysis of networks of financial transaction have emerged more recently (Bianchi and Lomi, 2022; Lomi and Bianchi, 2022; Zappa and Vu, 2021).
While different in emphasis and methods, extant studies of liquidity exchange paved the way to our analysis of time-specific variations in network mechanisms. The high-frequency nature of overnight liquidity transfers, along with the rich network structure of credit provisions, make the European interbank market an almost ideal setting to detect changes in the internal time structure of those network mechanisms that are typically associated with dependence structures of broad theoretical interest in the formation of social structure.
We collected data on time-stamped unsecured interbank transactions recorded on the e-MID trading platform between 2005 and 2015. e-MID serves as the reference marketplace to trade interbank liquidity in Europe. Its real-time gross settlement system is open from Monday to Friday and from 8:30 am to 5:30 pm. The exact terms of each transaction are accurately recorded, thus opening the way to detailed micro-structure examinations.
In line with previous articles based on the same data source, we focus exclusively on the overnight segment of the market. The overnight segment alone accounts for more than 85% of the global number of credit extensions and its trading dynamics have been shown to be representative of the whole market (Beaupain and Durré, 2008).
Each row in our dataset corresponds to an overnight transaction, which is public in terms of duration, time (precise to the second), amount (in millions of EUR), and rate. The identity of the credit institutions involved in the trading of overnight funds is provided by unique identification codes that reveal banks’ country of origin. Banks are not defined as buyers or sellers of liquidity. Rather they are classified according to their role on the e-MID market. Banks that reveal their intention to trade are known as quoters while banks that hit the quote are knows as aggressors. To determine buyers and sellers of liquidity at each trading instance, we refer to the labels buy or sell associated with aggressors. Figure 2(a) illustrates a sample of our data. The resulting dataset is composed of a time-ordered sequence of 602,127 overnight transactions between 211 banks. For the purpose of our empirical work, raw data have been processed to obtain a time-ordered list of high-frequency transactions whose time-stamp has been recorded as a number. The integer part refers the calendar day while the decimal part indicates the exact time of the transaction down to the second. Figure 2(b) shows the input data for our empirical application.
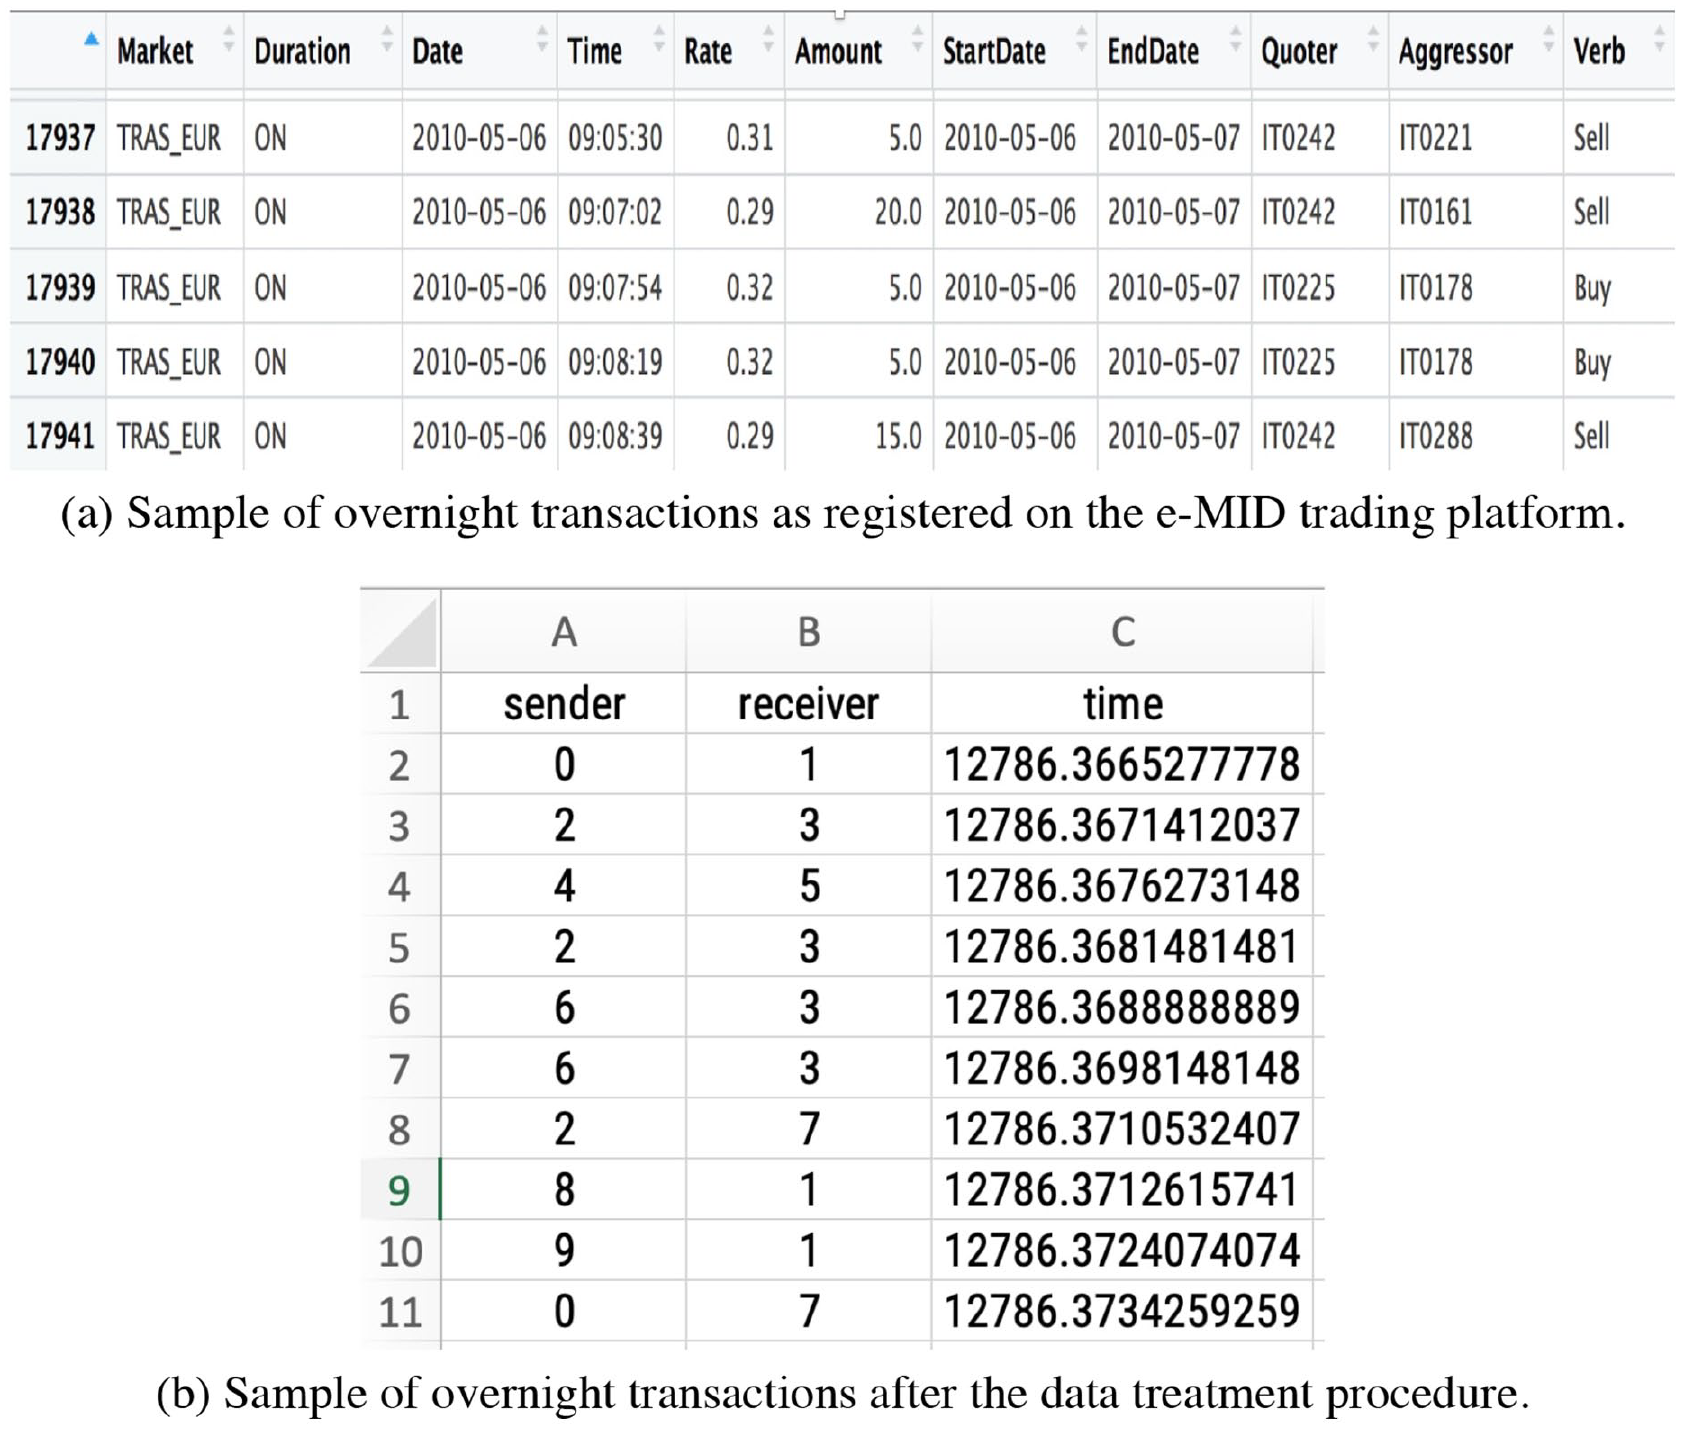
Transactions are relational actions involving banks as senders and receivers of overnight liquidity. Transactions are associated with a time stamp and are precise to the second.
The emergence of the global financial crisis (GFC) in September 2008 represents a quasi-experiment that makes it possible to split the whole sample into four distinct sub-samples that correspond to four distinct exchange regimes. Figure 3 summarizes the boundaries of each exchange regime and shows the key dates defining the lower and upper bounds of each phase. On the one hand, the GFC has been anticipated by a period of market turmoil and, on the other, has been followed by a sovereign debt crisis (SDC) period that severely hit Southern European countries. Figure 3 summarizes the four exchange regimes that we identify and shows the key dates defining the lower and upper bounds of each phase.
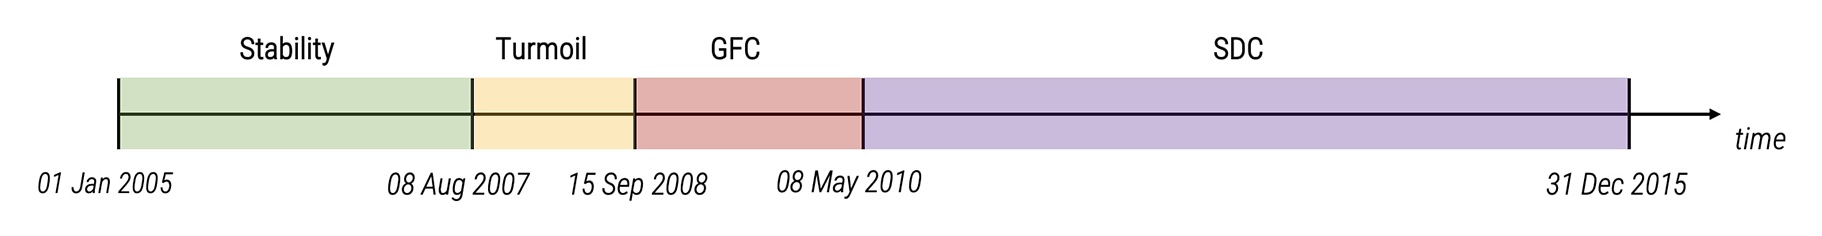
Exchange regimes across the observation period (2005–2015). Such exchange regimes correspond to phases of market stability, turmoil, and crises. In particular, two types of crises have been recognized, namely global financial crisis (GFC) and sovereign debt crisis (SDC).
Splitting the period of observation into four sub-periods mapping onto distinct exchange regimes is consistent with the financial crisis timeline proposed by the European Central Bank (Drudi et al., 2012) and a collection of empirical papers that have recently appeared on peer reviewed journals (Brunetti et al., 2019; Hatzopoulos et al., 2015; Kapar et al., 2020; Temizsoy et al., 2015).
Algorithms
The algorithms that we have implemented to compute the internal time distribution of repetition, reciprocation, transitive, and cyclic closure account for changes in the exchange regimes. The quantities of interest are then computed in association to the four financial phases produced by the emergence of the 2008 crisis.
Computing the time to repetition is straightforward. For each transaction, the algorithm searches for the next in time transaction flowing in the same direction. The same logic is applied to the time to reciprocation, but the algorithm searches for a credit extension that flows in the opposite direction.
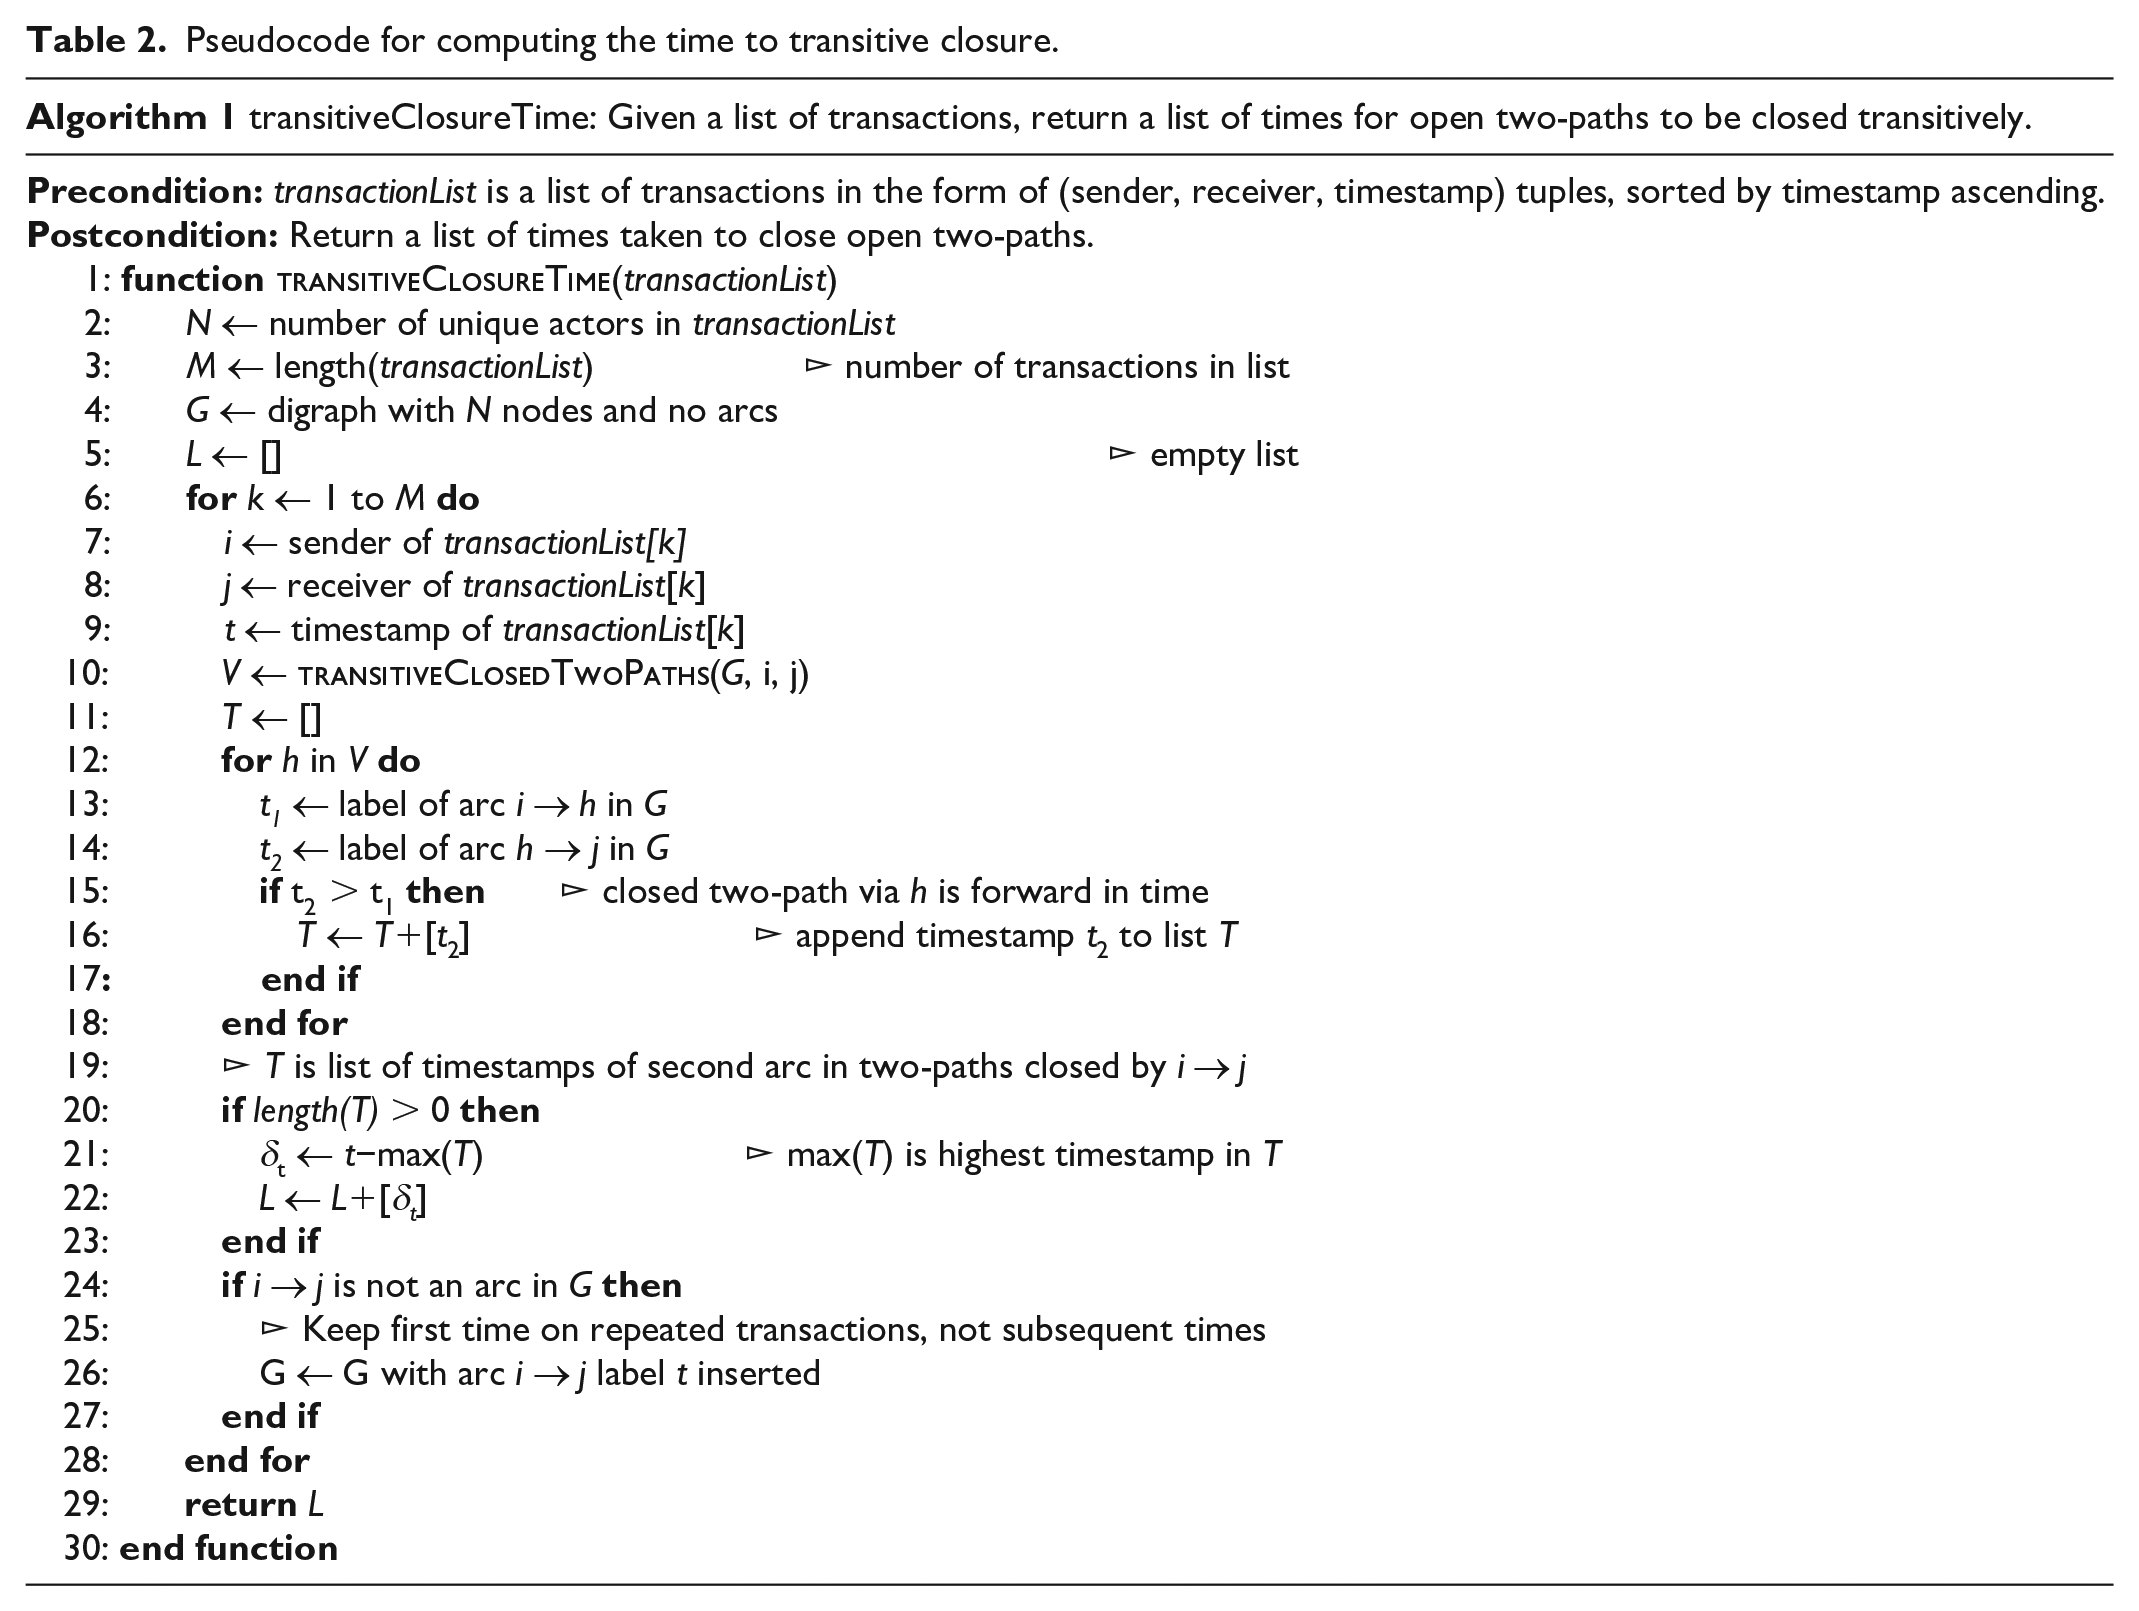
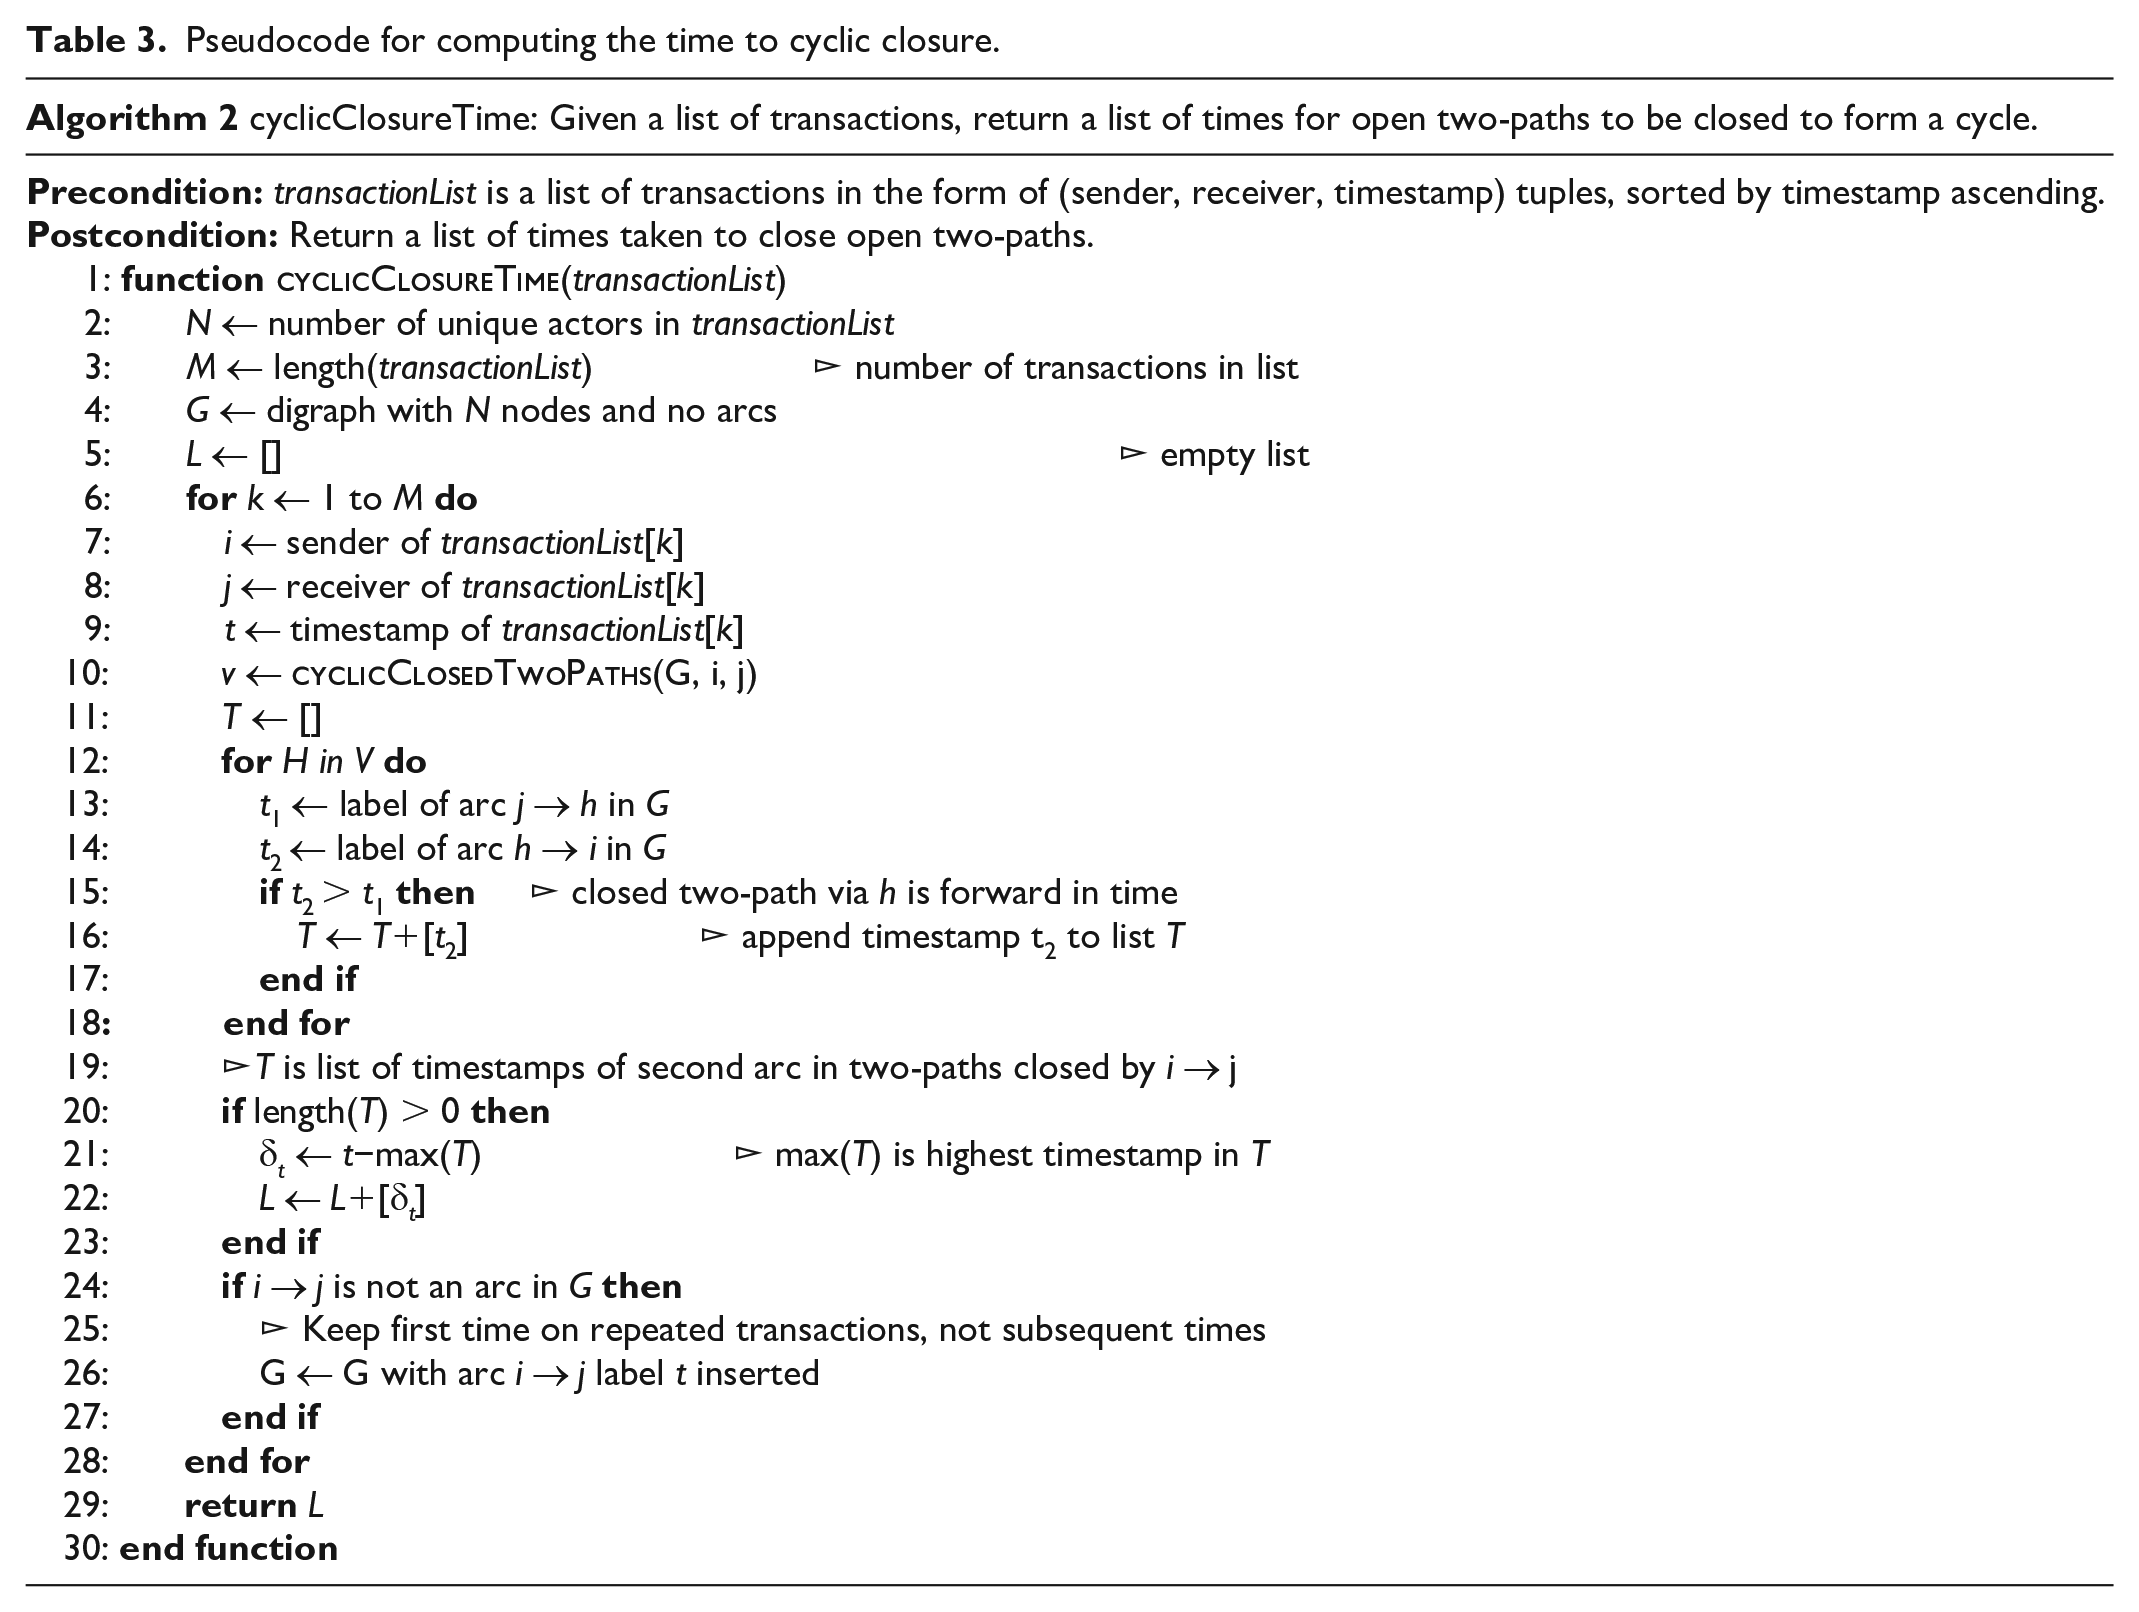
Computing the time to transitive (Table 2) and cyclic closure (Table 3) consists of a three-step procedure. The first step is registering the time needed to observe a two-path structure. The second is registering the time at which a transitive triangle is observed. The last step consists of computing the difference between times observed at the previous steps.
Pseudocode for computing the time to transitive closure.
Pseudocode for computing the time to cyclic closure.
The associated procedures—implemented in Python—are available at our GitHub repository (https://github.com/stivalaa/network_times).
These algorithms require a directed graph (digraph) data structure with labeled (weighted) arcs, capable of efficiently testing for the existence of an arc and returning its label, inserting a labeled arc, and iterating over the in-neighbors and out-neighbors of a node. In the Python programing language this is easily implemented as a “dictionary of dictionaries” data structure.
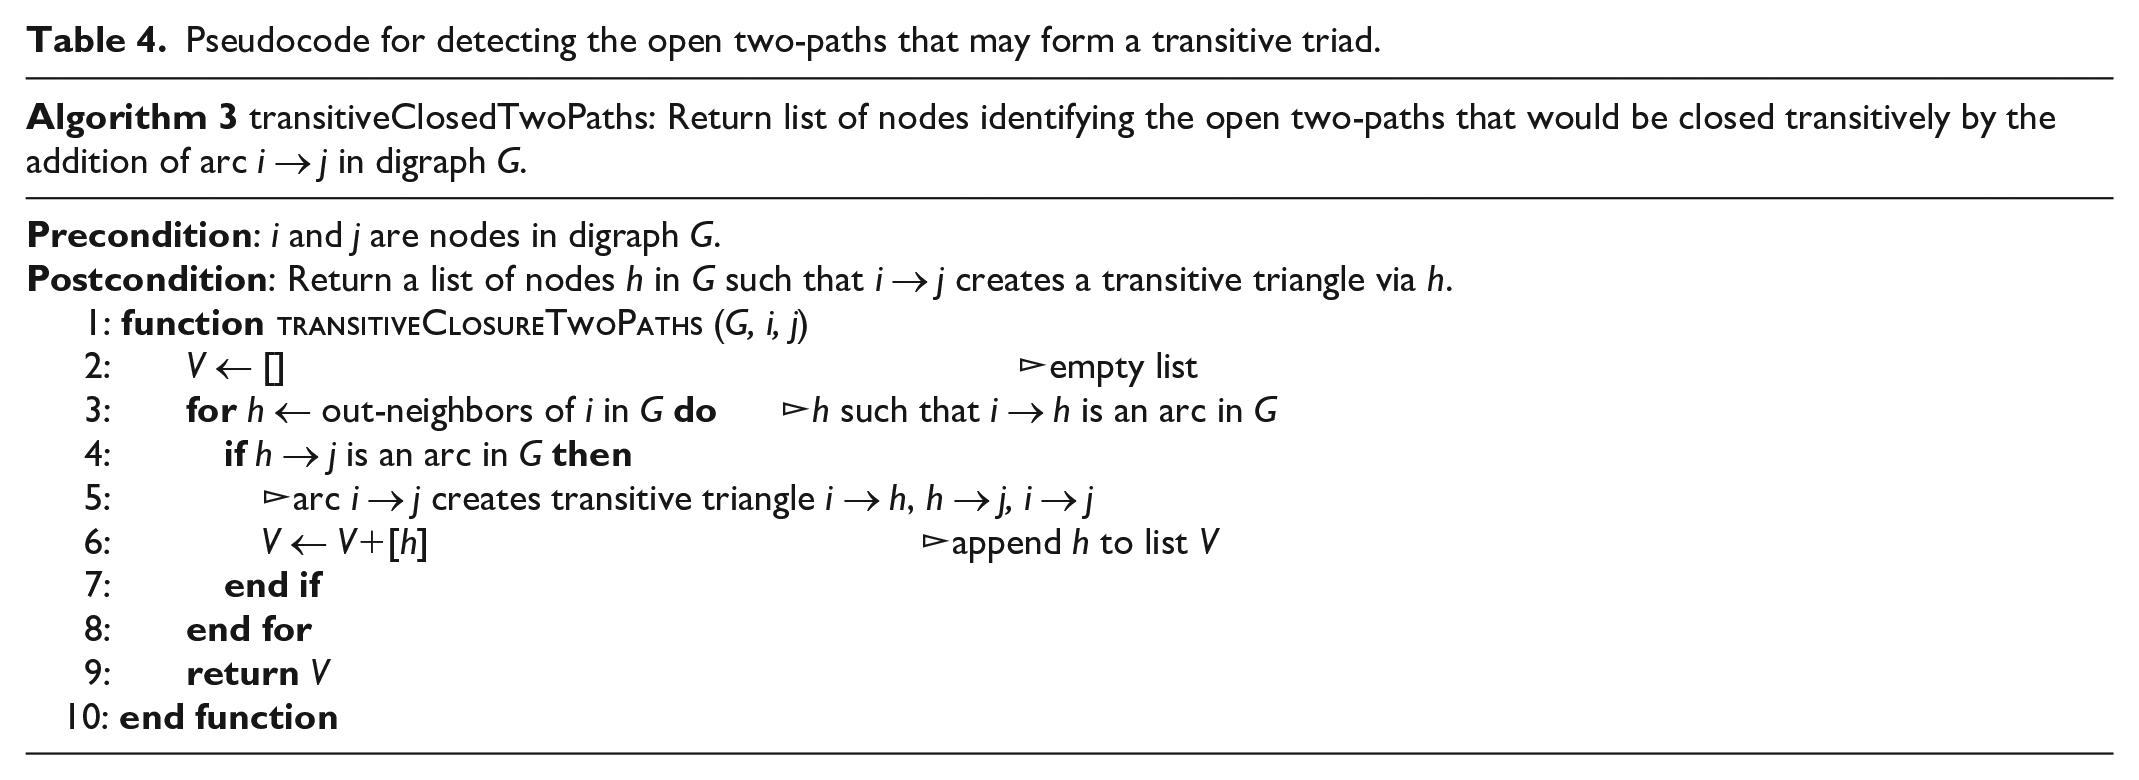
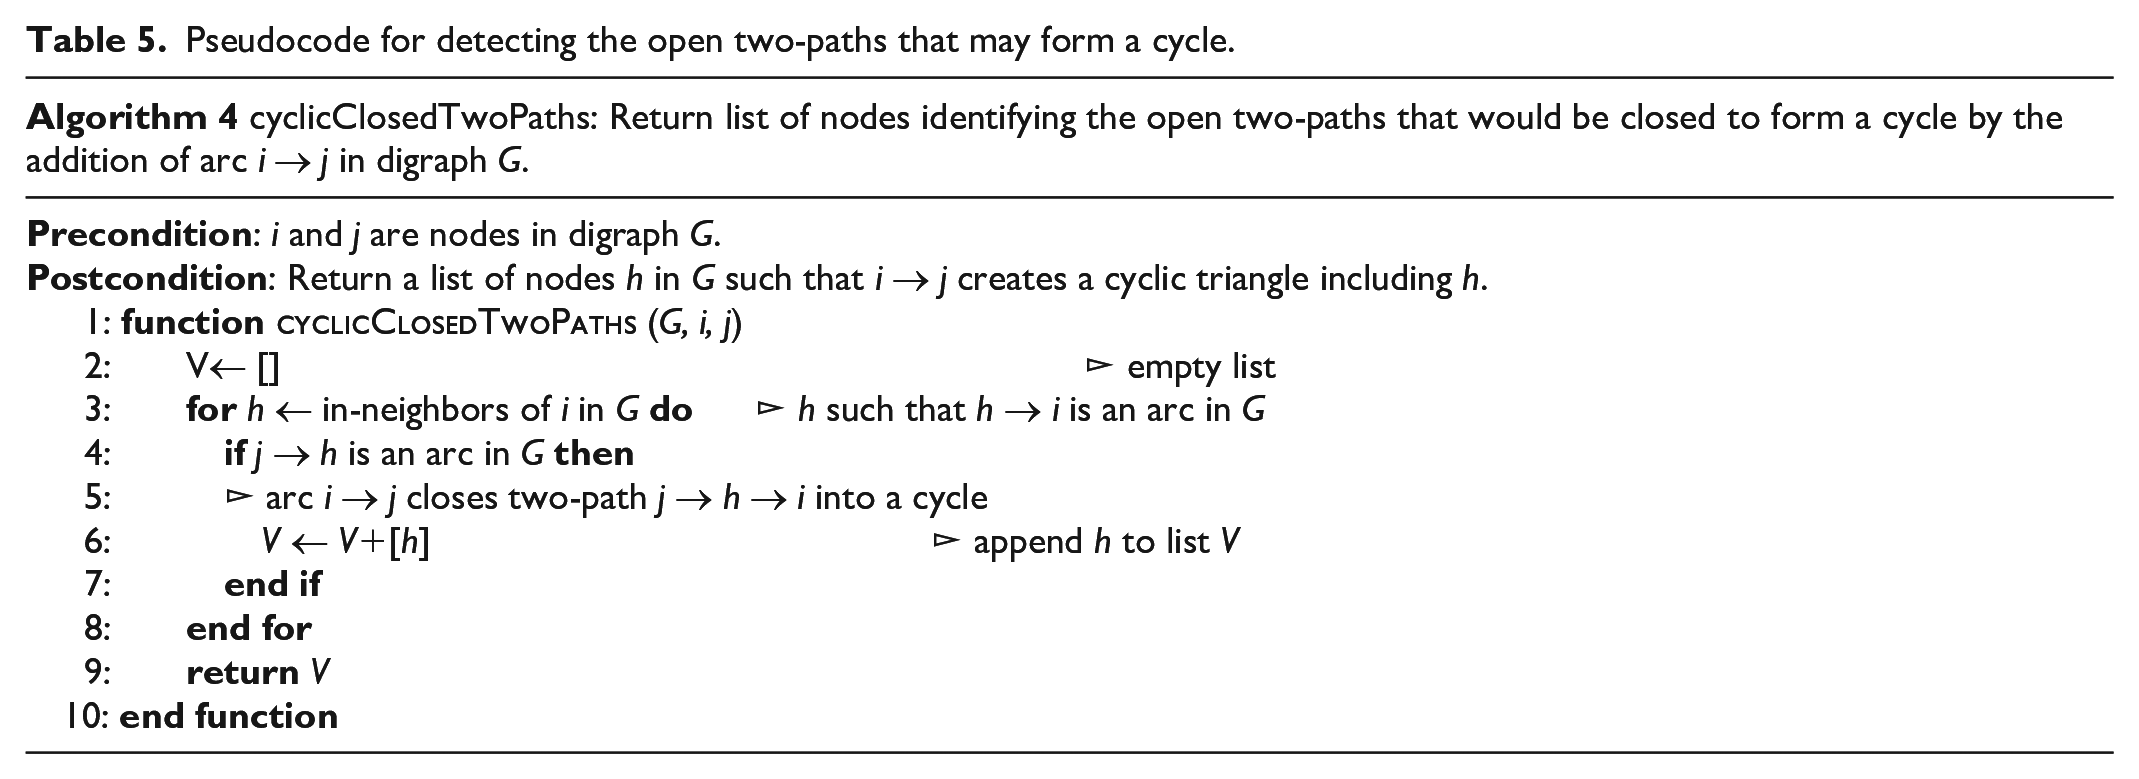
Note that the only differences between transitiveClosureTime (Table 2) and cyclicClosureTime (Table 3) are on line 10 where cyclicClosedTwoPaths (Table 5) is called instead of transitiveClosureTwoPaths (Table 4), and on lines 13–14 where
Pseudocode for detecting the open two-paths that may form a transitive triad.
Pseudocode for detecting the open two-paths that may form a cycle.
Survival analysis of high-frequency transactions
The internal time distributions of the network mechanisms of interest are the input for a survival analysis of transactions based on Kaplan-Meier estimator (Kaplan and Meier, 1958). Our empirical application shows how long individual transactions survive before being repeated or reciprocated, or how long two-paths like structures stay open before closing into transitive or cyclic triads. In the analysis we present below, a closed triad is represented as the terminal event—or “death”—for a two-path.
For the time to repetition, a censored event is the time elapsed between two consecutive events involving different pairs of senders and receivers. For the time to reciprocation, a censored event is the time elapsed between two consecutive events that are not reciprocated. For the time to transitive and cyclic closure, censored events are the times elapsed between two subsequent open two-paths. For all the mechanisms considered, a given transaction is assumed to close only one antecedent configuration. In other words, a two-path configuration is removed from the risk set after experiencing its first closure event.
Results
For each mechanism we observe four distinct distributions and an equivalent number of survival curves—each for every exchange regime determined by the emergence of the GFC. Figure 4 represents the internal time distributions of repetition, reciprocation, transitive and cyclic closure by means of their scaled kernel density estimates and boxplots.
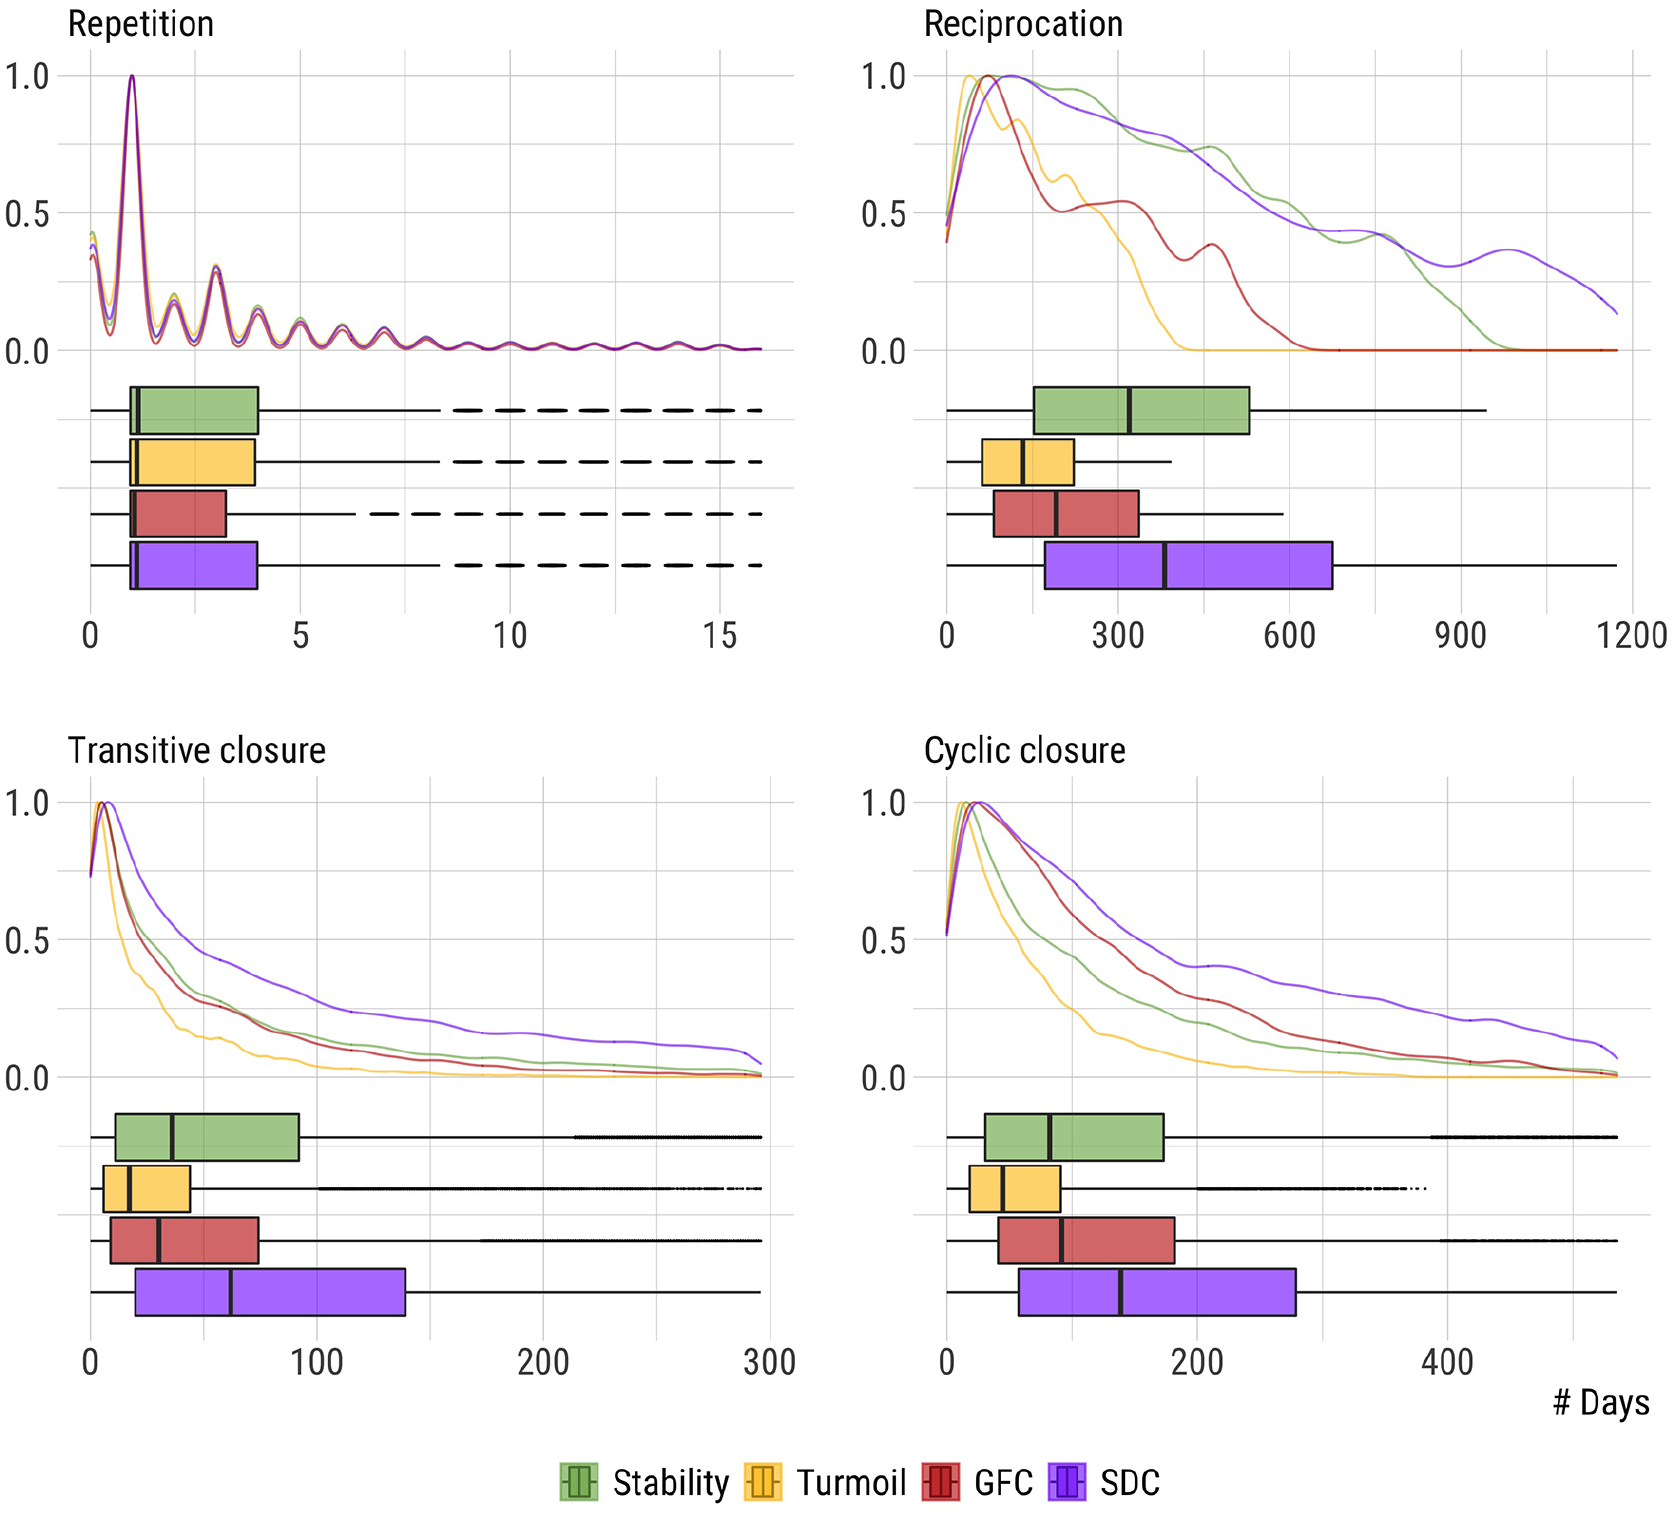
The internal time distribution of repetition, reciprocation, transitive and cyclic closure across four distinct exchange regimes, that is, stability, turmoil, global financial crisis (GFC), and sovereign debt crisis (SDC). Different time scales reflect different speeds in the unfolding of network mechanisms.
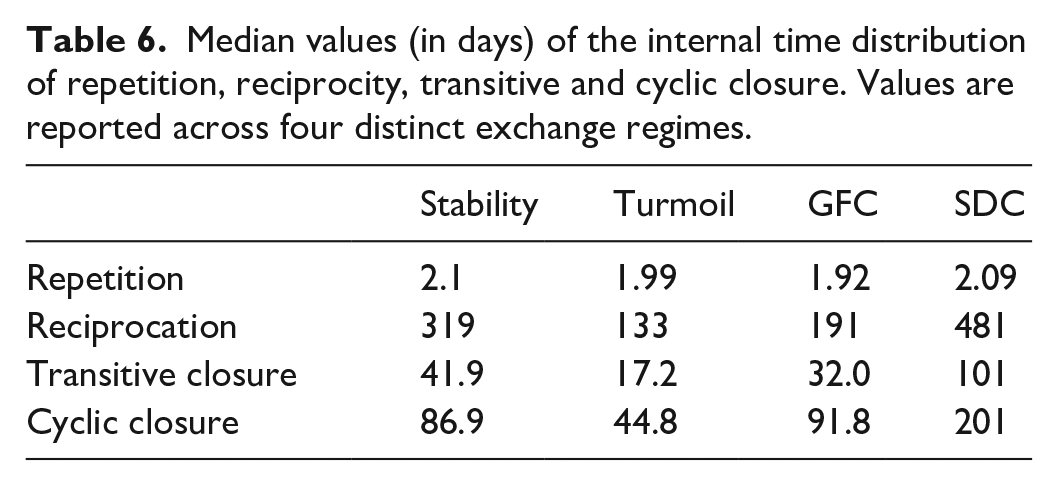
Scaled kernel density estimates—which are smoothed versions of histograms—depict the functional forms of mechanisms’ internal times. With the partial exception of repetition, all these distributions are highly skewed to the right and exhibit considerable differences across the four exchange regimes. Boxplots clearly show that distinct mechanisms do not operate in synchrony. As Table 6 documents, the median times of each distribution, for example, ranges from 2 to 481 days. More specifically, after the onset of the financial crisis, the median times of all the mechanisms—with the exception of repetition—have increased with respect to their values registered one step back in time.
Median values (in days) of the internal time distribution of repetition, reciprocity, transitive and cyclic closure. Values are reported across four distinct exchange regimes.
As Figure 5 shows, repeated transactions occur within a short period of time, no longer than 3 months. For example, the probability of observing a repeated transaction within the same trading day is 70%. The same measure decreases to 30% after 5 days and, for longer time horizons, this decreases to approximately 10% after 1 month, and to 3% after 3 months. These results suggest that credit extensions of overnight liquidity have occurred approximately at the same rate during the whole period of observation despite significant churning in the set of market participants.
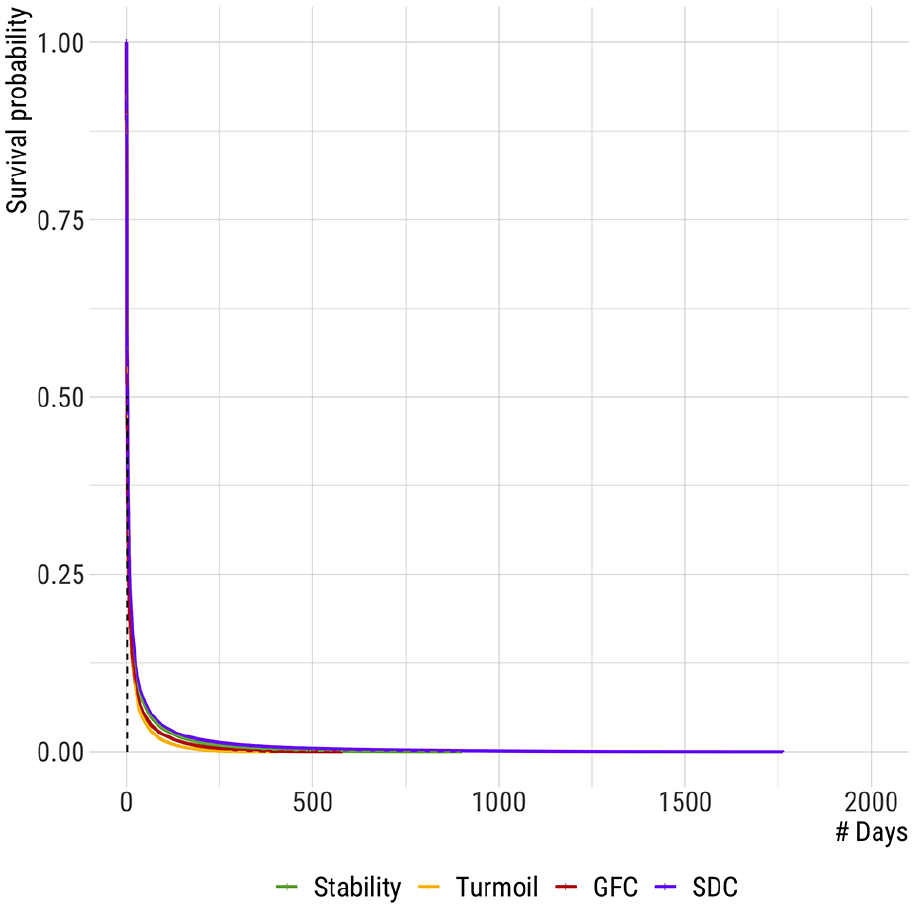
Kaplan-Meier curves for repeated transactions across four exchange regimes that correspond to periods of market stability, turmoil, global financial crisis (GFC), and sovereign debt crisis (SDC).
Our analysis of the time to reciprocation in Figure 6 suggests that the time to reciprocate a credit extension varies considerably within the four exchange regimes of the financial crisis. The median survival times for reciprocation differ from that of repetition and in the order of 100s of days. By considering the stability phase as the benchmark period, as well as we observed in the analysis of repetition, the trading on the interbank market is faster during periods in which the global economic scenario is suffering—that is, during the turmoil and the GFC phases. The survival probabilities for reciprocation have changed considerably during the last period of observation. The average time to reciprocation increased by approximately 2.5 times.
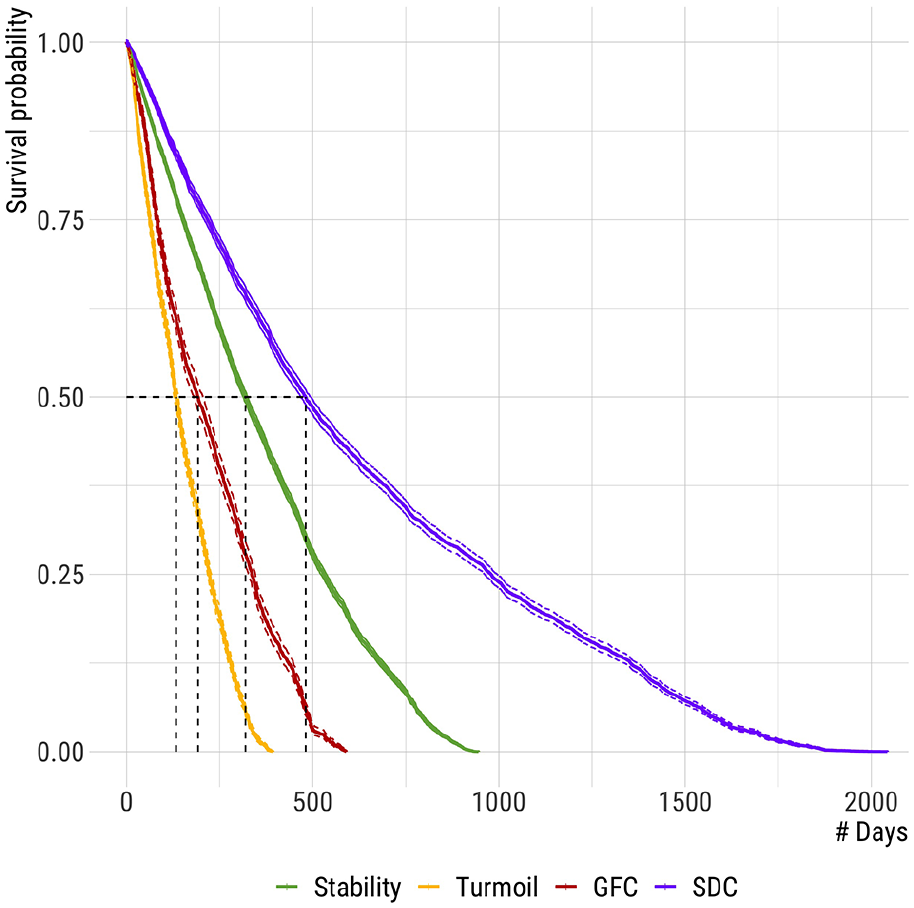
Kaplan-Meier curves for reciprocated transactions.
Given a transaction connecting a pair of senders and receivers, the probability that it remains unreciprocated after 30 days is 95.3% under conditions of market stability, and 97% during the SDC period. The same measure is equal to 88.3% and 92.8% in the turmoil and GFC phases, respectively. In other words, the probability that a transaction is reciprocated after 30 days is extremely low under all the four exchange regimes. Overall, along with the decreasing number of reciprocated relations, survival probabilities seem to suggest a preference for role specialization, with credit institutions that typically trade from one side of the market interface—that is, either as buyers or sellers of overnight funds.
Kaplan-Meier survival curves for the time to transitive closure are reported in Figure 7. The capacity of European banks to extend credit within a network of transitive relationships increased soon after the first turmoils in summer 2007. With respect to the stability period, the time to transitive closure has immediately decreased and progressively adjusted to reach the initial level during the GFC phase. The contraction of the time to transitive closure during the periods of highest financial uncertainty suggests that indirect connectivity mechanisms like transitive closure are as sensitive as simpler direct connectivity mechanisms like repetition and reciprocation. As it happens with the other micro-mechanisms of interest, the time to transitive closure considerably increases during the last period of observation. A possible explanation for this general tendency is that during the SDC phase the general market activity decreased, with the obvious consequence that a larger number of two-path sequences remained open. Fewer repeated and reciprocated transactions were also observed during this period.
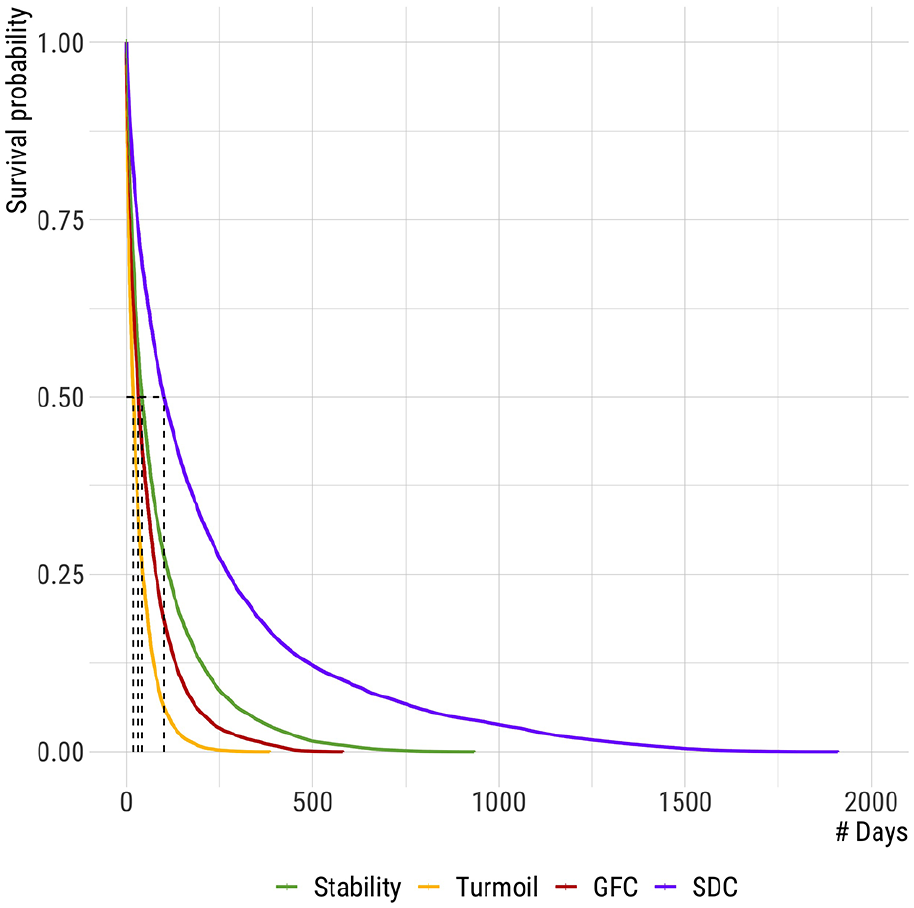
Kaplan-Meier curves for transactions embedded in transitive triads.
This general observation finds empirical support in the computation of survival probabilities of transitive triads that reach their highest value during the SDC phase. In the stability period the probability of observing an open two-path after 30 days is 57.91%. After decreasing to 34.77% in the turmoil phase, the same probability increases across the crises periods. In particular, the probability of survival after one month increases from 51.41% to 74.5% when the GFC turned into a SDC period. Overall, these results seem to support the claim that the more the market activity decreases and the economic conditions worsen, the less European banks tend to entrench trading relationships with the trading partners of their counterparts.
Kaplan-Meier survival curves for the time to cyclic closure are reported in Figure 8. The time to observe the patterns of generalized exchange differ during the entire period of observation. During the stability and GFC phases, half of the open two-paths became embedded into cyclic structures within a period of approximately 90 days. To observe the same result it takes less (45 days) during the turmoil period, and much more (201 days) during the SDC period. Consistently, the probability of survival for open two-paths is the highest in the SDC phase, with a value of 88.90%, and the lowest in the turmoil period, being equal to 62.38%. In the intermediate cases, the probability that open two-paths survive after 1 month is 76.10% in conditions of market stability and 80.78% at the onset of the GFC.
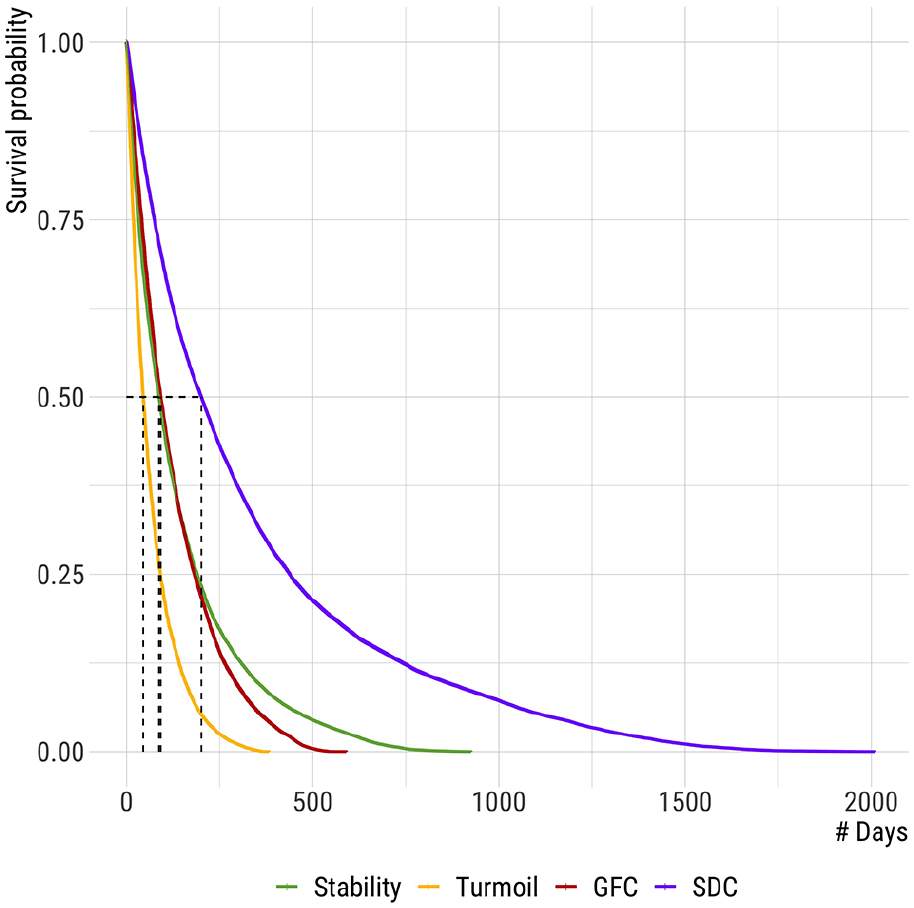
Kaplan-Meier curves for transactions embedded in cyclic triads.
These results provide evidence that (i) different social mechanisms do not evolve in synchrony—that is, some mechanisms operate faster than others; (ii) the “rhythms” of such mechanisms—that is, their internal time distributions—may vary over time.
Discussion and conclusions
Network evolution emerges from the interaction of multiple micro-mechanisms (Stadtfeld et al., 2020). One source of complexity in empirical models for network evolution arises from the presence of multiple clocks regulating the speed at which these mechanisms operate to produce observed patterns of network change. This argument is best understood when network evolution is analyzed at its lowest possible level of observation––that is, in terms of relational events (Brandes et al., 2009) interpreted as: “sequences of occurrences that result in transformations of structures” (Sewell, 2005, p.227). 1 This view implies a direct connection between network “times” and network “structures.”
The social character of networks generated by sequences of relational events is revealed by the their internal tendency to self-organize into time-localized patterns associated with recognizable relational mechanisms. This process-oriented view of social networks allows new questions to be asked about the internal micro-structure of social mechanisms. How fast does reciprocation (unobservable) generate reciprocity (observed)? And how fast does path-shortening generate the various form of closure so frequently documented in empirical studies? How does the (absolute and relative) speed of these social mechanisms vary across social settings—and over (calendar) time? We think addressing these questions is crucial for constructing a theoretical understanding of network structure as a “living flow that reproduces, not a building “structure,” static and dead” (Padgett, 2018, p.406). The argument that we have developed in this paper is only a preliminary step toward a reconceptualization of network “structure” that incorporates in its definition dynamic elements of change.
The objective of this paper was to articulate this argument by: (i) suggesting that multiple mechanism-specific clocks regulate the intensity of observed network “flows;” (ii) providing one possible algorithmic solution to the problem of reconstructing the internal time distribution of network effects given a sequence of observed time-ordered relational events, and illustrating how the internal timing of network mechanisms itself might change over (historical) time.
The empirical case study that we have developed demonstrates with particular clarity our orienting claim that network mechanisms operate at different speed, and that their speed is sensitive to changes originating in the institutional context of exchange (Lomi and Bianchi, 2022). Building on prior research (Finger and Lux, 2017), our empirical application narrowed the focus on four mechanisms that shape the evolution of the European interbank market—that is, repetition, reciprocation, transitive closure, and cyclic closure. Dyadic patterns of exchange, such as repetition and reciprocation, accelerate during periods of market turbulence. We found that path-shortening (“closure”) is also sensitive to the level of uncertainty inherent in financial crises. During market turmoil, open two-paths crystallize into transitive and cyclic patterns of exchange at much faster rates than in periods of stability. Due to the deterioration of global economic conditions during the last period of observation, the network mechanisms slowed down reflecting the general contraction of trading activities.
Simply changing the interpretation of “reciprocity” or “transitivity” from descriptive aggregate structural feature of the social structure of financial markets (Finger and Lux, 2017; Finger et al., 2013) to time-dependent social processes paves the way to a new understanding of structure that promises to take us beyond the traditional dualism between concepts of network “ties” versus network “flows” (Borgatti and Halgin, 2011) or—more generally—between “structure” and “change” (Padgett and Powell, 2012). While this article is obviously not the first to observe the presence of a mutually constitutive relation linking social structures and social flows (Breiger, 1990), it still is one of the relatively few available, linking a more dynamic concept of network structure to data produced by decentralized large-scale institutional systems of economic exchange (Butts, 2009).
To the best of our knowledge, this is also one of the few studies currently available offering a systemic empirical demonstration of the contextual viability of network mechanisms due to variations in their internal time structure. Extant research has recognized the variability of network effects (Amati et al., 2019; Bianchi and Lomi, 2022; Bianchi et al., 2020; Lomi and Bianchi, 2022; Zappa and Vu, 2021), but has not connected it to differences in the speed at which the different dependence mechanisms operate.
The generality of our results is clearly constrained by a number of idiosyncratic contextual elements that would be hard to reproduce outside financial markets. However, technology-mediated communication (Butts, 2008) and participation in on-line crowd-sourced activities (Lerner and Lomi, 2020) come to mind as relational settings capable of producing data structures comparable in frequency and volume to those produced by the financial market that we have examined in the empirical part of this study. However, the fact that the roles of buyer and seller are completely contingent on individual interactions (Aspers, 2007; Leifer, 1988; Lomi and Bianchi, 2022), make financial markets more similar to animal societies organized by dominance relations produced by directed behavioral sequences than known forms of role-based formal human organization (Chase, 1982; Chase et al., 2002). Yet, the problem of representing and understanding the internal timing of social mechanisms easily transcends the restrictive boundaries of our empirical setting.
For this reason we believe that our study supports the general conjecture that different network mechanisms are regulated by internal clocks ticking at different speeds. As our empirical illustration suggests, the master-clock of historical time may influence the speed at which these mechanism-specific clocks tick. How the different mechanism-specific clocks interact and change with historical time to shape the evolutionary dynamics of social and other kinds of networks is something that we call future research to clarify.
Directly related to the first, a second conjecture is that the speed at which network mechanisms operate is contingent on the social structure of the exchange setting. For example, in our study we found that path-shortening tends to operate faster then reciprocation, and that repetition is relatively insensitive to variations in the level of environmental uncertainty.
The interpretation that mechanisms involving role-switching (e.g., reciprocation) are more complex—and ultimately slower—than mechanisms that simply involve a larger number of actors (e.g., path-shortening) is consistent with the results we obtained for cyclic closure, which tends to operate more slowly than transitive closure.
In exchange settings characterized by roles that are more difficult to change and hence more stable, like, for example, in product and producer markets (Lomi and Bianchi, 2022; White and Eccles, 1987), it could be conjectured that the relative speed of these mechanisms will be reversed. This may happen because in exchange systems characterized by institutionalized roles, simpler mechanisms—like reciprocation—involve lower coordination costs than mechanisms involving a larger number of actors—like path-shortening.
In general, how the results produced by received empirical research based on statistical models for networks might be re-interpreted once we consider the possibility that network mechanisms may operate asynchronously and at different clock-speeds, and how empirical studies should be designed to translate this conjecture into testable hypotheses is again a challenge that we hope future research will take on.
The third conjecture that our study suggests is a direct consequence of the prior two. The fixed-length observation period of empirical studies of social networks is problematic when the mechanisms producing network change run at different speeds. For example, if social selection and social influence mechanisms are regulated by internal clocks ticking at different speed, an observation period of fixed length will include a larger number of observations produced by the faster mechanisms (Steglich et al., 2010). This problem is not specific to pooled cross-section time series designs, but presents itself also in event-based designs (Tuma and Hannan, 1984). If relational mechanisms operate at different speed, “fast” dependencies will dominate “slow” dependencies in studies covering observation periods that are short relative to the speed of the slower mechanisms.
Footnotes
Declaration of conflicting interests
The author(s) declared no potential conflicts of interest with respect to the research, authorship, and/or publication of this article.
Funding
The author(s) disclosed receipt of the following financial support for the research, authorship, and/or publication of this article: The work leading to this article was supported by the Swiss National Science Foundation through Grant Number P2TIP1_184165 "Financial markets as evolving relational systems" awarded to Federica Bianchi.