
Abstract
This paper introduces new effect parameters for factorial survival designs with possibly right-censored time-to-event data. In the special case of a two-sample design, it coincides with the concordance or Wilcoxon parameter in survival analysis. More generally, the new parameters describe treatment or interaction effects and we develop estimates and tests to infer their presence. We rigorously study their asymptotic properties and additionally suggest wild bootstrapping for a consistent and distribution-free application of the inference procedures. The small sample performance is discussed based on simulation results. The practical usefulness of the developed methodology is exemplified on a data example about patients with colon cancer by conducting one- and two-factorial analyses.
Keywords
1 Motivation and introduction
Factorial designs are often encountered in biomedical and clinical trials.1–5 Here, not only the (main) effects of separate factors but also interaction effects that are related to possibly complex factor combinations are of importance. Such interaction effects may even alter the interpretation of main effects leading to the established comment that ‘it is desirable for reports of factorial trials to include estimates of the interaction between the treatments’. 6
On the other hand, nonparametric estimation and the inference of adequate effects in such designs can be rather involved. In particular, most existing inference procedures have focused on testing hypotheses formulated in terms of distribution functions.7–15 But those cannot be inverted to obtain confidence intervals or regions for meaningful effects. Only recently, nonparametric methods for inferring adequate effects in general factorial designs with independent and dependent observations have been established.16–19 These procedures are, however, only developed for completely observed data and not applicable for partially observed time-to-event data. Since many clinical studies are concerned with survival outcomes, adequate statistical inference methods for complex factorial time-to-event designs are of particular interest.
To detect main effects, weighted logrank tests or their extensions may be applied in case of two or multiple samples.20–28 However, these procedures only infer conclusions in terms of cumulative hazard functions and cannot be applied to obtain concrete effect parameters with informative confidence intervals nor tests for the presence of interactions. In practice, interaction effects are usually modeled with the help of Cox-, Aalen-, or even Cox-Aalen regression models with factors as covariates and incorporated interaction terms.29–31 However, although very flexible, these models are usually more driven towards hazards modeling from continuous event times. Moreover, the incorporation of several factor variables (e.g., via multiple dummy variables per factor) can become cumbersome; this is so even in the uncensored case, especially when interactions are incorporated.32,33
The above problems directly motivate a nonparametric approach for estimating and inferring main and interaction effects in factorial designs with censored observations. So far, only few nonparametric survival procedures exist in this context.12,34 They are based on a purely nonparametric model that does not require any multiplicative or additive structure of the hazards and can even be applied for arbitrary, possibly non-continuous survival distributions (i.e. it can be readily used for survival times rounded to days, weeks or months). Moreover, it leads to tests for main and interaction effects in case of independent right-censored data. However, these tests suffer from several drawbacks: the procedure is based on a rather strong assumption on the underlying censorship distribution which is often hard to verify in practical situations. In addition, null hypotheses are only formulated in terms of distribution functions. As a result, there is no direct quantification and estimation of main and interaction effects in terms of confidence intervals as, e.g. required by regulatory authorities (ICH E9 Guideline, 1998, p. 25).35
This is to be changed in the current paper. We develop and rigorously analyze nonparametric inference procedures, i.e. tests and confidence intervals, for meaningful effect sizes in factorial survival designs, where data may be subject to random right-censoring.
Similar to the adaption of the test by Brunner and Munzel test to the two-sample survival set-up by Dobler and Pauly, we consider the recently proposed unweighted nonparametric effects of Brunner et al. and extend their ansatz to a general survival setting.17,36,37 In the special case of proportional hazards, these effects have a direct relationship to hazard ratios in two-sample settings. 38 At the same time, they remain meaningful in case of non-proportional hazards. This fact makes the effect sizes even more appealing for practical purposes.
In the following sections, the statistical model and important results on the basic estimators are presented and the resulting test statistic for the null hypotheses of interest is stated and mathematically analyzed. Since the asymptotic distribution of the test statistic depends on unknown parameters, we propose a distribution-free multiplier resampling approach and prove its consistency. Next, it is supplemented by a simulation study to assess the finite sample properties of the proposed procedure. It is further exemplified on a colon cancer study, where in the original study the analysis was made in terms of Cox models. 39 Finally, the paper closes with concluding comments. All proofs are deferred to the technical Appendix 1.
2 The set-up
To establish the general model, we consider sequences of mutually independent random variables

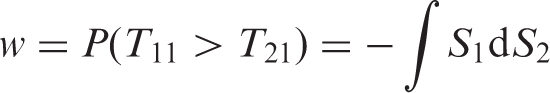
In the special case of d = 2 groups with continuous survival times, an estimator of the concordance probability
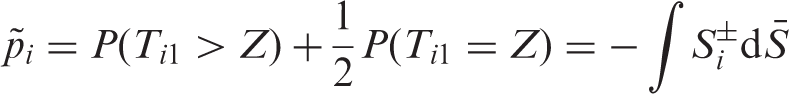
The choice of the effect parameter
From a practical point of view, estimation of the

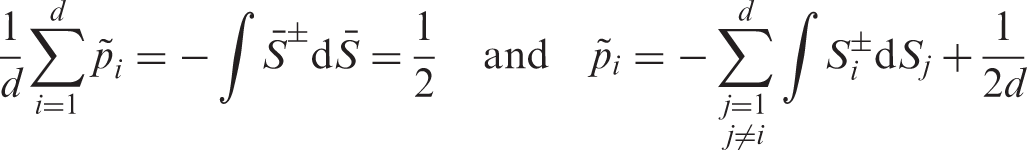
Obviously, all of the above-discussed positive properties of the effects parameter
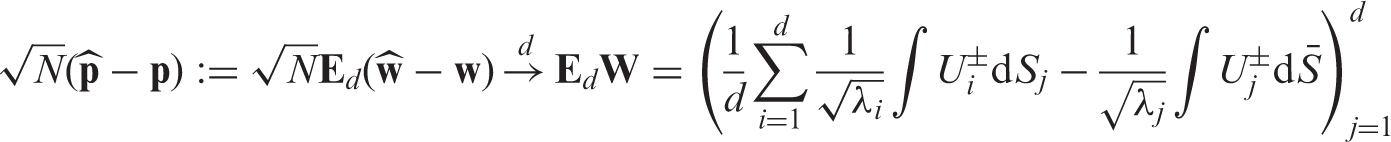
We aggregate all effects into the vector Under the asymptotic regime (4) we have
Lemma 1


In particular, we can write
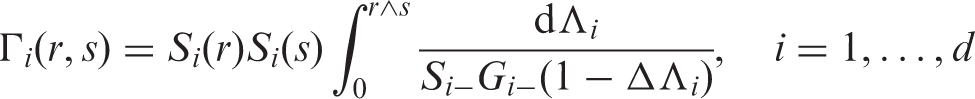

Here, the double appearance of ± signs means the average of all four combinations of left- and right-continuous versions in both arguments of a two-parameter function.
Let us now turn to the estimation of the nonparametric concordance effects Under the asymptotic regime (4) we have
Theorem 1
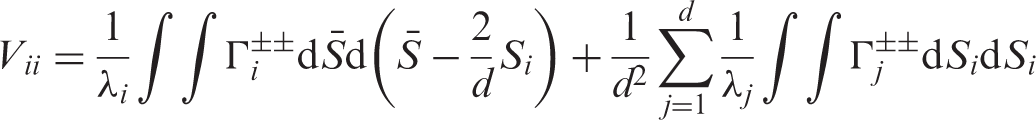

A more compact form of the matrix
3 Choice of test statistic
In order to develop hypothesis tests based on the estimator Under the asymptotic regime (4), we have the consistency Lemma 2
All of the developed convergence results are now utilized to find the most natural test statistic. First, note that the asymptotic covariance matrix
Instead, we utilize a statistic that does not rely on the uncertain convergence of ranks of generalized inverses. This leads us to the survival version of the so-called ANOVA-rank-type statistic
Assume the asymptotic regime (4) and that a) Under b) Under Theorem 2

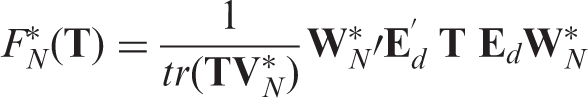
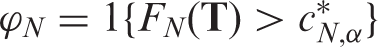
As the distribution of χ depends on unknown quantities (cf. Theorem 1), the test statistic F
N
(
4 Inference via multiplier bootstrap
In this section, we apply suitably tailored multiplier bootstrap techniques in order to approximate the small sample distribution of F
N
(

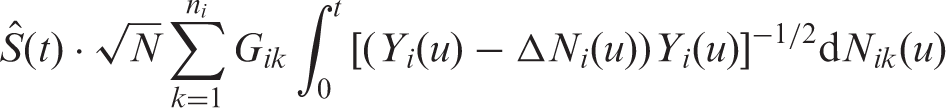
A similar wild bootstrap Greenwood-type correction has been developed for tied survival and competing risks data. 45 Here we utilized the usual counting process notation 21 : N ik indicates whether the event of interest already took place for individual k in group i. The wild bootstrap multipliers G ik , i = 1,…, n i , i = 1,…, d, are i.i.d. with zero mean and unit variance and also independent of the data. A similar multiplier resampling approach has been applied to Nelson–Aalen and Aalen–Johansen estimators in one- and two-sample problems.46,47
In a next step toward the construction of a wild bootstrap statistic, we replace
Finally, a wild bootstrap version
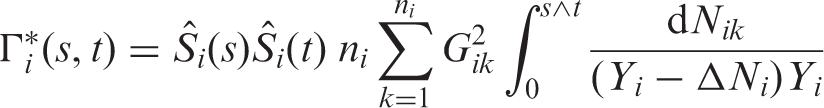
Its conditional consistency has been argued for which
The following conditional central limit theorem ensures the consistency of this resampling approach. Assume Theorem 3

We would like to stress that the limit distribution coincides with that of F
N
(
We conclude the theoretical part of this article with a presentation of deduced inference procedures for the effect sizes Under the assumptions of Theorem 3, the test
Corollary 1
4.1 Confidence intervals and regions
The above findings can also be used to construct confidence intervals and regions for the unknown effects. In particular, Theorem 1 in combination with the delta-method yields that

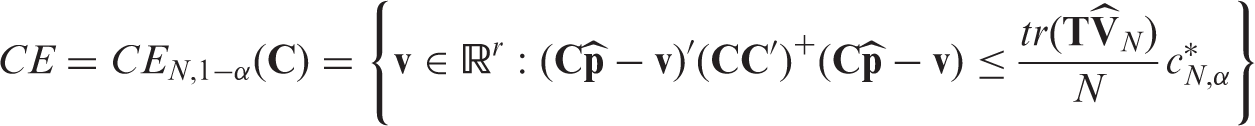
To additionally obtain simultaneous confidence ellipsoids for vectors of effect contrasts, let r be the number of columns of Under the assumptions of Theorem 3, an asymptotically exact (1 − α)-confidence ellipsoid for the contrasts Corollary 2
5 Simulations
In this section, we assess the small sample properties of the test φ N as proposed in Corollary 1.
5.1 Behaviour under null hypotheses
We first focus on its type-I-error control with respect to
various kinds of contrast matrices and different censoring intensities.
5.1.1 Design and sample sizes
For ease of presentation, we restrict ourselves to a design with d = 6 groups with different sample size layouts: we considered small samples in a balanced design with
5.1.2 Censoring framework
We considered exponentially distributed censoring random variables
5.1.3 Contrast matrices and null hypotheses
We simulated the true significance level of the tests for the null hypotheses
In case of a one-way design with d = 6 groups, we were interested in the null hypotheses of ‘no group effect’ or ‘equality of all treatment effects’
Next, we consider a 2 × 3 two-way layout with two factors A (with two levels) and B (with three levels). This is incorporated in Model (1) by setting (A) ‘No main effect of factor A’: (B) ‘No main effect of factor B’:
(AB) ‘No A × B interaction effect’:

5.1.4 Survival distributions
For ease of presentation, we only considered a rather challenging scenario, where the groups follow different survival distributions. In particular, we simulated
(G1) a lognormal distribution with meanlog parameter 0 and sdlog parameter 0.2726 for the first group, (G2) a Weibull distribution with scale parameter 1.412 and shape parameter 1.1 for the second group, (G3) a Gamma-distribution with scale parameter 0.4 and shape parameter 2.851 for the third group and (G4–G6) mixing distributions of all pair combinations of the first three survival functions for the last three groups.
The first three survival functions are illustrated in Figure 1. We note that preliminary simulations for more crude scenarios with identical survival distributions in all groups exhibited a much better type-I-error control of our testing procedure (results not shown). Anyhow, the parameters of the above distributions were chosen in such a way that the nonparametric concordance effects of all groups are equal, i.e. p
i
= 0.5 for all i = 1,…, 6 (one-way) and Survival functions underlying the first three simulated sample groups.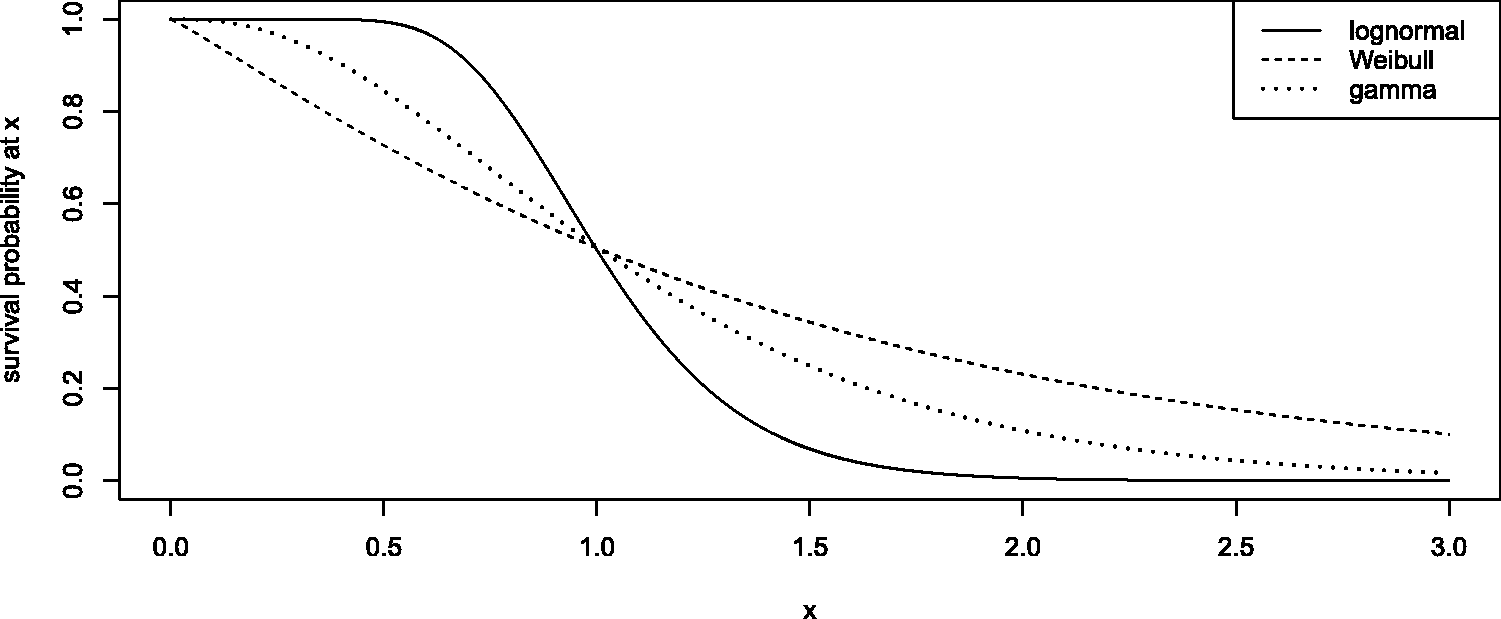
5.1.5 Simulations
We chose as wild bootstrap multipliers centered unit Poisson variables because a formal Edgeworth expansion and two simulation studies have indicated that those have theoretical and practical advantages over the common choice of standard normal multipliers. 48 We chose the nominal level α = 5% and conducted each test 10,000 times for K = 1, 2, and 3 and 5000 times for K = 5 and 10 because of the massively increasing computational complexity for large samples. Each test was based on critical values that were found using 1999 wild bootstrap iterations. All simulations were conducted with the help of the R computing environment. 49
5.1.6 Results
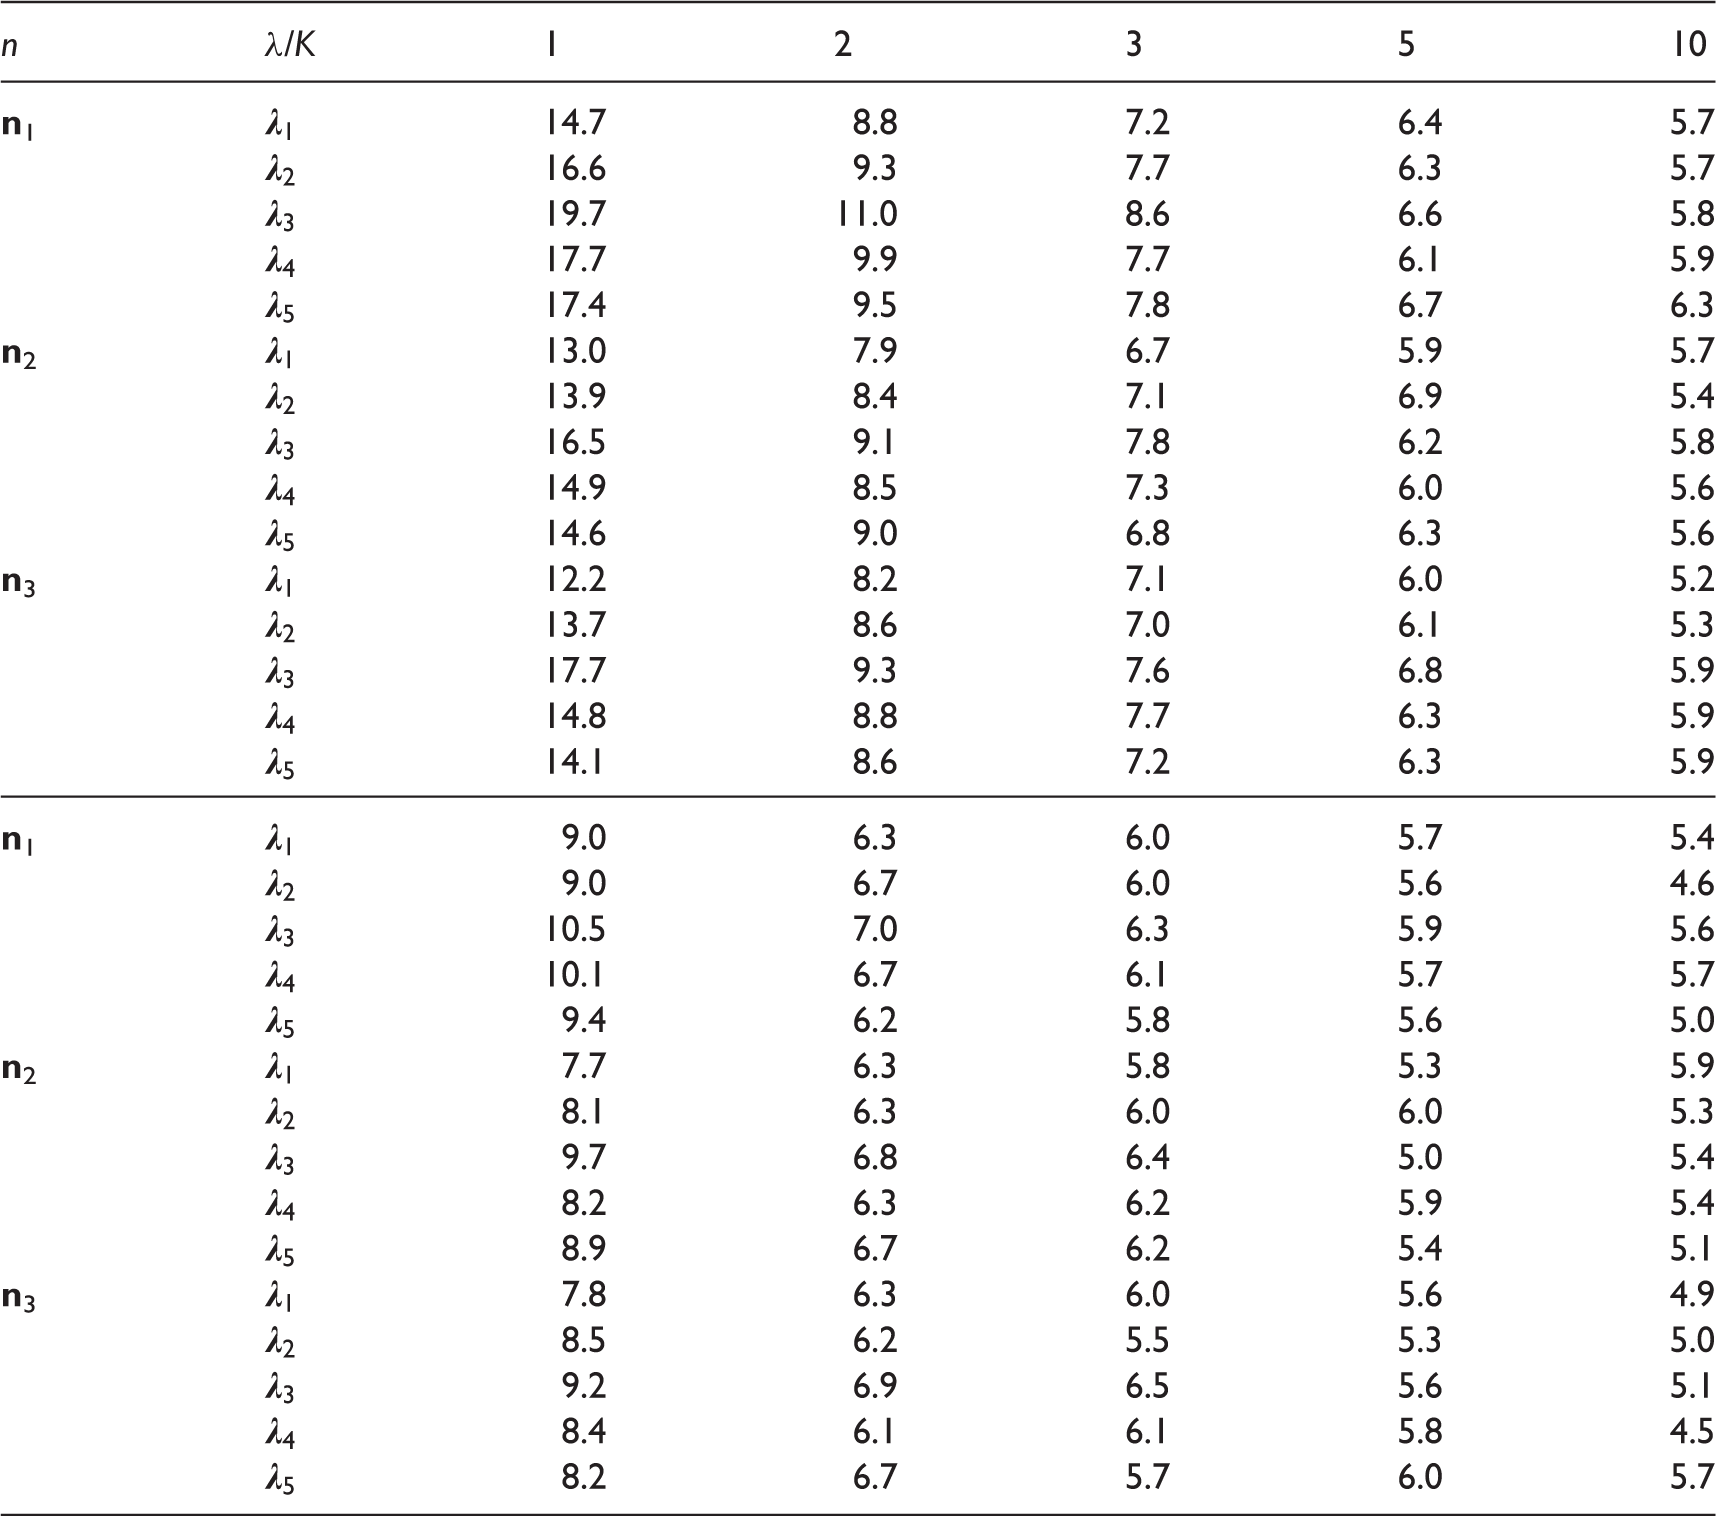
Simulated type-I-error probabilities in a one-way layout (upper) and in a two-way design for main effect A (lower) with sample size factor K.
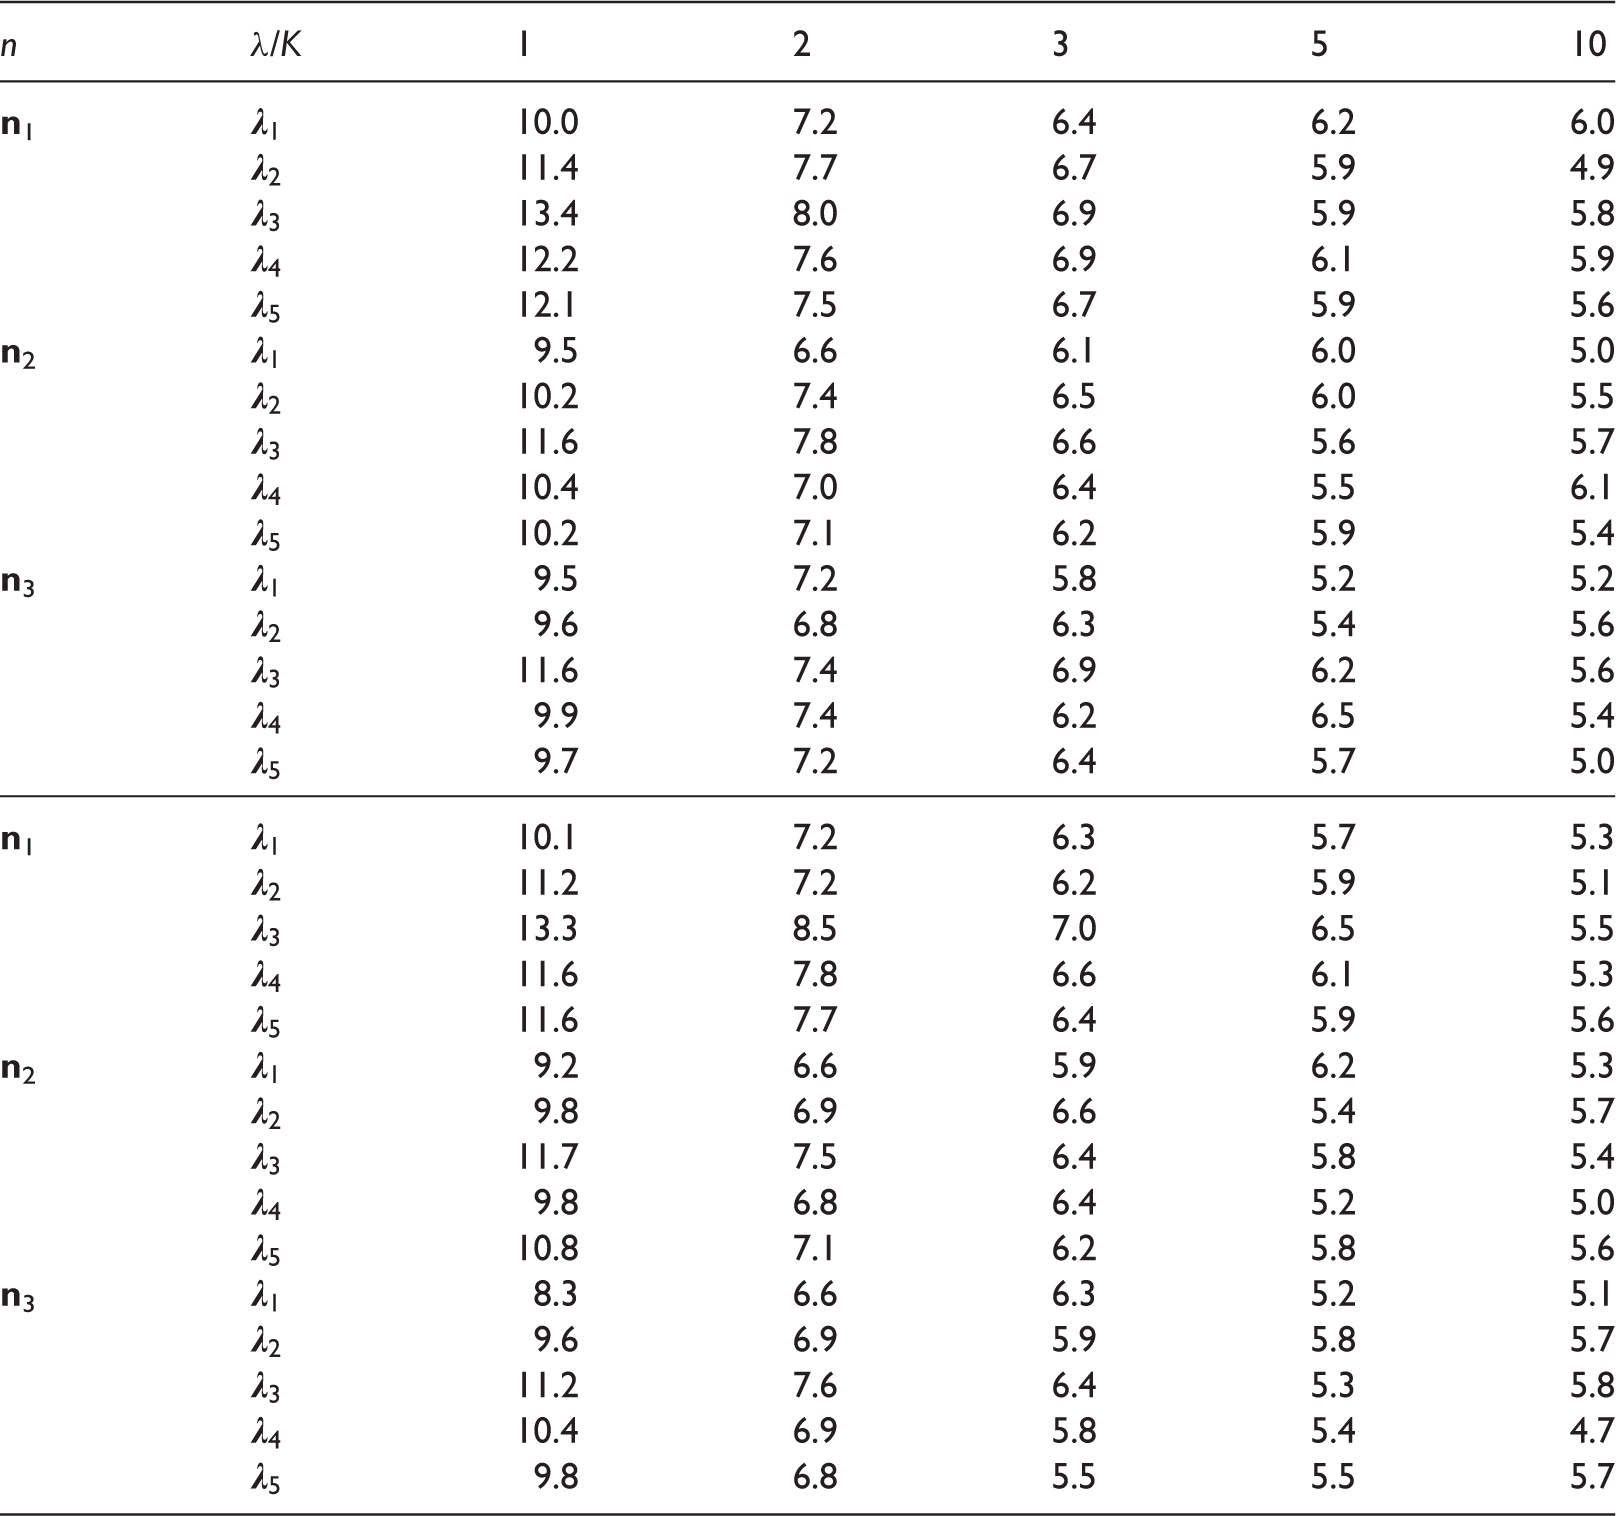
Simulated type-I-error probabilities in a two-way design for main effect B (uppper) and for interaction effect AB (lower) with sample size factor K.
5.2 Behaviour under shift alternatives
In addition to the simulations of the previous subsection, we also conducted a small power simulation of the above tests. For the alternative hypotheses, we considered a shift model: taking the same six basic survival and censoring functions as in the first set of simulations, we shift all survival and censoring times of the first sample group by δ ∈ {0.1, 0.2,…, 1}. In this way, we maintain the same censoring rates as before and the distance to the null hypotheses is gradually increased: for growing δ > 0, we obtain a growing relative effect p1 > 0.5 (one-way) and p11 > 0.5 (two-way), respectively. For each of the above considered contract matrices, Power functions for shift alternatives for different null hypotheses: in the one-way layout (sample sizes 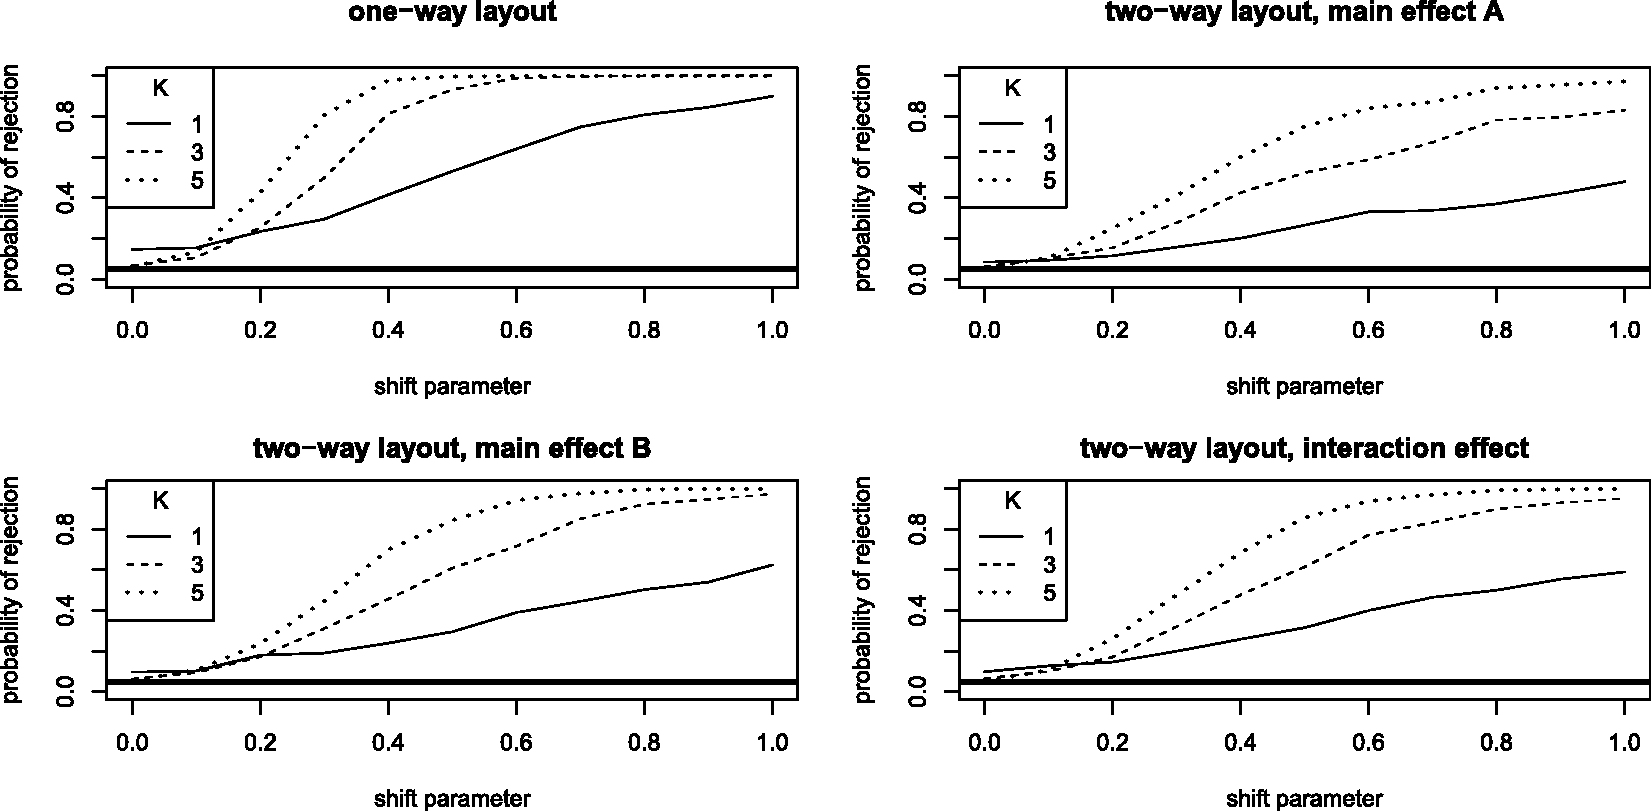
We see that, even for the smallest sample sizes (between 10 and 14), the power of the two-way testing procedures increase to 0.5 or 0.6 as the shift parameter approaches 1. For larger samples sizes, the theoretically proven consistency is apparent. In comparison, the one-way test has a much higher power: For the undersized case (K = 1), it already reaches a power of 0.8 while for moderate to larger sample sizes the power is almost 1 for shift parameters δ ≥ 0.5. In comparison to the two-way procedure, its superior power is, however, partially paid at the price of its pronounced liberality; especially for small sample sizes.
All in all, the simulations confirm that all tests have a satisfactory power with increasing sample size and/or shift parameter while maintaining a reasonable control of the nominal level for sample sizes of 30 to 42 already.
6 Data example
We illustrate the developed theory on a dataset from a colon cancer study.
39
Considering the patients in Stage C, that is, there had been metastases to regional lymph nodes, the data consist of eligible 929 patients suffering from colon cancer. Survival (measured in days) was the primary endpoint of the study. We focus on the two factors ‘gender’ and ‘treatment’ (with three levels) to obtain a crossed 2 × 3 survival design which is in line with a setting from our simulation study. In particular, there were 315 patients in the observation group, 310 others were treated with levamisole, and 304 received levamisole, combined with fluorouracil. Levamisole was originally used as an anthelmintic drug and fluorouracil (5-FU) is a medicine to treat various types of cancer. The patients in the study had been randomized into one of these three treatment groups. Also, there were nearly as many women (445) as men (484) involved in the study. Figure 3 depicts the Kaplan–Meier estimates of the survival probabilities for each treatment × sex subgroup. We refer to the article by Moertel et al. for more details about the study.
39
The dataset is freely accessible via the R command data( Kaplan–Meier estimators of male (left) and female subgroups (right panel), discriminated further according to treatment: obs = observation (—), lev = levamisole treatment (- -), lev+fluo = combined levamisole and fluorouracil treatment (…). The end time in the plot is τ = day 2173.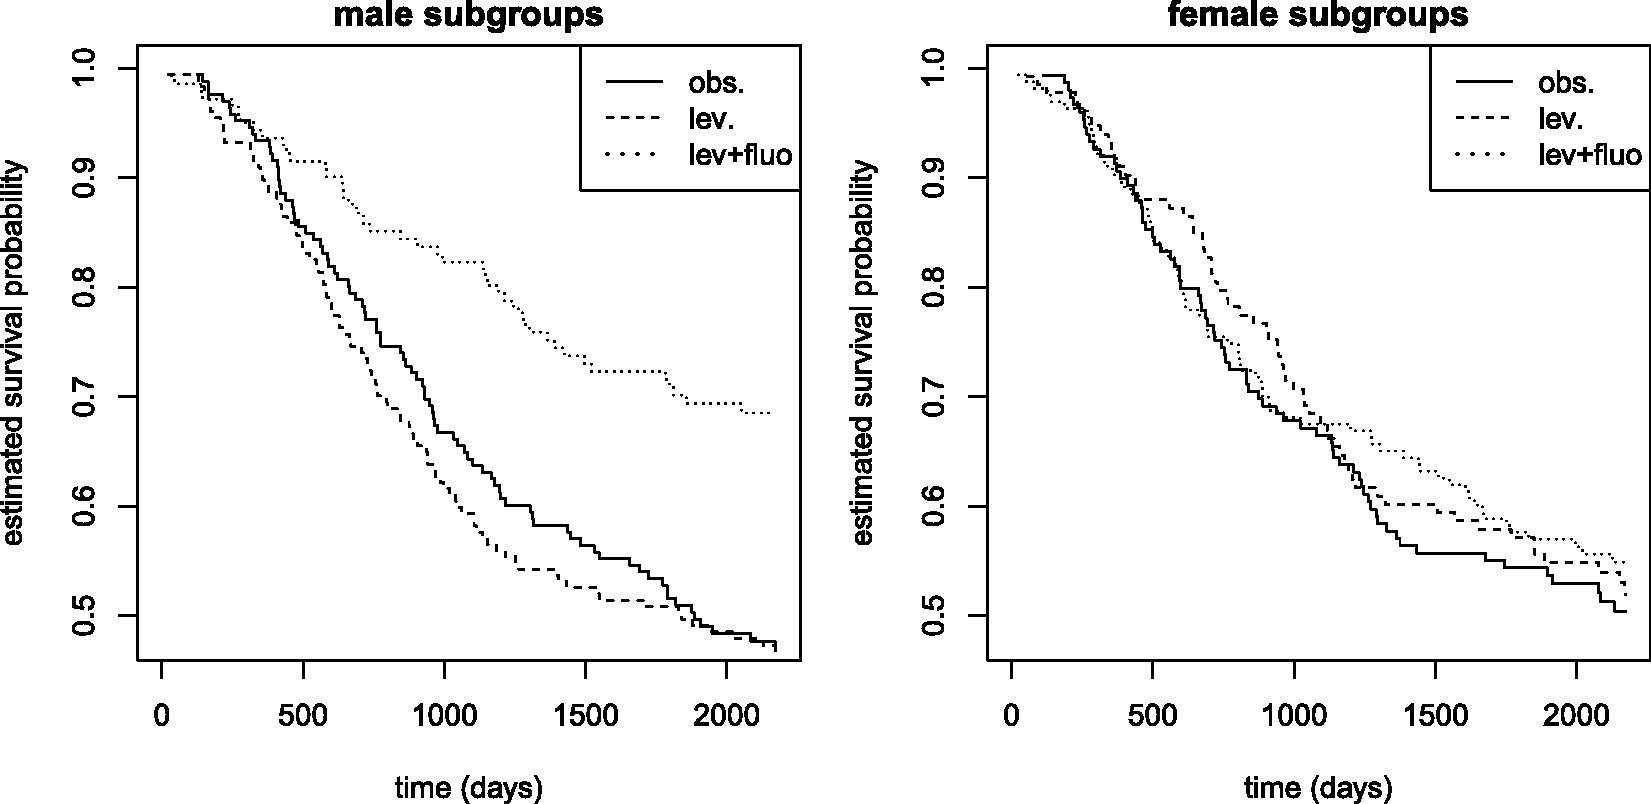
The aim is now to investigate the presence of main or interaction effects of treatment and gender. As there are several ties in the data (roughly 16%; see the supplement for details) and we do not want to impose specific distributional assumptions, we focus on the nonparametric concordance effects. To this end, we first have to choose a proper τ. From our retrospective view, the most reasonable choice is found by determining for each group the minimal observed censoring time that exceeds all observed survival times in that group. We call these censoring times “terminal times”. Then, τ is set to be the minimal terminal time. In doing so, the group with that minimum terminal time does not benefit nor does it suffer from having the earliest terminal time when compared to the other groups.
For each subgroup: sample size, smallest censoring time (in days) exceeding the largest survival time, censoring rate (in percentage) after taking the minimum of each event time and τ = 2173, and nonparametric concordance effect estimates.
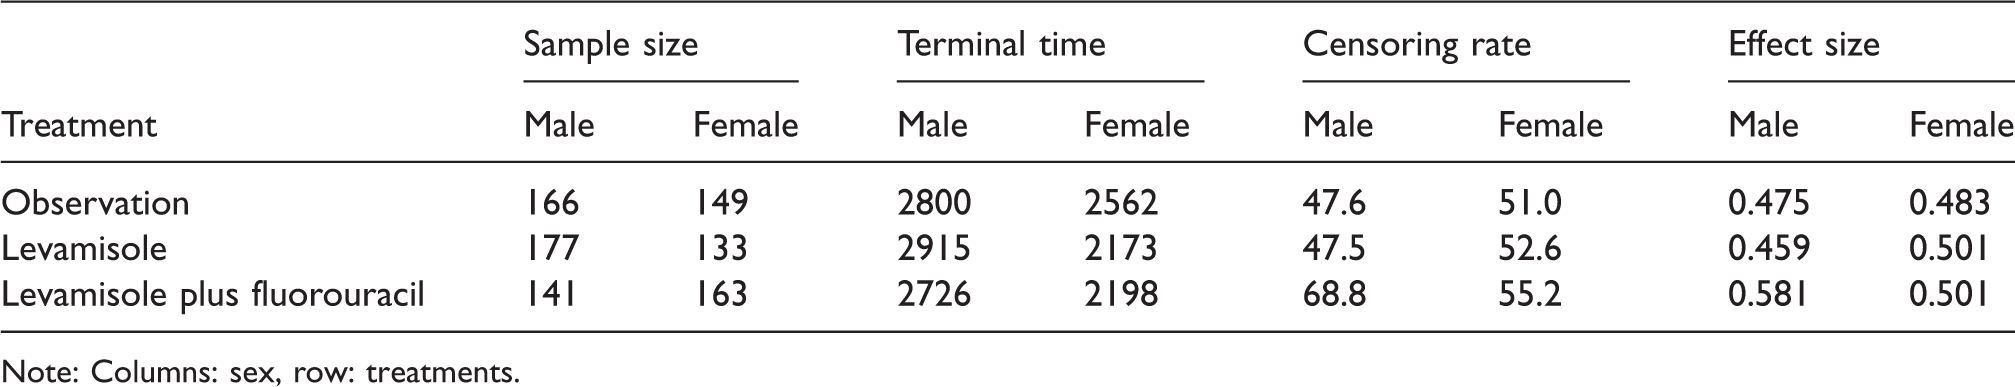
Note: Columns: sex, row: treatments.
p-Values of different hypothesis tests for the anaylsis of the colonCS data-set.
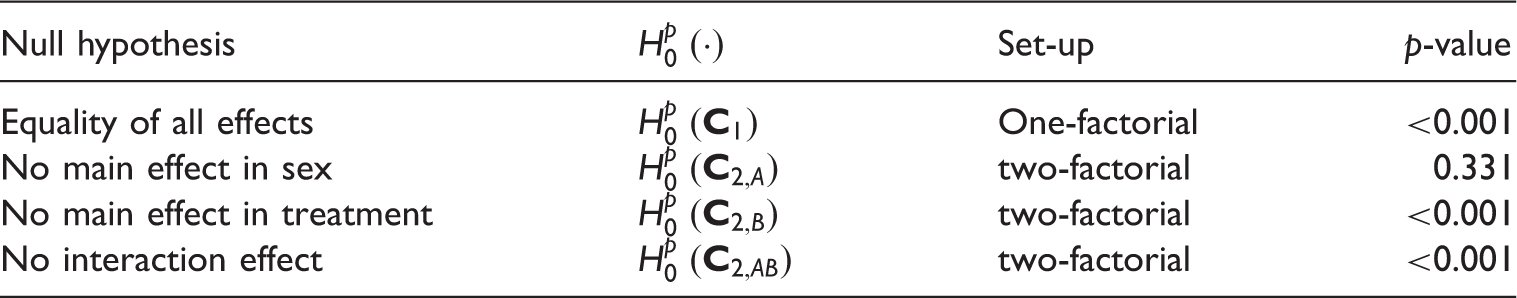
We found a significant indication against the equality of all d = 6 groups (p-value < 0.001). Judging from the main effects, this overall group difference may be explained by the significant treatment effect (p-value < 0.001) while no difference between the sexes (p-value = 0.331) were found. However, a significant interaction effect between treatment and sex (p-value < 0.001) make these conclusions uncertain. This is why we split the data by the factor sex and repeat the analysis for the female and male group within two separate 1-factorial 1 × 3 frameworks: Our hypothesis tests yielded p-values of < 0.001 for males and 0.49 for females, indicating a treatment effect for male patients only. Indeed, looking at the rightmost block of Table 3, we agree with the findings of the hypothesis tests: the gender effect seems to be canceled out if the treatment groups are combined, but within the male gender there seems to be a big difference in the concordance effects (
Taking another look at the Kaplan–Meier curves in Figure 3, we immediately see that our concordance effects and the test outcomes make sense. We clearly see that there is a big difference in the male survival probabilities (the combination treatment group is superior to the levamisole treatment group which is in turn superior to the observation group) but there is not much of a difference between the female groups' survival curves. Indeed, comparing the Kaplan–Meier curve of the pooled males' survival times with that of the pooled females' times, we graphically find no evident main gender effect. The plot of both Kaplan–Meier estimators is shown in the supplement.
As suggested by a referee, we compared the results of our nonparametric factorial analysis to the outcomes of a similar Cox model analysis while adjusting for ties in the event times. The coxph-method in the R-package survival offers the following three choices for adjusting for ties:
53
efron is the default coxph choice. It is quite accurate in case of a large number of ties. breslow is rather easy to implement and the default choice of many other program packages. exact is based on logistic regression and it is appropriate for a discrete time scale and a small number of unique event times. Furthermore, it is computationally quite expensive.
Parameter estimates, p-values, and 95% confidence intervals for the parameters in the Cox model.
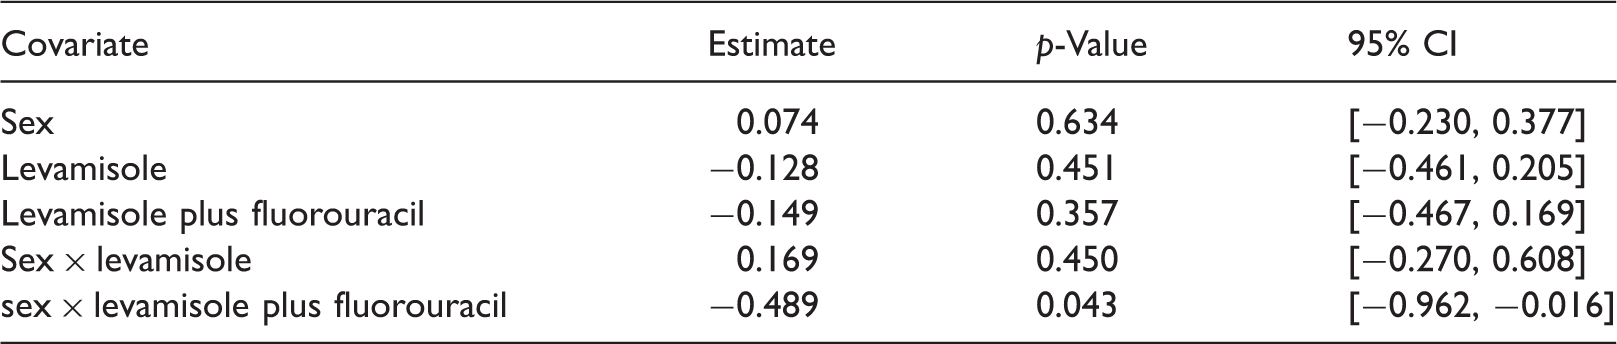
As explained above, the results need to be interpreted in comparison to the female observation group. We again see that the interaction effect of male gender and levamisole plus fluorouracil is significantly beneficial at level α = 5%. Also, the remaining point estimates of the parameters point towards the same direction as in the nonparametric analysis, but all of them are non-significant. Moreover, adjusting for the type-I-error multiplicity (by Bonferroni or Holm), no effect was detected at a significance level of 5%.
Our expert referee also suggested to perform a Cox analysis that matches our nonparametric one. To this end, we separately tested the presence of an interaction effect in the Cox model by using the parameter estimates related to the covariates sex × levamisole and sex × levamisole plus fluorouracil. Denoting the unknown interaction effect parameters by θ1 and θ2, we used the two-degree-of-freedom Wald test for testing
6.1 Comparison to the nonparametric analysis
The confidence intervals which resulted from the Cox analysis have to be interpreted on the log-hazard ratio level. This is much more complicated than on the level of probabilities of survival superiority, as in our nonparametric analysis. Also, these outcomes of the Cox analysis depend on the particular choice of the baseline hazard, which in this case refers to females from the observation group. Only the Wald tests for any interaction effect and for the treatment effect in the subgroup analyses are independent of the baseline reference subgroup. Our nonparametric method, on the other hand, always compares the single groups to the all-group average, which appears more natural in the present example.
Simultaneous confidence intervals for the concordance effects.
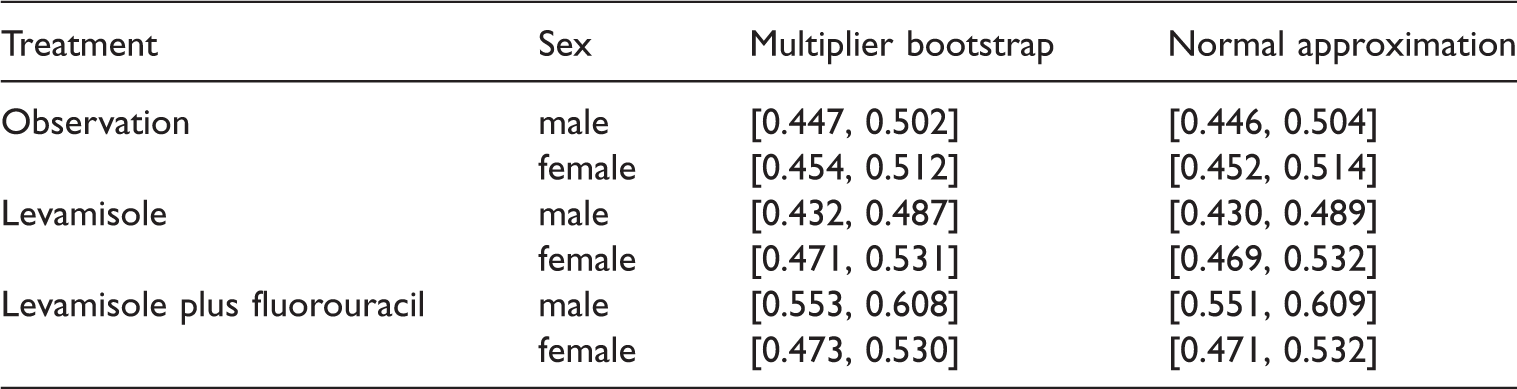
Here, we compare two different types of simultaneous confidence intervals both of which are asymptotically exact: those based on the multiplier wild bootstrap and those using equicoordinate quantiles18,42 of a multivariate normal distribution with estimated covariance matrix
Finally, we relate our results to the original findings of analyses that involve the Cox proportional hazards model and logrank tests. 39 It has been detected that “Therapy with levamisole plus fluorouracil produced an unequivocal advantage over observation” and that levamisole alone did not produce a detectable effect. Furthermore, they concluded from an exploratory subset analysis that the “levamisole-fluorouracil treatment appeared to have the greatest advantage among male patients […]”. This is exactly what we confirm in our nonparametric analyses. However, Moertel et al. apparently did not account for the ties which are present in the data nor did they clearly stress the rather weak effect of the levamisole-fluorouracil treatment for women. 39 They just state that their “results show […] striking contradictions to those of subset analyses reported in the NCCTG study, in which levamisole plus fluorouracil was found to be most effective in reducing the risk of recurrence among female patients […]” among other subgroups of patients.
7 Discussion
We proposed novel nonparametric inference procedures for the analysis of factorial survival data that may be subject to independent random right-censoring. Critical values are obtained from a multiplier wild bootstrap approach which led to asymptotically valid tests and confidence regions for meaningful effect parameters. Thereby, the procedures do not require any multiplicative or additive hazard structure nor specific distributional survival and censoring assumptions. In particular, different group distributions are allowed and ties are accounted for accordingly. Moreover, different to other nonparametric survival procedures,12,34 our methods are not only driven towards hypothesis testing but also to uncertainty quantification of the underlying effect estimators. The latter can be used to comprehensibly describe and infer main and interaction effects in general nonparametric factorial survival designs with an arbitrary number of fixed factors. Together with a 1–1 connection with hazard ratios in proportional two-sample designs 38 and the possibility to construct simultaneous confidence intervals for all nonparametric effects of interest, this makes the new methods appealing for practical purposes.
To investigate their theoretical properties, we rigorously proved central limit theorems of the underlying statistics and consistency of the corresponding procedures. In addition, extensive simulations were conducted for one- and two-way designs to also assess their finite sample properties in terms of power and type-I-error control. In case of small sample sizes with less than 10 completely observed subjects per group, they revealed a liberal behaviour; especially for the one-way testing procedure. However, for moderate to larger sample sizes, the asymptotic results kicked in and the stated theoretical results were recovered.
Finally, the methods were used to exemplify the analysis of survival data in a study about treatments for colon cancer patient within a two-factorial survival design. As severe ties were present in the data, classical hazard-based methods were not directly applicable and adjustments for ties were required. In comparison, our newly proposed nonparametric methods provided a very decent alternative for the analysis of such factorial survival designs without postulating any strict assumptions.
To allow for a straightforward application, it is planned to implement the procedure into an easy to use R-package. In future research, we will consider the case of stochastically ordered subgroups, for which a multiple testing algorithm could be developed with the aim to detect significantly different collections of all subgroups: subgroups with no significant differences in the nonparametric concordance effects may be combined to facilitate the interpretation of the outcomes and to ultimately serve for the development of different, more personalized medicines, one for each new subgroup combination. Moreover, extensions of the current methodology to ordered alternatives or factorial designs obtained via stratified sampling will be part of a practically useful consecutive testing procedure. Another future research topic covers the question on how to develop comparable procedures for causal inference in general factorial finite population models. Here, the non-identifiability problem of effect measures 54 has to be resolved accordingly.
Supplemental Material
Supplemental material for Factorial analyses of treatment effects under independent right-censoring
Supplemental Material for Factorial analyses of treatment effects under independent right-censoring by Dennis Dobler and Markus Pauly in Statistical Methods in Medical Research
Footnotes
Acknowledgements
Both authors would like to thank two referees and the editor whose help has substantially improved the manuscript.
Declaration of conflicting interests
The author(s) declared no potential conflicts of interest with respect to the research, authorship, and/or publication of this article.
Funding
The author(s) disclosed receipt of the following financial support for the research, authorship, and/or publication of this article: Markus Pauly wishes to thank for the support from the German Research Foundation (Deutsche Forschungsgemeinschaft).
Supplementary Material
Supplemental material for this article is available online.
References
Supplementary Material
Please find the following supplemental material available below.
For Open Access articles published under a Creative Commons License, all supplemental material carries the same license as the article it is associated with.
For non-Open Access articles published, all supplemental material carries a non-exclusive license, and permission requests for re-use of supplemental material or any part of supplemental material shall be sent directly to the copyright owner as specified in the copyright notice associated with the article.