
Abstract
Through N-dimensional person space, the article gives measures of test parameters and item statistics, including difficulty/discriminating value of test, correlations between a pair of items, and item-total correlations with binary items using angular similarity between two vectors. Relationships between difficulty value and discriminating value of items and test were derived, including relationship between test reliability and test discriminating value. Reliability of a test as per theoretical definition in terms of length of score vectors of two parallel subtests and angle between such vectors was derived. The method was extended to find reliability of a battery of tests. Reliability and discriminating value of a Likert-type item and scale was found in terms of angular similarity without involving assumptions of continuous nature or linearity or normality for the observed variables, or the underlying variable being measured. The proposed methods also avoid test of unidimensionality or assumption of normality or bivariate normality associated with the polychoric correlations. Thus, the proposed methods are in fact nonparametric and considered as improvement over the existing ones. Reliability as a measure of association of two vectors and discrimination as a measure of distance between the vectors are likely to show a negative relationship.
Introduction
It is common to consider the variables as orthogonal axes and performance of individuals as points in the Euclidean space defined by the axes. However, it is possible to treat each person as an axis and represent the variables as points or vectors in the Euclidean space. This type of presentation is called “subject space” or “person space” or “N-dimensional person space” for N-persons. Such presentation has been considered by Reyment and Joreskog (1993), Huberty (1994), Chong et al. (2002), and so on. The orthogonality of the axes is an accurate indication if the persons are assumed to be independent of one another. Chong et al. (2002) observed that vectors representing latent factors rotate in subject space rather than variable space. In regression analysis, eigenvalues can be conceptualized as subject space equivalent to variance inflation factor (VIF). The concept of subject space can also be used as a means of visualization of spatial relationships. Glass and Collins (1970) dealt with three variables in N-dimensional subject space to find possible values of
If N-persons take a test, then the observed test scores can be viewed as a point or a vector in N-dimensional space. Once a person has taken a test, he or she is not considered to take the test again. Thus, a person axis is not overlapped. The angle θ between the two N-dimensional vectors
This type of presentation helps to make useful inferences about the sample as well as computation of various parameters of the test, along with geometrical interpretation of such computations. It is possible to give theoretical formulation of mental testing through N-dimensional person space primarily in terms of the length of the observed score vector, angle separating the vector with the vector representing the maximum possible score in the test. For item statistics, the corresponding two vectors will be item score vector and the vector for maximum possible item score with each component equal to unity for a binary item.
For a test consisting of binary items (1 for right answer and 0 for others), the article attempts to provide geometric visualization along with computation of parameters of the test and item statistics, including test error variance and thereby the test reliability, as a ratio of true score variance and observed score variance, via a single administration of the test under classical test theory. Thus, the approach is an improvement as it enables calculation of theoretically defined reliability despite the fact that true scores of individuals taking the test are not known. Subsequent to the determination of the error variance of the test, test reliability method is extended to find reliability of a battery of tests. The approach can be extended for Likert-type test.
Methodology
The setup for test consists of binary items.
Suppose a test consisting of n-binary items has been administered among N-subjects. Scores obtained by the subjects can be presented as a point or vector
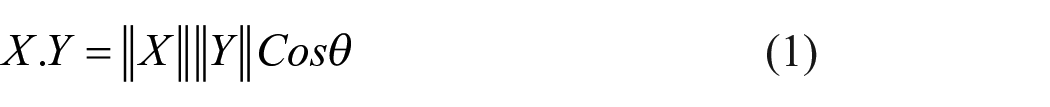
Dot product
Dot product of two N-dimensional vectors
where
Note that
X.Y = Cos θ if X = Y = 1
||X + Y|| ⩽ ||X|| + ||Y|| (Triangle inequality)
X.Y ⩽ ||X||||Y|| (Schwarz’s inequality)
Ranks of individuals
Arranging the components of the vector
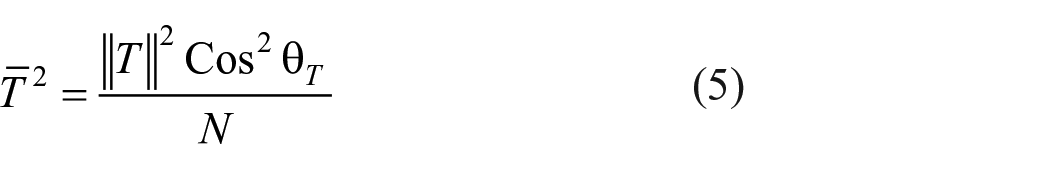
Mean
Let
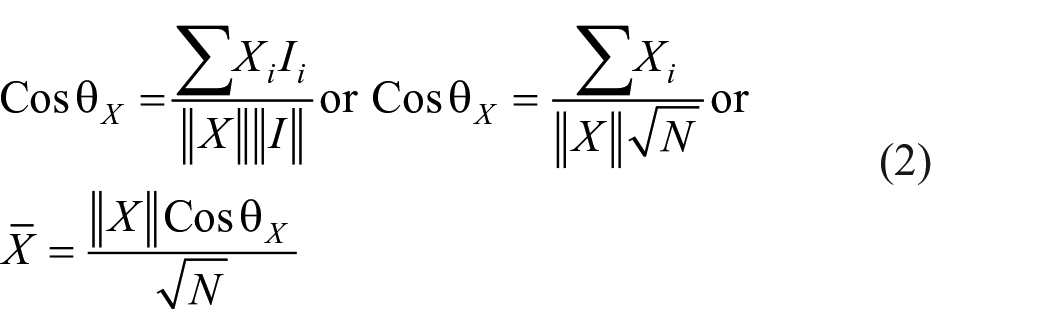
Thus, test mean is equal to the product of length of the score vector and cosine of the angle between the score vector and the ideal vector divided by square root of sample size.
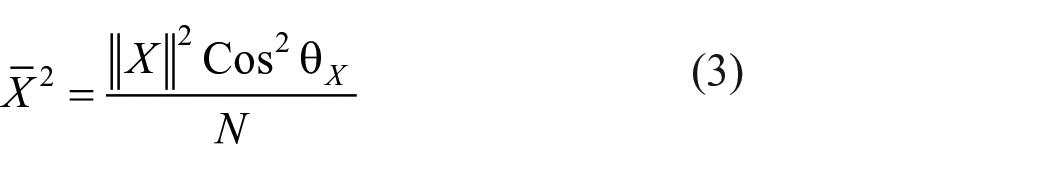
From equation (2)
Similarly
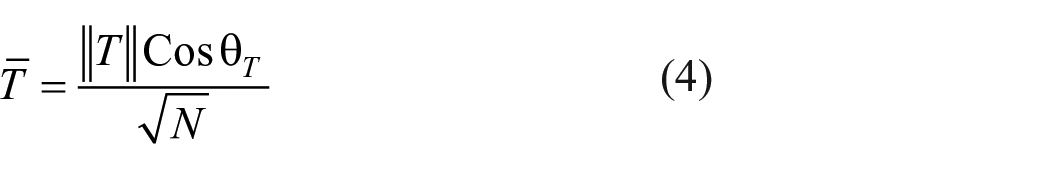
and
Since,
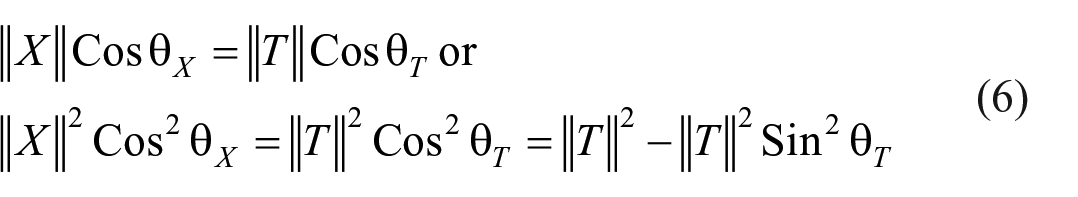
Equation (6) helps to find
Equating (3) and (5), we get
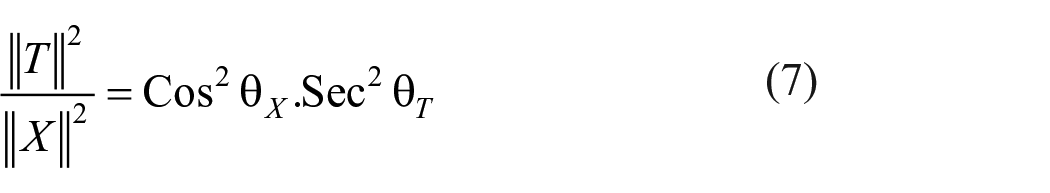
which gives relationship between
Let
Variance
Test variance or observed score variance can also be obtained from N-dimensional person space by
Alternatively,
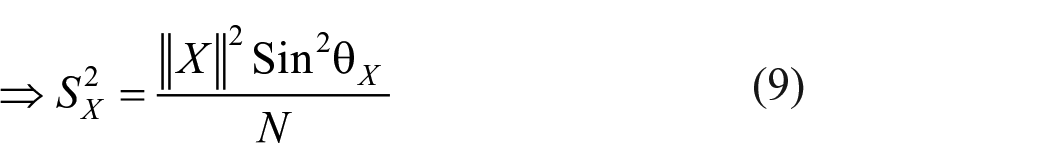
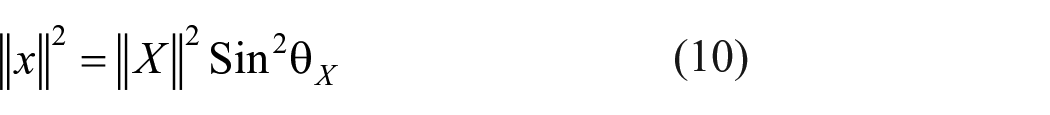
Thus, standard deviation (SD) of test score is the product of the length of the score vector and sine of the angle between the score vector and the ideal vector divided by the sample size.
Thus, the relationship between x and X is given by
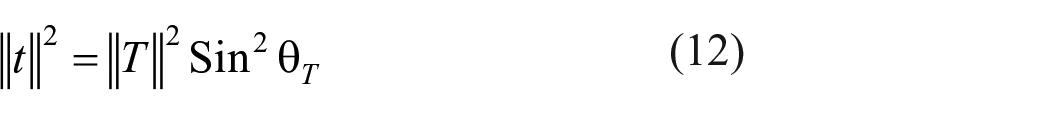
Similarly, true score variance is obtained
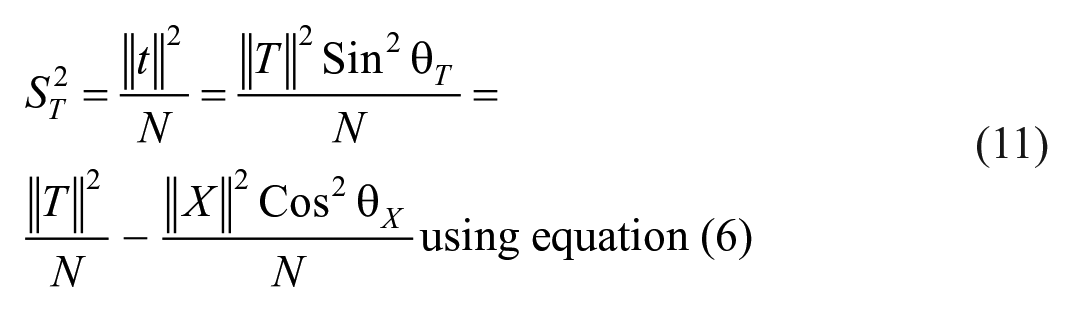
Equation (11) helps to find value of true score variance of a test from the data if the length of true score vector is known, and
Now
Correlations
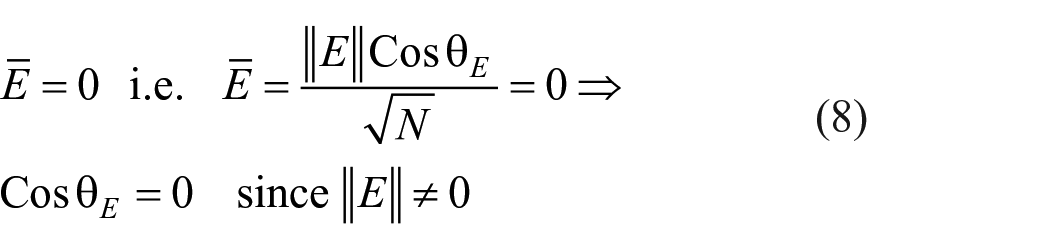
One assumption of classical test theory is

One may also write
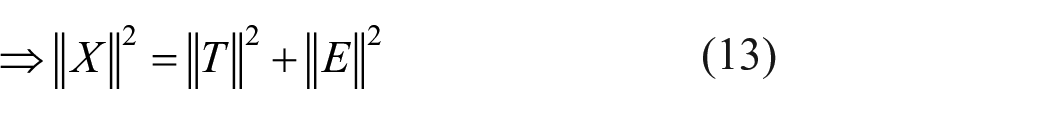
Thus
So variance–covariance matrix of observed score (X), true score (T), and error score (E) of a test is
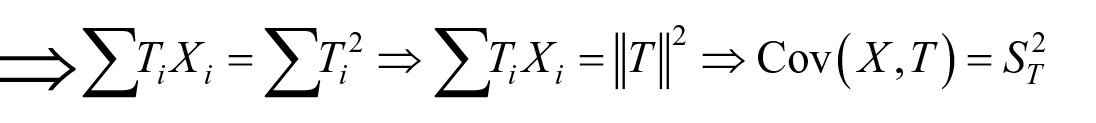
It is well known that correlation between X and T is given by
Now,
And
Thus
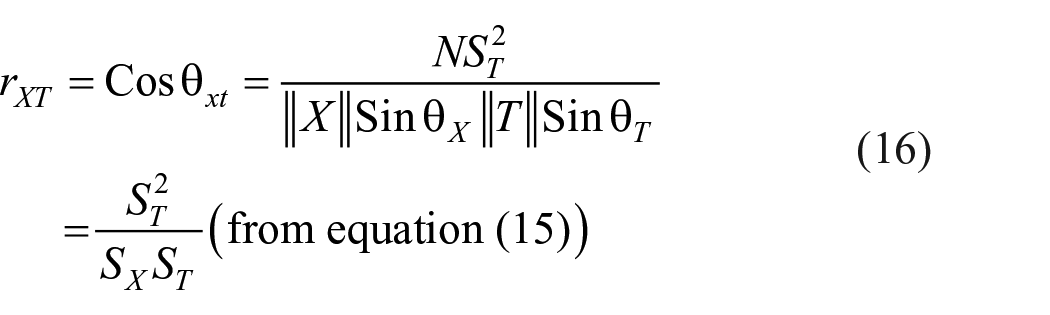
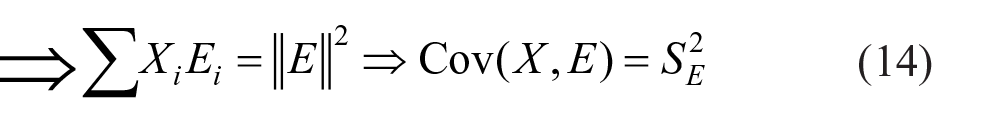
But
Therefore
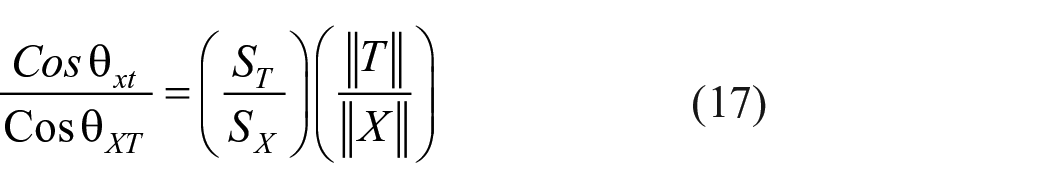
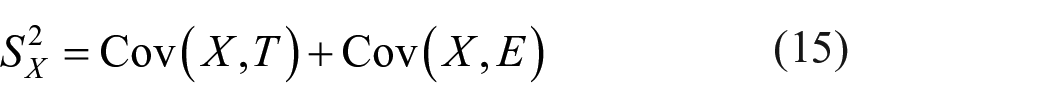
Equation (17) gives the relationship between
Note that
Value of
Value of
Equations (15) to (17) each involves unknown quantity and thus does not help to compute directly
Reliability and parallel tests
A test consisting of n-items when dichotomized in parallel halves say gth subtest and hth subtest results in two points
Also,
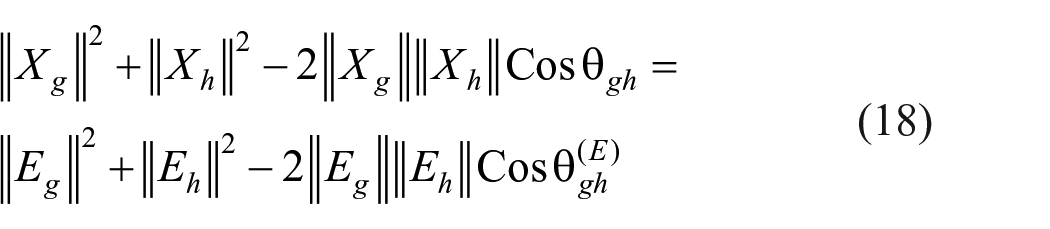
where
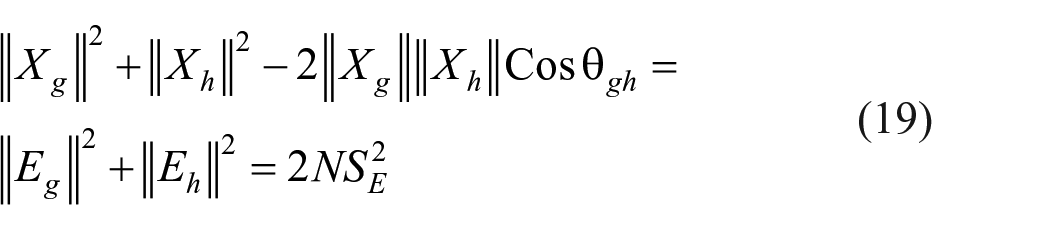
since
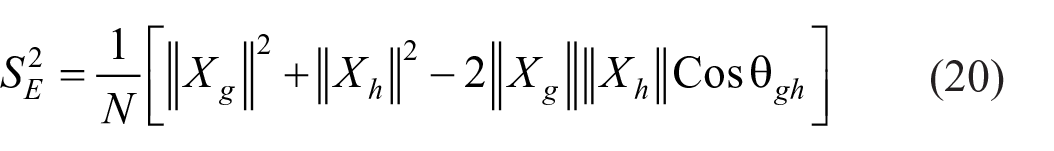
Hence
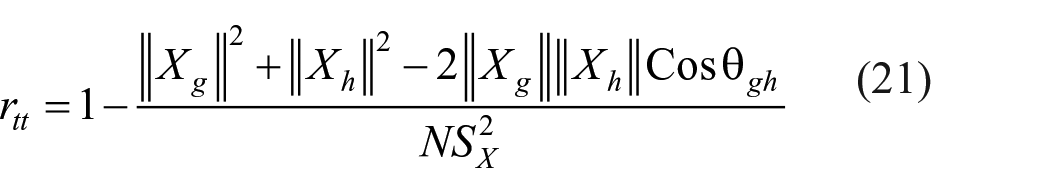
Equation (20) helps to find value of error variance of the test and hence true score variance as
Note that while equation (21) finds reliability
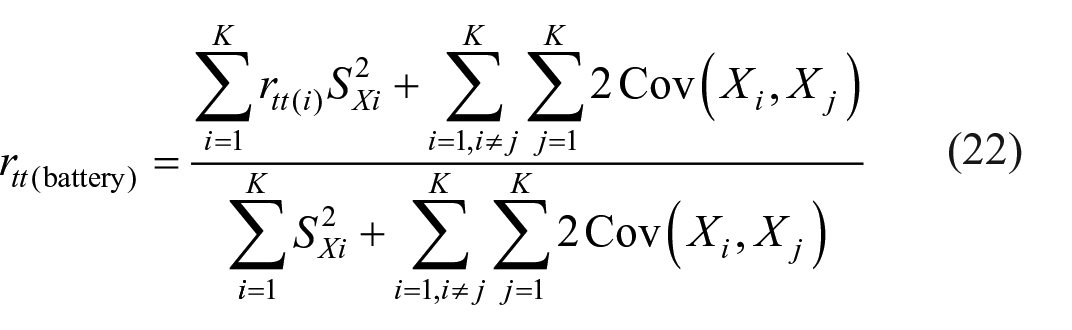
The approach of finding reliability as per definition can be extended to find reliability of a battery of tests aiming to measure a finite number of variables. After administration of the battery to N-individuals, values of
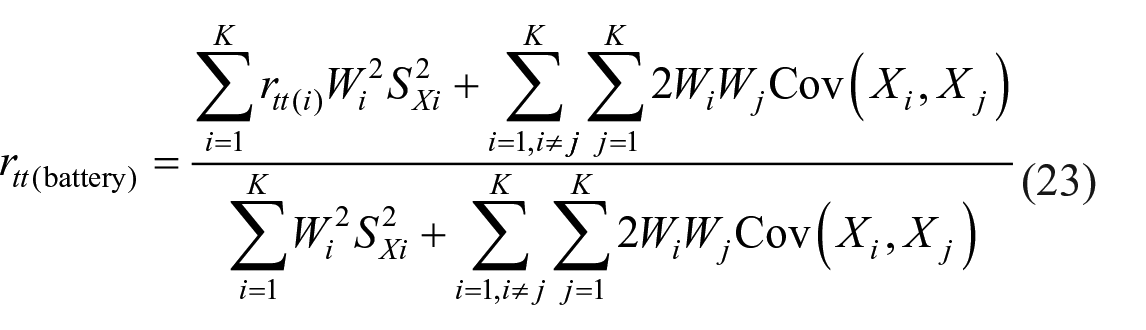
If battery score is taken as sum of score of K-tests (summative score), it can be proved that
If
Clearly,
Validity
Usual procedure of obtaining validity of a test is to find correlation of the test score (
Item statistics for test consisting of binary items
Difficulty value of a test
If
Accordingly, difficulty value of a test D may be defined as
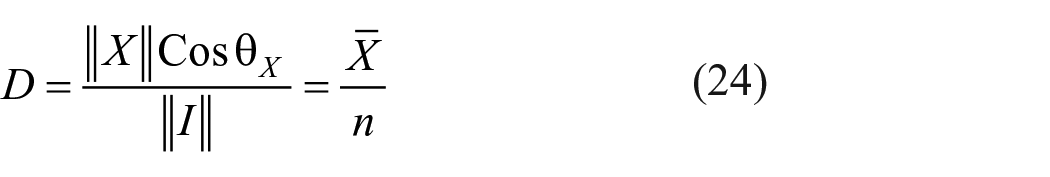
Note that equation (24) defines difficulty value of a test as ratio of product of length of the observed score vector andcosine of the angle between the observed score vector and the ideal vector as the numerator and length of the ideal vector as the denominator, keeping harmony with the usual notion of difficulty value of a test which actually measures degree of easiness of a test. It can be proved that 0 ⩽ D ⩽ 1.
Item difficulty value
In the N-dimensional person space, scores of an item may be characterized by an N-dimensional vector whose components are 0s and 1s. For an item, the vector
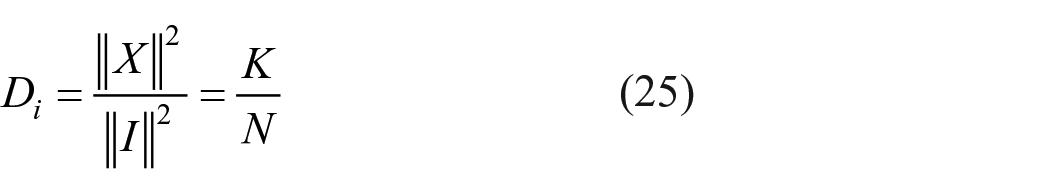
Clearly, 0 ⩽ Di ⩽ 1. It may be observed that difficulty value of an item as per equation (25) in terms of ratio of square of length of the observed score vector and square of length of the ideal vector coincides with normal idea of proportion of persons passing an item.
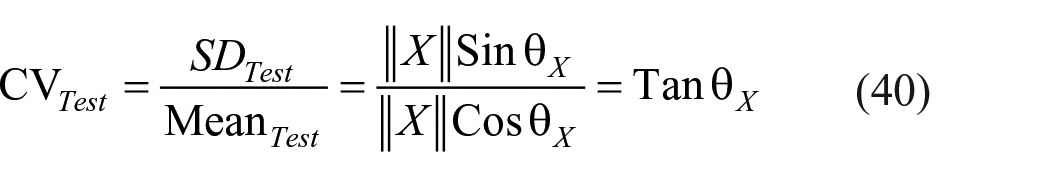
Discriminating value of a test
If the vector
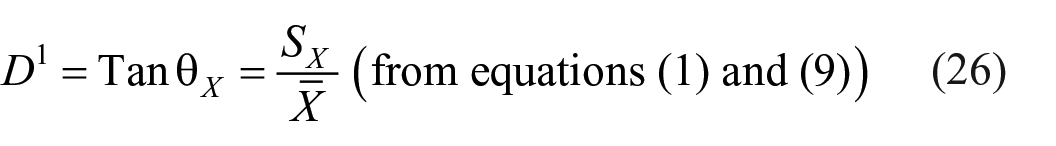
where
Thus, discriminating value of a test equals to tan of the angle between observed score vector and ideal vector which is the ratio of SD and mean of the test score. In other words, discriminating value of a test is a linear function of its coefficient of variation (CV), a well-known measure of relative precision which is independent of change of scale but not of origin.
Discriminating value of an item
The method also helps to find discriminating value of an item as follows

where
Note that this method of finding discriminating value of an item does not consider total test score. The method considers entire data relating to the item and avoids consideration of top 27% and bottom 27% of data. However, item discriminating value tends to be lower for tests measuring different content areas and cognitive skills.
Evaluation of Tan θX
For the ith item, the components of a vector
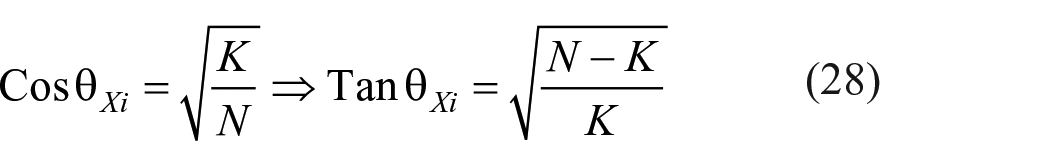
Note that
1. The discriminating value of an item is equal to the ratio of SD of the item score and mean of the item score, and can exceed unity. It is a function of CV.
2. If K = 0, that is, if all the subjects fail in an item, then discriminating value is not defined for the item.
3. If K = N, that is, if all the subjects pass an item, then discriminatory value is zero for that item.
4. It can be shown that square of discriminating value of an item is equal to reciprocal of difficulty value minus one. That is
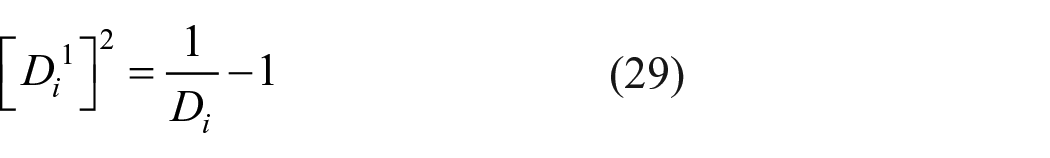
Equation (29) gives the non-linear relationship between difficulty value and discriminating value of items.
5. Relationship between difficulty value and discriminating value of a test can be found as follows

Thus, product of difficulty value and discriminating value of a test is equal to SD of the test divided by the number of items.
Relationships between test reliability and discriminating value of a test
Since
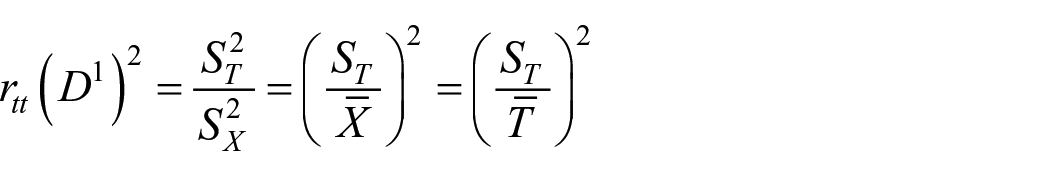
Thus, product of test reliability and square of test discriminating value is equal to square of CV of true scores. However, verification of the relationship may require finding test reliability as per the definition, which is described in equation (21).
Item correlations
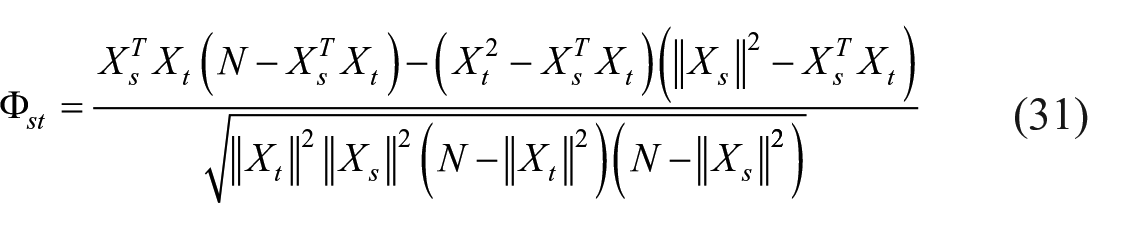
Phi coefficient
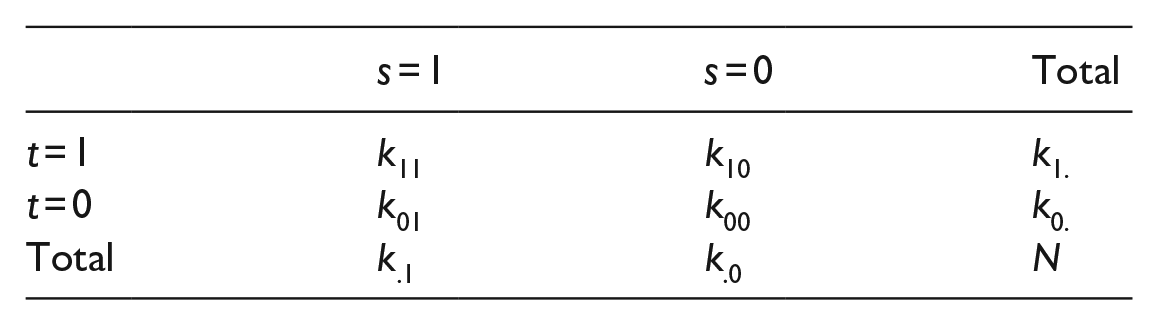
Correlation between two items can also be viewed through N-dimensional person space. Let
The number of persons who failed to answer correctly both the items is
Thus, each term of the formula for
Item-total correlations
Point-biserial correlation coefficient
Let
Now
Here
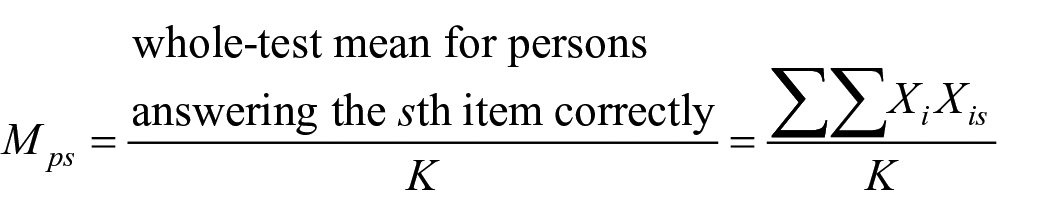
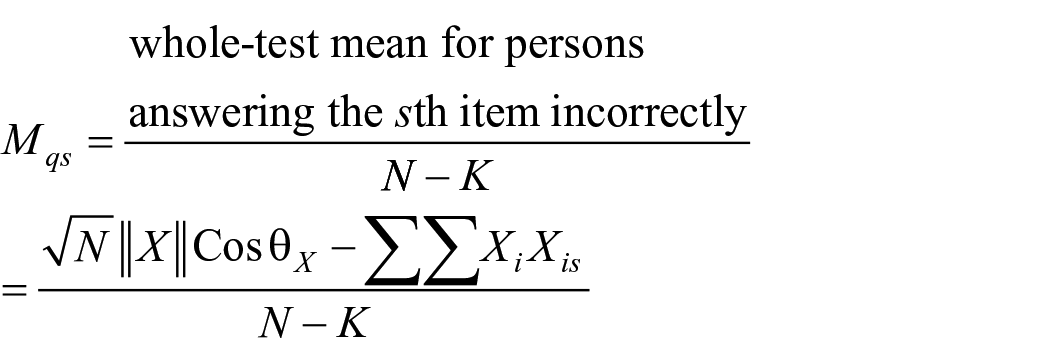
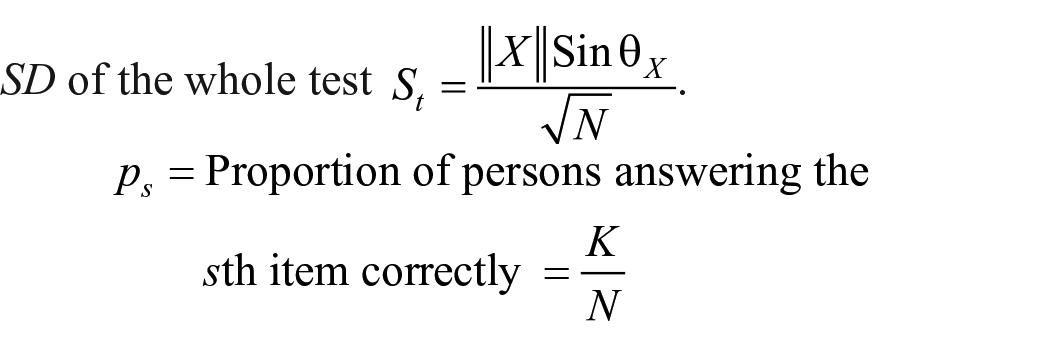
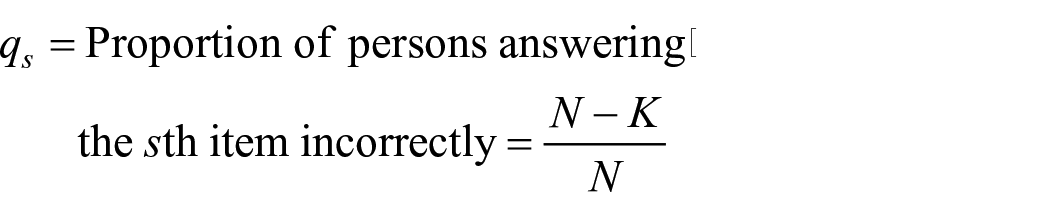
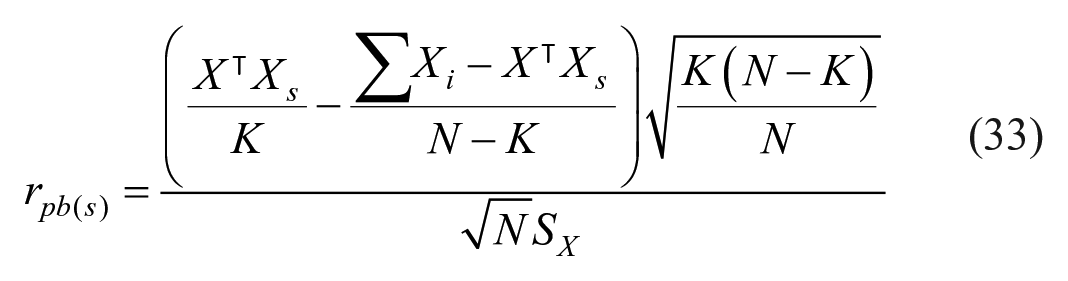
Thus, point-biserial correlation between the sth item
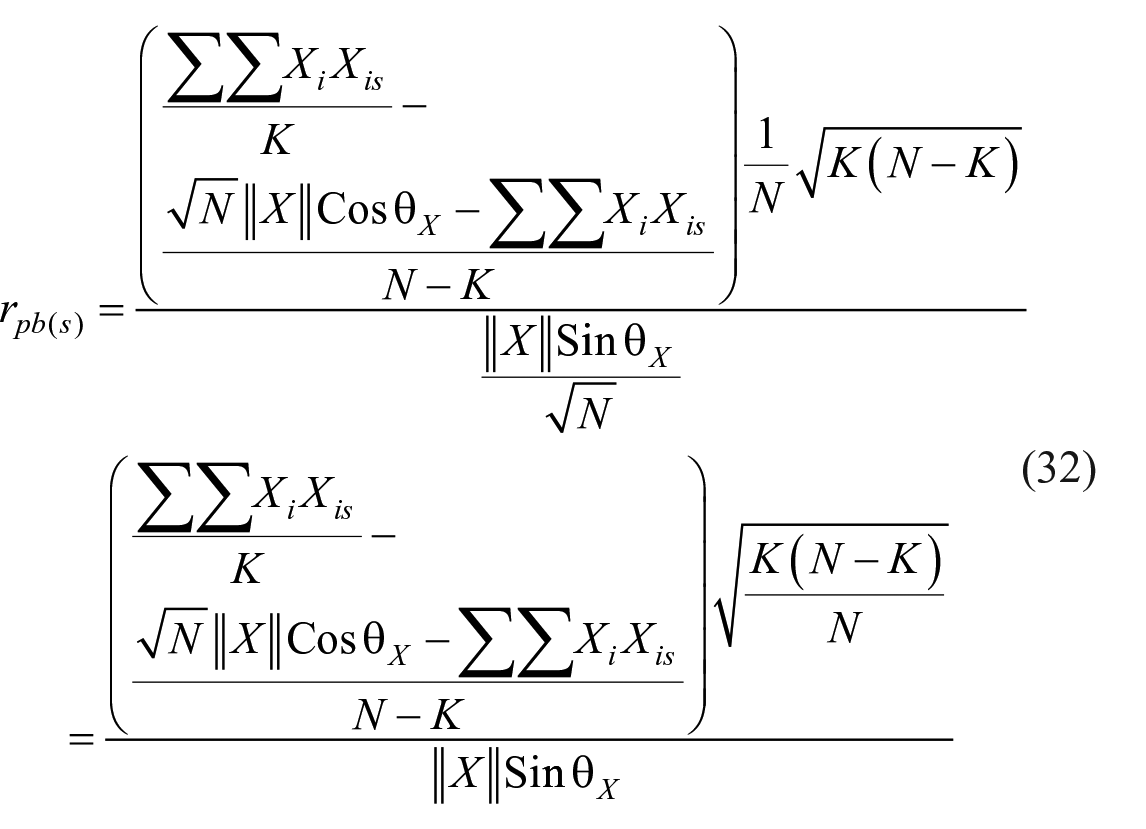
This may be simplified further as
Item reliability
In addition to item difficulty and item discrimination, the concept of item reliability is also used in item statistics. Item reliability is defined as a product of SD of item scores and a correlational discrimination index, usually item-total correlation. Thus, reliability of the ith item could be taken as
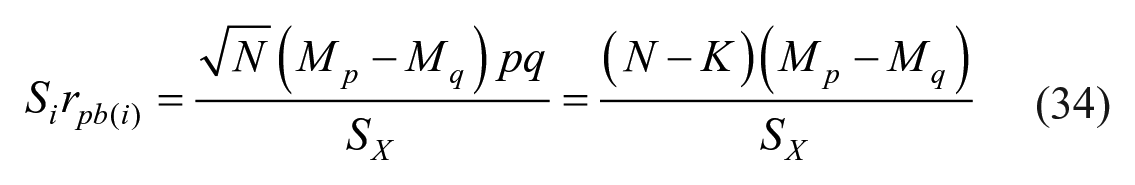
where
Higher values of item reliability are desirable. If two items have equal item discriminating value, then the item with higher variance is preferred to be retained.
Likert-type test
Background
Suppose n-respondents have answered each of the m-items of a Likert-type questionnaire, where each item has k-numbers of response categories, marked as
Note
After administration of the questionnaire to n-respondents, we can calculate empirical probabilities of each response categories of the ith item as
Reliability of an item can be measured as cosine similarity between
Measure for reliability of Likert-type test
Chakrabartty (2018) proposed two nonparametric methods of finding reliability of Likert-type scale and items considering only the frequency or proportion for each cell of the item-response category matrix without involving any assumptions of continuous nature or linearity or normality for the observed variables, or the underlying variable being measured.
Cosine similarity between ith and jth item is
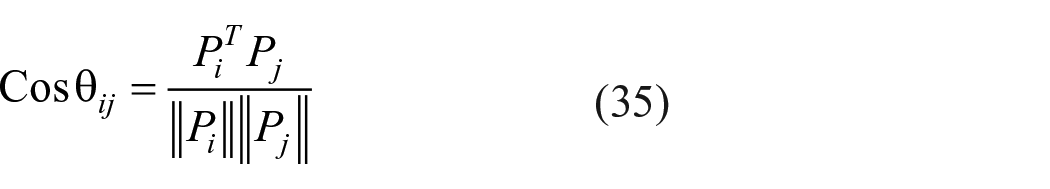
where
Item reliability in terms of correlation between the ith item score and total score can be obtained by
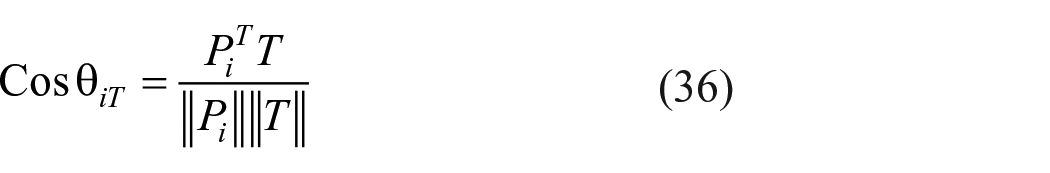
where
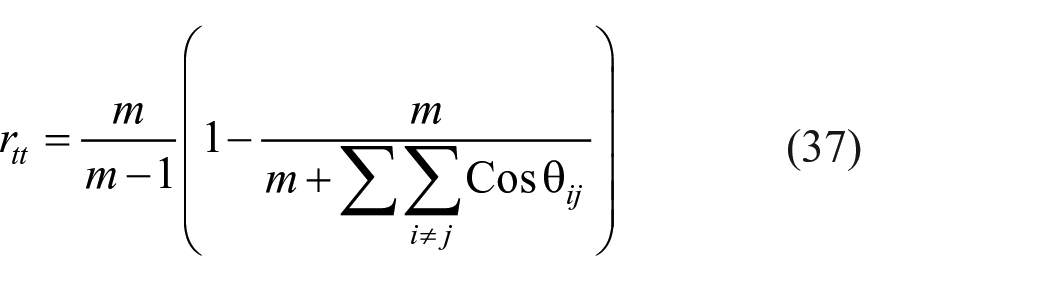
Test reliability with m-items was found by replacing the polychoric correlation between items i and j by
For Bhattacharyya’s similarity, each vector
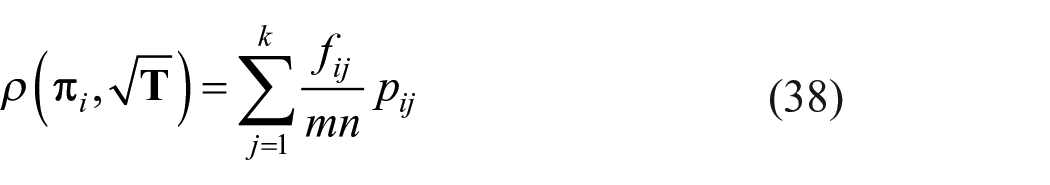
and test reliability was taken as
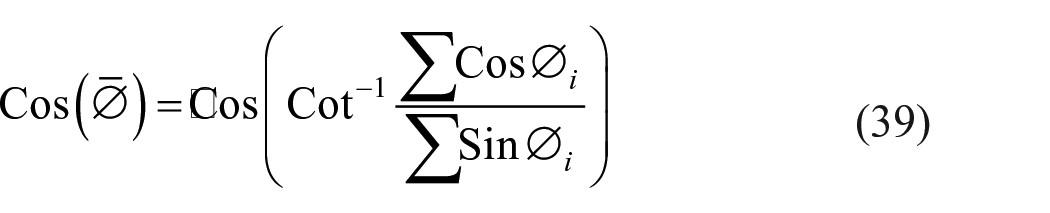
where ∅ denotes mean or most preferred direction among the angles
Each method enables to find reliability irrespective of distribution of the observed or underlying variables and avoiding test of unidimensionality or assumption of normality for Cronbach’s alpha or bivariate normality for polychoric correlations. Bhattacharyya’s similarity helps to find range of reliability of the entire Likert-type scale.
Discriminating value of Likert-type item and Likert-type scale
The concept of CV as a measure of discriminating value of a binary item can be extended to find discriminating value of a Likert-type item with multi-response alternatives and define
If
CV is a well-known measure of relative precision which is independent of change of scale but not of origin. Note that
non-negative if response categories are marked with positive numbers;
defined even if
CV = 0 ⇔ either
Di = Dj ⇔ Pi = PJ;
possible to express
shown that estimate of population CV is
shown that statistical inferences for CV for normally distributed data are often based on McKay’s
Findings and conclusion
Through N-dimensional person space, measures of test parameters and item statistics including difficulty value, discriminating value of test, Phi coefficient to depict correlations between a pair of items, and point-biserial correlation to depict item-total correlations with binary items were presented using angular similarity between two vectors and considering the entire data. Non-linear relationships between difficulty value and discriminating value of items and test were derived, including relationship between test reliability and test discriminating value.
Dichotomization of the test in parallel halves helps to find value of error variance, true score variance, and reliability of a test as per theoretical definition from a single administration in terms of length of score vectors of two parallel tests and angle between such vectors. The method was extended to find reliability of a battery of tests.
Reliability and discriminating value of a Likert-type scale and Likert-type item were found in terms of angular similarity using only the permissible operations for a Likert-type scale, that is, frequencies or probabilities of item-response categories without involving assumptions of continuous nature or linearity or normality for the observed variables, or the underlying variable being measured. Thus, such reliabilities and discriminating value are in fact nonparametric. The proposed methods also avoid test of unidimensionality or assumption of normality or bivariate normality associated with the polychoric correlations. Thus, the proposed methods are considered as improvement over the existing ones.
Reliability as a measure of association of two vectors and discrimination as a measure of distance between the vectors are likely to show a negative relationship. Further studies may be undertaken to facilitate comparison of the proposed methods.
Footnotes
Declaration of conflicting interests
The author(s) declared no potential conflicts of interest with respect to the research, authorship, and/or publication of this article.
Funding
The author(s) received no financial support for the research, authorship, and/or publication of this article.