
Abstract
The introduction of experience research using smartphone applications has enabled researchers to explore previously uncharted territories within the social science landscape. The use of experience research methodologies may both avoid some of the biases associated with conventional survey methods and enable researchers to gather information on situational dimensions of different outcomes. While existing smartphone-based experience research is found in several scientific disciplines, one outcome that has rarely been studied using this approach is fear of crime. Although fear of crime here only serves as an example of an outcome that may benefit from being examined in situ, the main focus of this article is directed at assessing the feasibility of gathering momentary and daily assessments on fear of crime using an experience sampling research design. A sample of 191 university students participated in a non-incentivized research study by downloading the smartphone application STUNDA, completing a baseline survey and repeatedly answering signal-contingent surveys, event-contingent surveys, and daily assessments across a self-defined study period. The results indicate that it is feasible to conduct research on fear of crime using a smartphone application. However, variations in participation across groups indicate that the methodology is perhaps best suited to dedicated groups of participants with a special interest in the studied outcome. Methodological considerations and implications for future research are discussed.
Keywords
Introduction
How people think, feel and behave during the course of their everyday lives is a topic that has consistently intrigued social scientists. While yearly retrospective surveys are recurrently used to measure any given daily life phenomena, one drawback with this approach is that such global measures do not adequately capture situational variations in a satisfactory manner (Reis et al., 2014). As a consequence, there has been an increased interest within contemporary research to develop methods to study thoughts, feelings and behaviours as they occur in situ while mitigating some of the limitations pertaining to conventional methods and instruments (Reis et al., 2014; Schwartz et al., 2016; Shiffman et al., 2008). In experience research (e.g. Experience Sampling Method and Ecological Momentary Assessments), participants are generally provided a short survey in relation to a prompt, which contains items regarding any outcome of interest in that particular moment, as well as any other relevant contextual information (see Csikszentmihalyi and Larson, 1987; Stone and Shiffman, 1994). Experience studies have expanded rapidly due to the implementation of studies through smartphones (Raento et al., 2009). This research now spans over several different scientific disciplines, focusing on a broad range of outcomes such as happiness (MacKerron and Mourato, 2013), experiences of tinnitus (Wilson et al., 2015), emotional arousal (Shoval et al., 2018), drinking (O’Donnell et al., 2019) and loneliness (Van Roekel et al., 2013).
While showing that this methodology can provide detailed situational data, experience studies often have small samples (Van Berkel et al., 2017a) and there is usually a substantial variation in participation patterns across individuals, with a small number of individuals providing a large proportion of all the data collected (e.g. Labhart et al., 2019). These issues are also present in experience research on fear of crime, an outcome that has rarely been examined using experience methods, with the exception of a few recent studies (Chataway et al., 2017, 2019; Irvin-Erickson et al., 2020; Solymosi and Bowers, 2018; Solymosi et al., 2015). Although these studies show that it is technically feasible to design a smartphone app to collect momentary data on fear of crime, there are still gaps in knowledge regarding other, and equally important, dimensions of the feasibility of this approach. These include, for instance, accounting for duration of participation, compliance rates, participant time-burden and participatory patterns across different groups.
Although fear of crime mainly serves as an example of an outcome that may benefit from being examined in situ, this study retains a strong methodological focus which extends the existing body of research on the measurement of situational dimensions of fear of crime using smartphone apps in two ways. First, it provides a detailed description and outline of the smartphone app STUNDA. Second, the study assesses the feasibility of collecting data on situational fear of crime in a comparatively large sample of university students. This study may thus be of relevance to anyone interested in either methodological questions pertaining to the app as an instrument for surveying experiences in situ or to whether and how such an instrument is used by participants.
Background
Limitations with retrospective surveys and global measures
Retrospective surveys using global measures, for instance, in the form of annual surveys, have provided the social sciences with a great deal of knowledge. Although these conventional approaches attempt to capture a variety of lived experiences, they lack ecological validity since the phenomena examined are not addressed in situ, where life is experienced (Reis et al., 2014). Generalizations based on global measures of experiences may therefore be problematic (Shiffman et al., 2008), as research comparing global measures with momentary assessments in situ demonstrates that respondents tend to exaggerate and/or underestimate experiences in retrospect (e.g. Ben-Zeev et al., 2012; Gunthert and Wenze, 2012). This, at least at times, low correspondence between retrospective and momentary experience surveys (Scollon et al., 2003; Stone et al., 1998) indicates that global estimations of experiences are not necessarily referring to the actual experience, but are rather a result of individuals generalizing their beliefs about the particular experience (Schwarz, 2012). Furthermore, when participants are asked to aggregate their experiences in global assessments, researchers are relying heavily on the skill of participants to do so (Shiffman et al., 2008). Participants are expected to identify the requested experiences, retrieve them from a (long) reference period, estimate the number of occurrences during this period and finally provide the overall frequency with which they have occurred (Schwarz, 2012).
Although memory or recall bias may be less of a problem in terms of more tangible and systematically recurring everyday experiences, approximations of more volatile concepts are more difficult to recall and are consequently more challenging to accurately estimate in retrospect (Bolger et al., 2003). In sum, these biases show that retrospective surveys based on global measures are limited in their ability to fully capture dynamic processes, such as subjective experiences (Ben-Zeev et al., 2012). Additional methodological approaches are therefore needed to assist in providing a more complete picture of the phenomena studied.
Alternative approaches to sampling experiences
The term everyday experience studies is used to summarize all approaches to the study of experiences in daily life (Reis et al., 2014), including Ecological Momentary Assessments and the Experience Sampling Method (see Csikszentmihalyi and Larson, 1987; Stone and Shiffman, 1994). The methodology is quite straightforward and usually consists of prompting participants at different times during the day to collect moments in the participant’s daily life, in which emotions, thoughts, behaviours or other recurring experiences can be captured in an ecologically valid design (Scollon et al., 2003; Shiffman et al., 2008). Smartphones have become an invaluable tool in these methodologies, since they are able to notify participants, present questionnaires, and in some cases also collect auxiliary sensor-based data (Raento et al., 2009; Van Berkel et al., 2017a). Consequently, experience studies using smartphones are attracting an increased amount of attention across several disciplines, focused on a broad range of topics such as happiness (MacKerron and Mourato, 2013), quality of life (Liddle et al., 2017), experiences of tinnitus (Wilson et al., 2015), emotional arousal (Shoval et al., 2018), relationships between affective states and alcohol consumption (Duif et al., 2020), drinking (O’Donnell et al., 2019) and loneliness (Van Roekel et al., 2013).
There are plenty of different procedures to collect experience data. In a signal-contingent sampling approach, participants are prompted to make an assessment when receiving a randomly distributed signal (Palmier-Claus et al., 2011; Scollon et al., 2003). The signals are often randomized within time intervals across the day (Palmier-Claus et al., 2011; Scollon et al., 2003) and the surveys usually include an expiry time for responses following a signal in order to actually capture momentary assessments (Scollon et al., 2003). Event-contingent sampling is useful when there is a risk that signal-based sampling may miss important events (Moskowitz and Sadikaj, 2012) or when examining rare phenomena (Van Berkel et al., 2017a). Here, participants are asked to provide data whenever a predefined event occurs (Reis et al., 2014; Napa Scollon et al., 2003; Shiffman et al., 2008). Events may be identified by participants themselves (e.g. Labhart et al., 2019), or by context or sensor-based triggers (e.g. Chataway et al., 2017; Lathia et al., 2013; Moskowitz and Sadikaj, 2012). Interval-contingent sampling refers to data being collected from participants in predefined time slots, such as once an hour (Scollon et al., 2003). A fixed timing schedule may be based on a momentary approach (asking questions about what is going on at the moment) or on a reference period (e.g. what has happened since the previous signal) (Conner and Lehman, 2012; Reis et al., 2014). Regardless of sampling approach, experience studies collect a wide range of situational data, such as time, place, geographical location, ongoing activity and the presence of other people (e.g. Birenboim, 2018; Comulada et al., 2016). Some contextual information (e.g. time and geographical location) is often collected via smartphone sensors (Raento et al., 2009; Van Berkel et al., 2017a).
Outcomes in experience studies: the example of fear of crime
Any phenomenon with a situational dimension can benefit from being examined using experience methods and fear of crime will here serve as an example of one such phenomenon. Although fear of crime may be both a trait and a state, depending on the definition, experience sampling may provide information on which dimensions of crime fear are situational (state) or stable across situations (trait). 1 However, fear of crime has rarely been examined using experience methods, with some important exceptions. Solymosi and colleagues (2015; see also Solymosi and Bowers, 2018) examined worry about becoming a victim of crime using signal- and event-contingent assessments. Similarly, Irvin-Erickson and colleagues (2020) used a smartphone app to examine fear of crime among a sample of transit users. Furthermore, Chataway and colleagues (2017, 2019) used a smartphone application to survey dimensions of crime fear by means of event-contingent surveys, as participants entered geofenced areas (e.g. shopping areas and beaches), and signal-contingent surveys provided to participants twice every third day. 2
From a methodological standpoint, these studies illustrate that smartphone applications can be designed and used to collect momentary data on fear of crime across different contexts. However, these studies have not fully examined the feasibility of collecting experience data on fear of crime across different participant groups. This is likely due to their use of small samples, with little variation across participant characteristics. It is therefore important to further explore how experience methods can be employed in fear of crime research, particularly in terms of various aspects of the feasibility of collecting data.
The present study
This study retains a strong methodological focus and aims to contribute to the existing body of experience research examining fear of crime in two ways. First, a detailed description of STUNDA and the considerations preceding its content and design are outlined. This objective aims to inform researchers about emerging issues when designing such an instrument and how these were resolved in STUNDA. A second purpose is to explore the feasibility of this approach by examining participation regarding a number of feasibility indicators.
Description of STUNDA
A smartphone application was developed by the authors in collaboration with a small commercial actor and was named STUNDA. 3 STUNDA is inspired by the Fear of Crime Application (Solymosi et al., 2015), but is compatible with both iOS and Android systems. In line with others (e.g. Smith et al., 2017) much effort was devoted to developing a user friendly app and designing surveys that can be responded to quickly, as suggested in previous research (Palmier-Claus et al., 2011; Reis et al., 2014). Therefore, a small student group (N = 4) operated as a pilot test group using the app for one week. This pilot was followed by a meeting where functions, items and user-friendliness were evaluated which resulted in a few final tweaks to STUNDA before the full study was launched. Screenshots, flowcharts and the source code of STUNDA are presented in Online Supplementary Appendix A.
STUNDA includes four different surveys. As participants logged on to STUNDA for the first time, they were asked to provide informed consent to participate in the study and this was followed by the baseline survey. This survey comprises about 80 items focused on demographics (e.g. age, gender), smartphone type and model, routine activities (e.g. days per week commuting), smartphone usage (e.g. frequency of using social media) and also a number of conventional global measures of fear of crime and crime victimization.
After completing the baseline survey, signal-contingent surveys were activated and participants were prompted to complete these surveys by notifications sent three times per day. Three signals were deemed reasonable for this study, in part based on information from the pilot, but also because this constitutes a common number of notifications employed in other experience sampling research (e.g. O’Donnell et al., 2019; Remmerswaal et al., 2019; Sumaya and Darling, 2018). In order to sample situations evenly across all hours of the day, a stratified random sampling scheme was created locally in each participant’s smartphone device (Palmier-Claus et al., 2011; see also Shiffman et al., 2008). The full range of hours were therefore divided into three equal time slots (07:30–12:30; 12:31–17:30; 17:31–22:30) where one notification was sent at random times within each time slot respectively. The full range of hours covered (07:30–22:30) was deemed least intrusive in the pilot and is similar to that used in other studies (Duif et al., 2020; Remmerswaal et al., 2019). In order to ensure that assessments were made close in time to the sampled situation, that is, after the signal, the survey had to be initiated (opened) within 20 minutes after receiving a notification, which is a relatively common expiry time (Scollon et al., 2003).
The signal-contingent survey started with three items about the current situation: where the participants were located (functional location), what they were doing, and who else they were with. Each question had a set of predefined response options (e.g. home, studying, alone) based on previous situational studies (Wikström et al., 2012), but also open-end responses when needed. Participants were then asked to rate their perceived safety, worry of crime and how likely they believed they were to become victim of a crime at the moment. While previous studies have used 4-point scales to measure momentary fear of crime (e.g. not very worried to very worried; see Chataway et al., 2019; Solymosi et al., 2015), mood levels and other experience outcomes are sometimes measured by slider scales (e.g. Lathia et al., 2013; Smith et al., 2017). Furthermore, since outcomes related to fear of crime could be measured along a continuum (e.g. Traunmueller et al., 2015), the fear of crime dimensions included in the signal-contingent survey were measured using a slider ranging from 0 to 100 (numbers were not visible for the participants), with end points indicating the scale extremes (e.g. not worried at all to very worried). If participants placed the slider on a value of 10 or above, a conditional item was presented, asking whether the worry or likelihood of being victimized was related to one or more specific types of crime. Participants were also asked to describe their perception of their momentary safety via an open-ended qualitative assessment. Finally, STUNDA automatically provided each signal-contingent survey with a spatiotemporal stamp using built-in smartphone sensors. 4
STUNDA also included an event-contingent survey which was always active, enabling users to report unsafe or fearful events in real time or in close proximity to their occurrence. Event-contingent sampling is adequate for measuring infrequent events (see Van Berkel et al., 2017a), making it a potentially good fit for an outcome such as fear of crime. The survey was largely identical to the signal-contingent survey, but here the participants manually reported the location of a fearful event and how long ago the incident had happened.
The third experience survey was an interval-contingent survey, henceforth referred to as the daily assessment, which sampled experiences during the past 24 hours. Although somewhat counterintuitive, some experience sampling studies include a retrospective approach, although focusing on a period very close to the present time (e.g. Comulada et al., 2016). Despite risking memory bias, the near-in-time retrospective approach is preferable to global assessments that take place a long time after the actual experiences (Shiffman et al., 2008), and may be useful with regard to experiences of a specific event (Schwarz, 2012). Participants were instructed to answer this survey once a day, preferably in the evening before going to bed, although they were reminded by a notification each night (see Gunthert and Wenze, 2012). This daily assessment was always active (i.e. had no expiry time) since participants may have different diurnal rhythms. The daily assessment included a number of items pertaining to fear of crime, similar to those asked in conventional surveys such as the Swedish Crime Survey (see Molin and Lifvin, 2019), with the major modification of having the past 24 hours as a reference period. Participants who had worried about becoming the victim of a crime during the past 24 hours were then asked to think back to the most recent event in which they had felt worried and were subsequently prompted with the same items as in the event-contingent survey regarding that specific moment. This approach thus allowed the daily assessment to capture momentary experiences of fear of crime in near retrospect.
Study procedure and sample characteristics
This study used a convenience sample consisting of students enrolled in undergraduate courses at Malmö University during the fall of 2018 and was approved by the Regional Ethical Review Board in Lund (ref. 2018/464). The recruitment process primarily consisted of a Five minute oral presentation in scheduled classes but also employed manned displays across campus. When recruiting in classes, all students were provided with a flyer containing essential information about participation and unique user credentials required to log on to STUNDA. Participants were asked to participate for 14 days, the median study length in a literature review of experience studies (Van Berkel et al., 2017a), but were also informed that shorter and longer participation was possible. The first week of recruitment was devoted to only one class of criminology students in order to discover any bugs that had not been identified during the pilot and to test the database capacity when several users were using STUNDA simultaneously.
It is not possible to know exactly how many students were contacted in the classes or visited the displays but a liberal estimate would be that no more than 2000 students were informed. During recruitment, a total of 933 students retained a flyer of which 191 (20.5%) downloaded STUNDA to their smartphone and completed the baseline survey. A brief description of the sample is provided in Table 1 where the predominance of females (71%) is noteworthy, but also expected, since two-thirds of the students at Malmö University are women (Malmö University, 2020). Another noteworthy sample characteristic is that approximately 40% of the participants declared having been victimized by at least one personal crime during the past year. This rather large proportion of participants reporting victimization is largely explained by individuals having been the victims of sexual harassment either online or in person. When sexual harassment is excluded from this measure, the proportion reporting victimization decreases markedly, to about 20% of the sample.
Sample characteristics (N = 191).
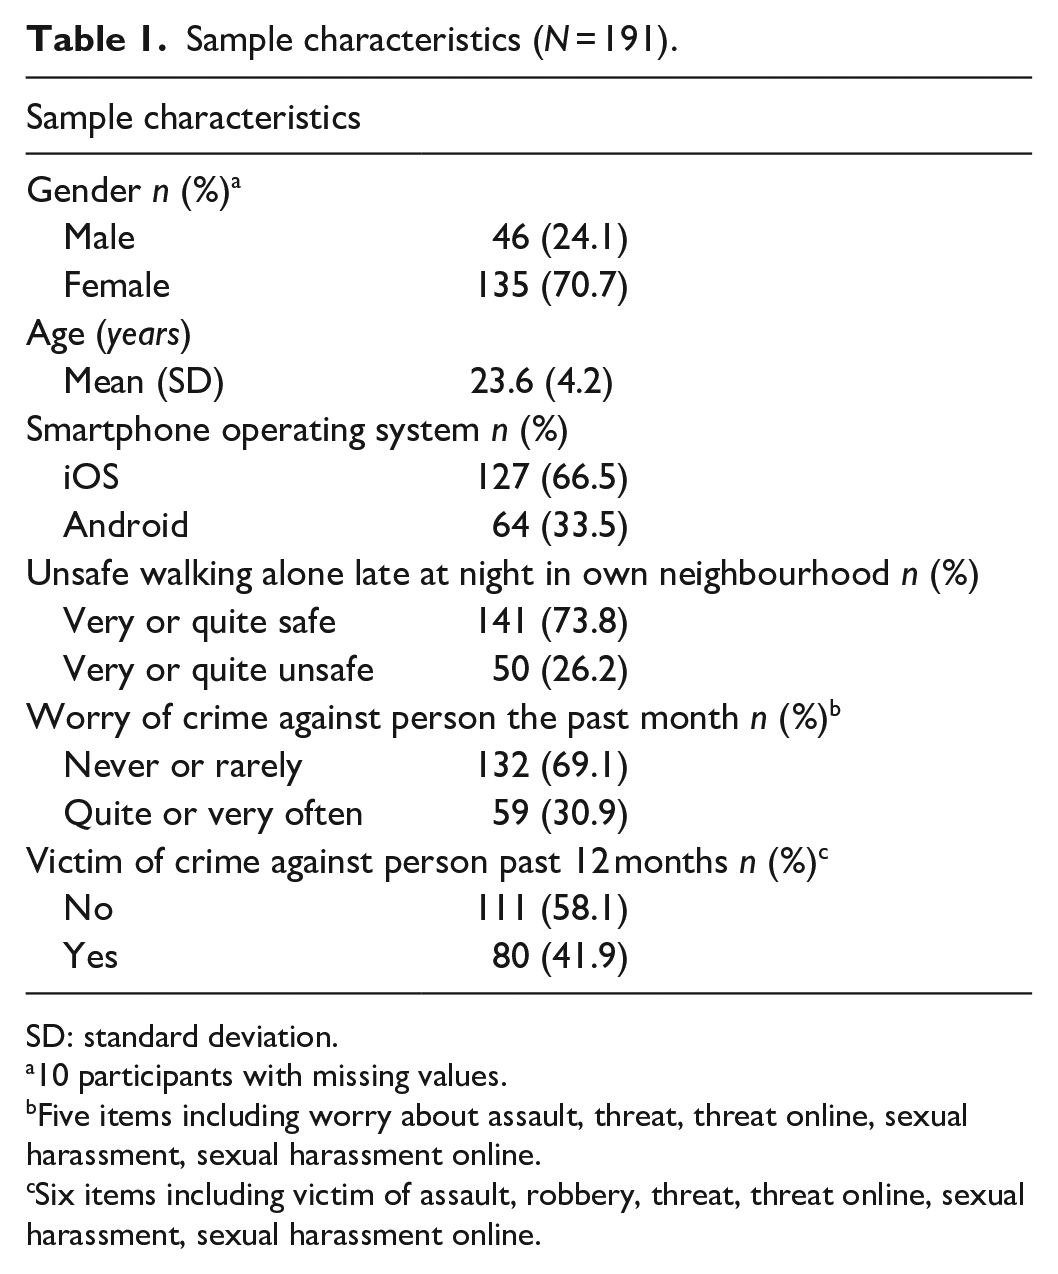
SD: standard deviation.
10 participants with missing values.
Five items including worry about assault, threat, threat online, sexual harassment, sexual harassment online.
Six items including victim of assault, robbery, threat, threat online, sexual harassment, sexual harassment online.
Feasibility indicators
A number of study characteristics have been suggested important to report in experience research studies (Van Berkel et al., 2017a). Some of these are here used as feasibility indicators because they measure aspects that can be used to assess how (and if) the planned methodology functioned in practice. First, the number of surveys provided by participants and duration of participation are both important indicators, since the outlined methodology uses repeated measures multiple times per day and demands participant endurance. Another feasibility indicator is compliance rates, which refer to the ratio of reported surveys out of all surveys provided to participants (Van Berkel et al., 2017a). However, the number of notifications received by each participant (i.e. provided surveys) during the data collection period is unknown due to reasons beyond the control of the research team. 5 Two estimations of received notifications were calculated for the signal-contingent survey and the daily assessment, respectively, in order to provide estimated compliance rate intervals. The estimates of notifications were based on the number of days participants were active in the study, that is, answering at least one signal-contingent survey or daily assessment, and are described in detail in the Appendix. Furthermore, response time and participant time-burden is a feasibility indicator examining when and how much time participants spent on answering different questionnaires. The final feasibility indicator concerns correlates of participation. A recurring phenomenon in experience sampling studies is that compliance rates vary heavily within samples (e.g. Chataway, 2019; Labhart et al., 2019). An interesting question thus involves exploring participant characteristics between those answering many surveys and those answering a few.
Analytical approach
Most included feasibility indicators are of descriptive nature but correlates of participation were assessed using a more complex strategy which is outlined here. The dependent variable is participation in the study’s surveys and participants were therefore grouped according to the number of surveys they had reported. While Labhart et al. (2019) categorized participants in three groups based on their cumulative share of reported surveys, we adopted a slightly different approach to acknowledge the, in our view, meaningful difference between participants reporting none and one (or more) surveys. The group of abstainers therefore consists of participants who did not answer a single signal-contingent or daily survey, respectively. All other participants were assigned to one of two groups. The first group consists of dedicated participants (DP), who answered a total of surveys that was in excess of one standard deviation above the mean number of reported surveys for the full sample, while the second group was labelled occasional participants (OP), and consists of participants who were not categorized as either abstainers or DP. 6 Note that these groups were created separately for each type of survey (i.e. an individual may be a DP in relation to the signal-contingent survey but an abstainer in the daily assessment). The event-contingent survey cannot be assessed in terms of compliance since it is fully participant-initiated but descriptive results regarding its use are reported.
Experience research generally suffers from ‘compliance bias’ as participation frequency varies heavily across participants which may be explained by, for instance, contextual factors (see, for example, Van Berkel et al., 2020). Although research indicates that personal factors may not affect compliance (see Soyster et al., 2019), these factors are rarely studied in experience research. Therefore, a number of independent variables from the baseline survey were included to examine correlates of participation. Gender was included since being female is associated with higher compliance (Rintala et al., 2019; Vachon et al., 2019). Age was also included because older age may be associated with higher compliance (Rintala et al., 2019), although a meta-analysis did not find such a relationship (Vachon et al., 2019). A measure of the type of operating system (iOS or Android) was also included in order to control for any potential technical or user interface issues. A measure of being a criminology student was included as these students might be expected to have a special interest in fear of crime research. However, as field of study was not included as a question in the baseline survey, this is a proxy measure based on when participants completed the baseline survey (criminology students were the main group of participants during the initial week of recruitment).
Two conventional measures of crime fear and one measure of previous victimization were also included as independent variables, since individuals experiencing elevated levels of fear of crime, or previous victimization, are potentially more likely to participate as they may regard the study topic as important. The measure of feeling unsafe late at night is based on a conventional measure of ‘feeling unsafe when walking alone late at night in one’s own neighbourhood’ which was coded dichotomously (very or quite safe = safe; very or quite unsafe = unsafe). The measure of feeling worried about crime is based on five items measuring how often the participant had worried about being assaulted, threatened or harassed in person, threatened or harassed online, sexually harassed in person and sexually harassed online, during the past month. Response options ranged from ‘never’ to ‘very often’ and participants who had worried about any of these crimes quite often or very often were coded as worried. The measure of previous victimization was constructed in a similar manner. Here, participants who reported that they had been the victim of mugging, or of any of the same offences as listed above, were coded as previously victimized.
The independent variables from the baseline survey were regressed on membership of the groups identified above using multinomial logistic regressions. Although there is an association between belonging to a particular participant group in both the signal-contingent survey and the daily assessment, this relationship is by no means perfect. For instance, while most participants belonging to the DP group for the signal-contingent survey were also categorized as DP in regard to the daily assessment (68%), the remaining third were ‘only’ categorized as OP (a contingency table describing these differences are presented in Online Supplementary Appendix A). Thus, these differences warrant two separate analyses. The first relates to participation in the signal-contingent survey, while the second analysis relates to the daily assessment. Since 10 participants have missing values on gender, a subsample of 181 participants is included in the final analyses.
Findings
Number of surveys
The 191 participants provided a total of 1305 signal-contingent surveys. However, almost one-third of the sample did not answer a single survey of this kind, thus being complete abstainers, while the remaining 131 participants (69%) answered between 1 and 121 surveys over the study period. As illustrated in Table 2, the group of DP reported an average of 34 signal-contingent surveys compared to five surveys in the remaining group of OP. Turning to the daily assessment, 163 participants (85%) reported at least one such assessment, which indicates that a significantly smaller group were abstainers. While the participants reported a total of 956 daily assessments, there is substantial variation within the sample, ranging from 1 to 56 completed assessments. The DP group reported an average of 18 daily assessments and the OP group about four. The event-contingent survey resulted in 21 unsafe events reported by 18 participants. However, retrospective reports of unsafe situations were also provided through the daily assessment, which provided an additional 135 unsafe situations reported by 72 different participants.
Participation descriptives for full sample, occasional participants and dedicated participants.
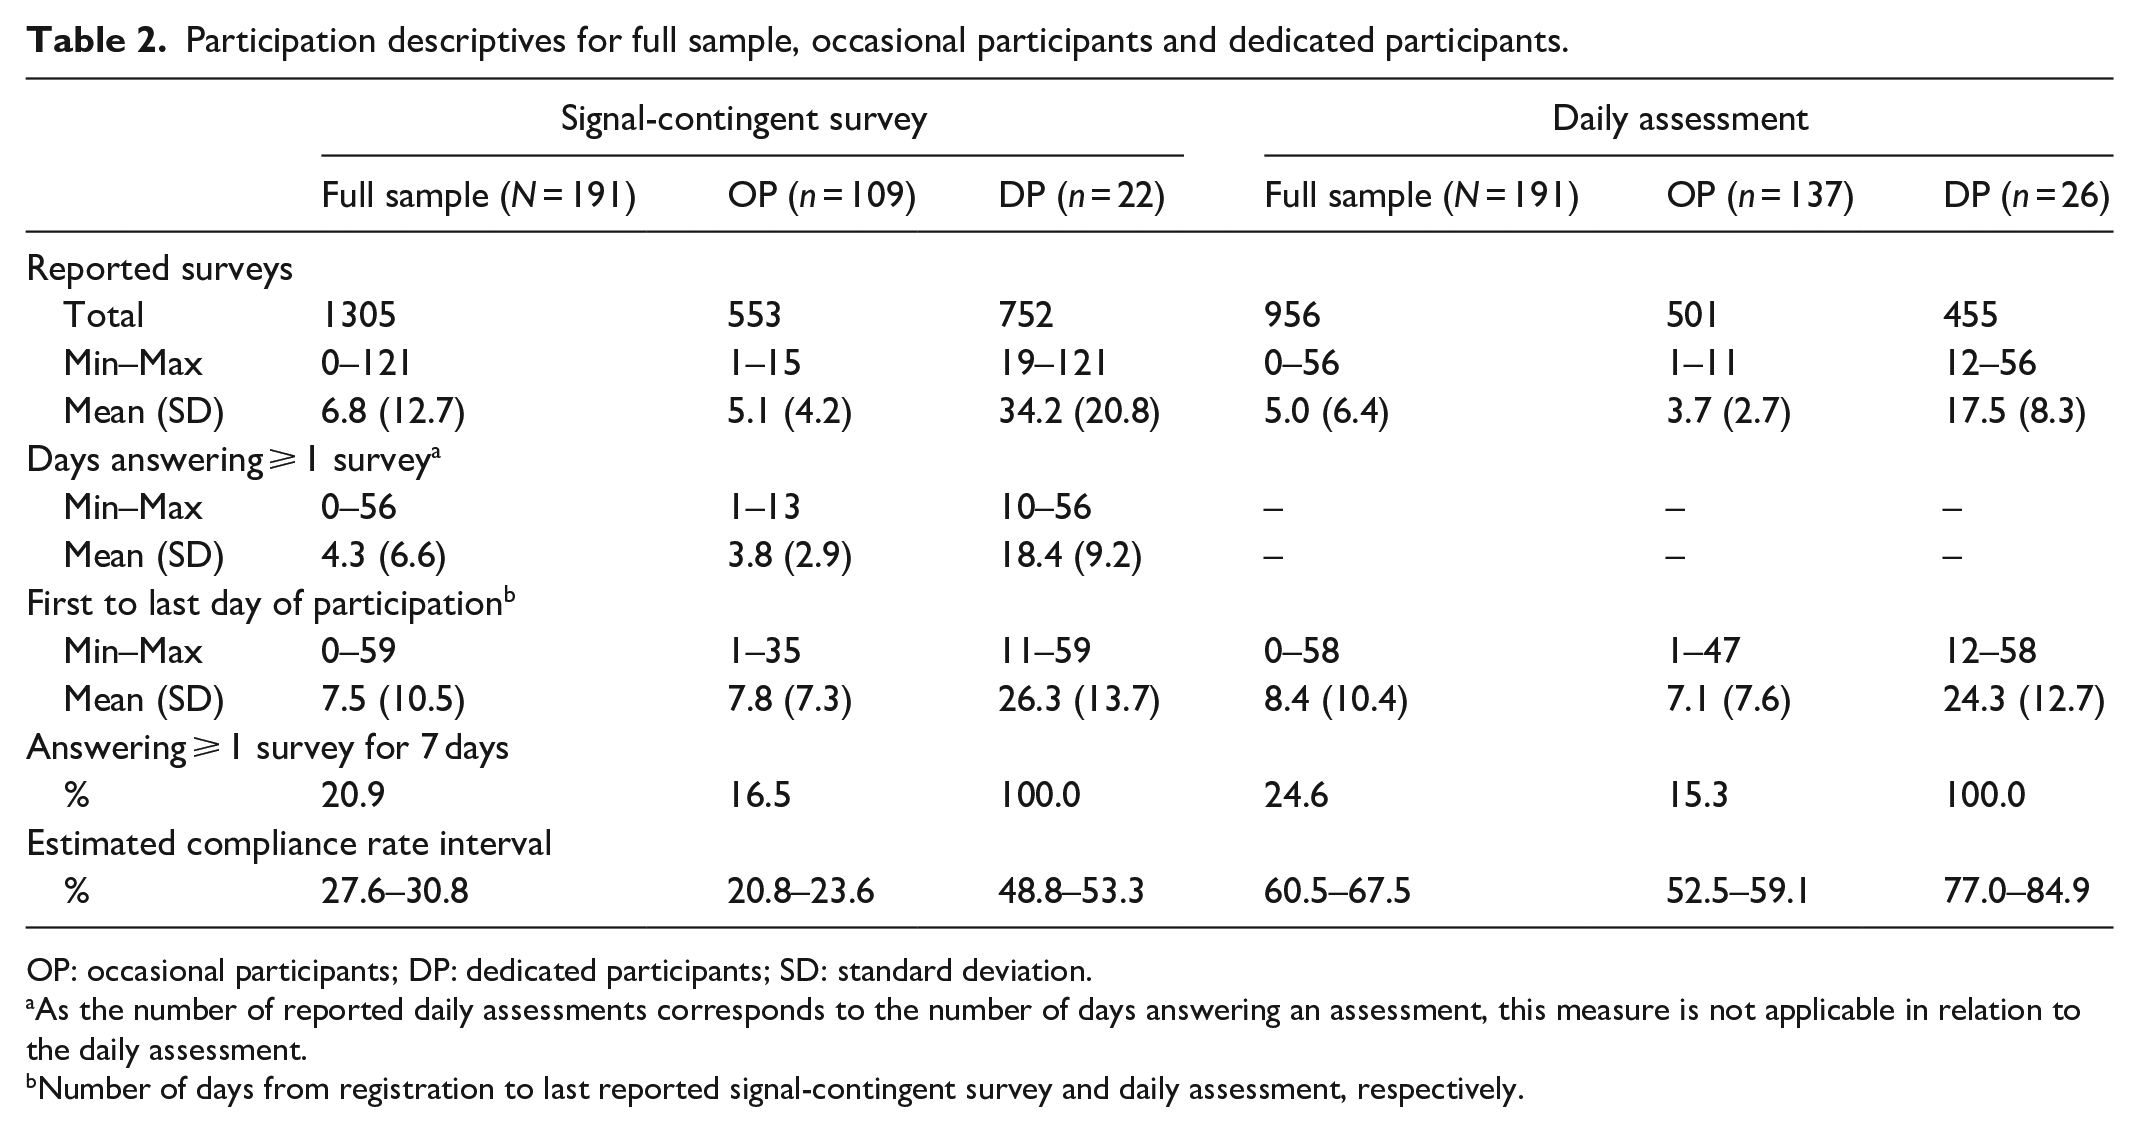
OP: occasional participants; DP: dedicated participants; SD: standard deviation.
As the number of reported daily assessments corresponds to the number of days answering an assessment, this measure is not applicable in relation to the daily assessment.
Number of days from registration to last reported signal-contingent survey and daily assessment, respectively.
Duration of participation
Only a small proportion of the full sample completed at least one signal-contingent survey per day and/or a daily assessment for a full 7-day week (21% and 25%, respectively). The participants answered on average the signal-contingent survey for about four days and the daily assessment for five. At the same time, the average number of days between the first and last day of answering surveys was greater than this, indicating that some participants did not necessarily answer surveys on a consecutive daily basis. However, when the participant groups are compared (see Figure 1), the DP group answered the signal-contingent survey for a longer period of days (mean = 18.4; SD = 9.2) compared to the OP group (mean = 3.8; SD = 3.9). Similarly, despite roughly 80% of the OP group completing the daily assessment on the day of registration (T1), this proportion had already fallen to about 20% four days later (T5). In contrast, 80% of the DP group were still providing a daily assessment 10 days after registration (T10). However, even among the DP group, only about half of the participants were still answering the daily assessment after two weeks. Some participants nonetheless continued to answer the daily assessment for more than 14 days, and in one case for more than 50 days.
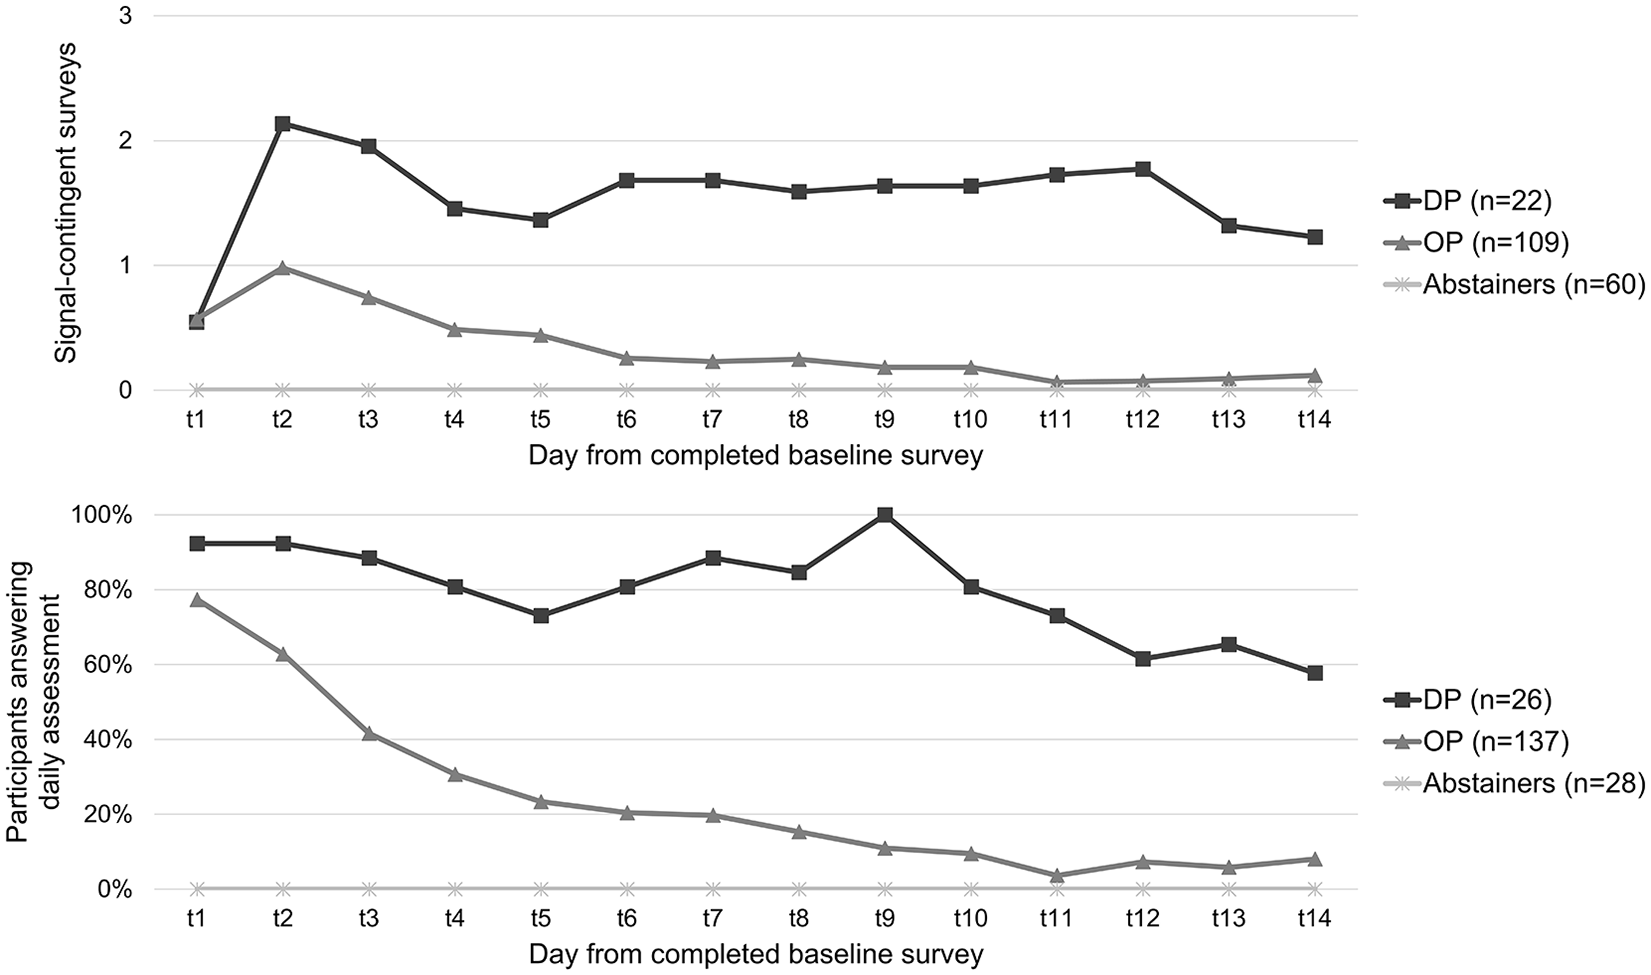
Mean number of reported signal-contingent surveys and percentage of participants answering the daily assessment, by group, from day of completed baseline survey (t1).
Estimated compliance rates
Based on the number of days that participants were active, it is estimated that the participants received somewhere between 4200 and 4700 notifications. The estimated compliance rate for the signal-contingent survey thus falls within an approximate range of 28% to 31% for the full sample (see Table 2). The estimated compliance rate differs markedly between the OP and DP groups, with the former ranging between 21% and 24%, while the latter ranges between 49% and 53%. For the daily assessment, the estimated compliance rate is considerably higher, ranging between 61% and 68% for the full sample. Here too there is a noteworthy difference between groups, with the OP group ranging between 53% and 59%, whereas the corresponding range for the DP group is between 77% and 85%. Yet again, it is important to stress that these are estimated compliance rates and must therefore be interpreted with caution.
Response time and participant time-burden
An important feature of STUNDA was to minimize the burden of participation by using relatively short questionnaires with intuitive navigation and controls, which was expected to keep the time spent on each survey short. The results (see Table 3) indicate that responding to the signal-contingent survey generally started within 3 or 4 minutes after receiving the notification. More specifically, about half of all signal-contingent surveys were started within a minute after the notification (51%), two-thirds within 3 minutes (66%), and almost all within 15 minutes (94%). Generally, this indicates that when participants responded to a signal, they did so with a considerable margin remaining in relation to the expiry time (20 minutes). It took 1 minute on average to complete this survey, which is similar to the average time spent on the daily assessment. The event-contingent survey was somewhat more time-consuming which in part is due to having more items and requiring manual input of otherwise automatically gathered data (i.e. geographic location and time). A t-test did not show any significant differences in either time between responding to a signal or time spent on answering surveys between participant groups. Over the course of their participation in the study, the participants spent an average of 10 minutes (mean = 09:58; SD = 17:15) completing signal-contingent surveys and just above 7 minutes (mean = 07:22; SD = 17:25) on daily assessments.
Descriptives of response times across the signal-contingent survey, daily assessment and event-contingent survey.
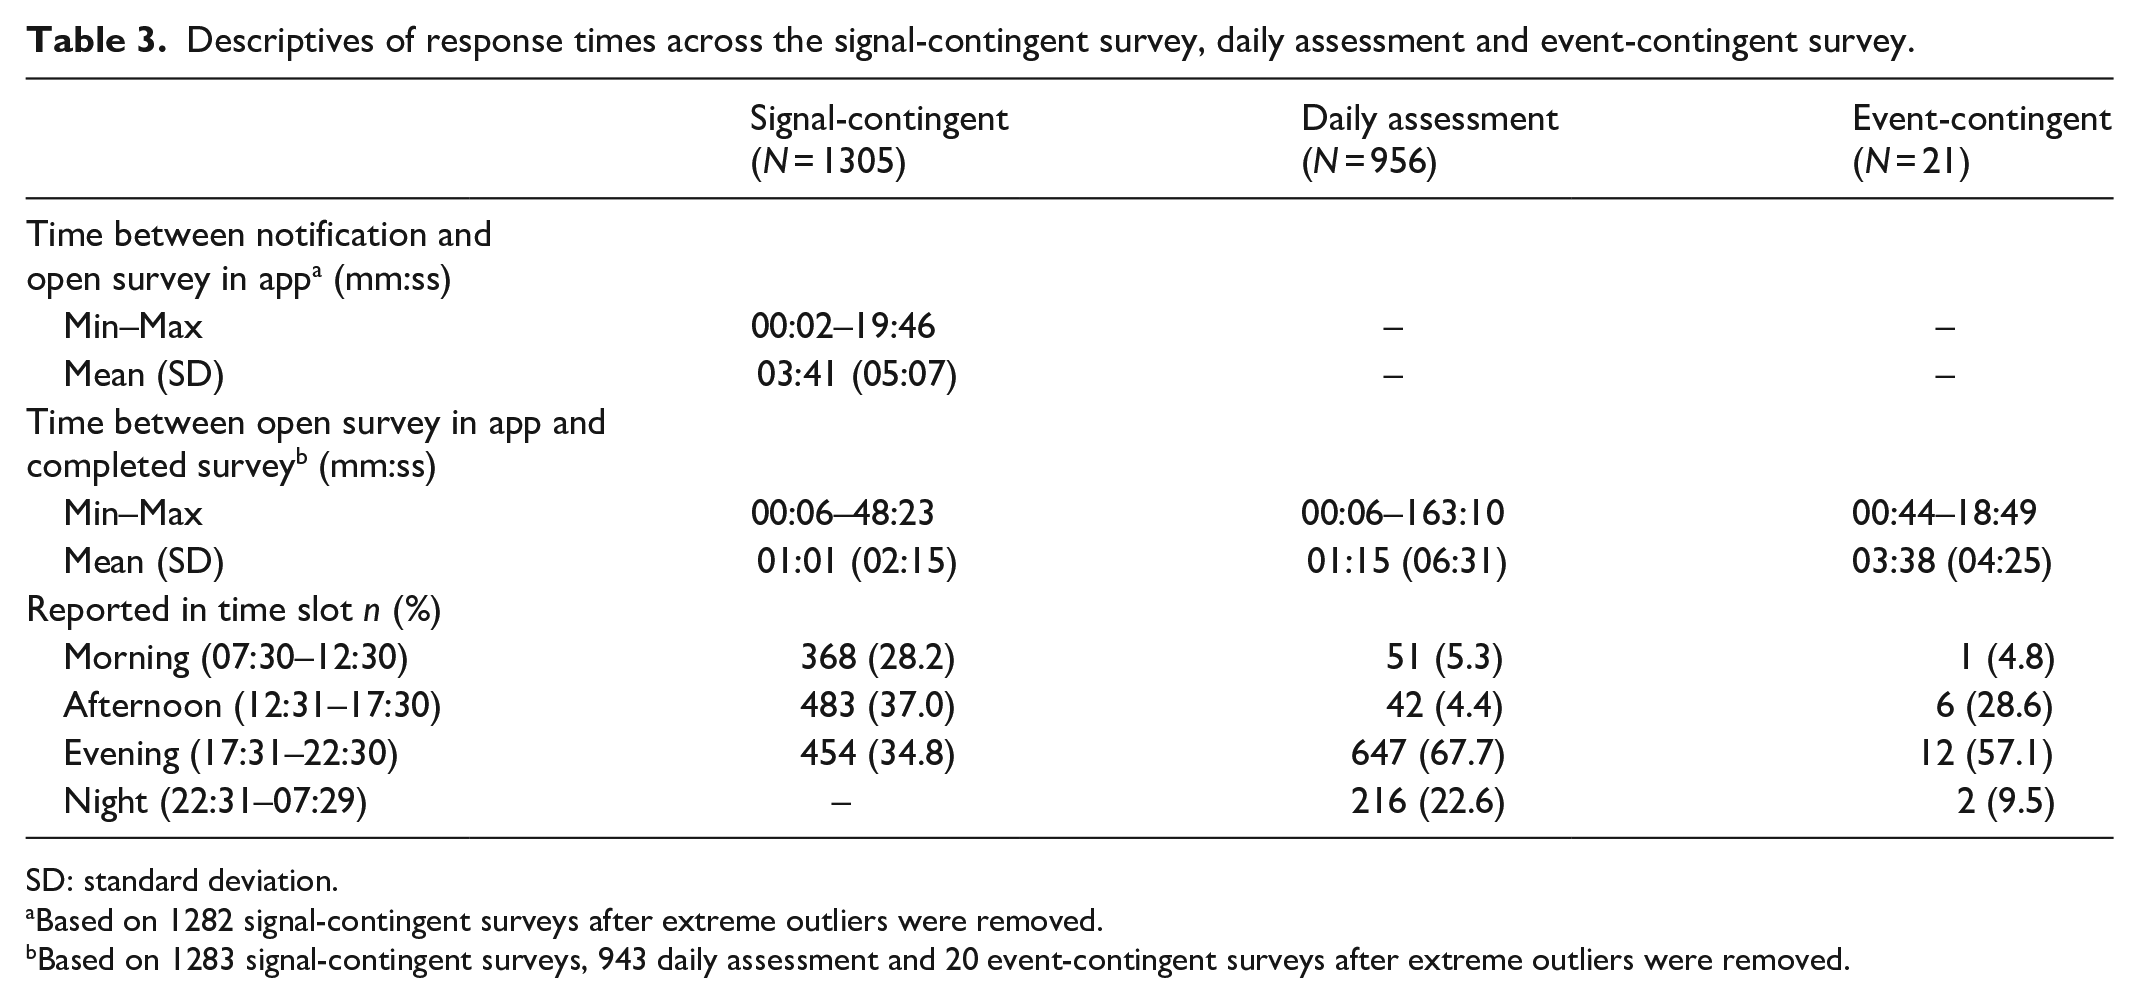
SD: standard deviation.
Based on 1282 signal-contingent surveys after extreme outliers were removed.
Based on 1283 signal-contingent surveys, 943 daily assessment and 20 event-contingent surveys after extreme outliers were removed.
Turning to when participants answered different surveys, the amount of reported signal-contingent surveys was below the expected share (i.e. 33.3%) during the early time slot (07:30–12:30), while somewhat above during the latter two. This finding is validated by an hour-by-hour analysis showing that participants were generally least prone to answer signal-contingent surveys during the early hours of the day (see Online Supplementary Appendix A). 7 The majority of the daily assessments were reported during late hours of the day which was expected since participants were instructed to answer this survey before going to bed. Yet, a number of daily assessments were also reported at other times, indicating variations in diurnal rhythms across participants or possibly that participants simply decided to answer the daily assessment at a time they found most convenient. About two-thirds of the event-contingent surveys were answered during evening or night (between 17:42 and 01:18), suggesting that most fearful events reported through this survey were clustered during late hours of the day. However, one-third of the event-contingent surveys were after all reported during other parts of the day (between 11:05 and 17:12) suggesting that fearful events also occurred during other parts of the day.
Correlates of participation
The results from the first model (signal-contingent survey) suggest that being female significantly increases the odds of being classified as a member of the OP and DP groups rather than being an abstainer (Table 4). Although the odds ratio (OR) indicates that this is also true for membership of the DP group compared to the OP group, this result is not significant. While age is not significantly associated with belonging to the OP group compared to abstainers (OR 1.09; p = .10), it is significantly associated with belonging to the DP group compared to both reference groups. For instance, a 1-year increase in age results in a 26% increase in the likelihood of being classified as a member of the DP group as compared to abstainers, and a 16% increase as compared to belonging to the OP group. Finally, being a criminology student heavily increases the odds of belonging to the DP group compared to both abstainers and the OP group.
Multinomial logistic regression on correlates of participation across groups (n = 181).
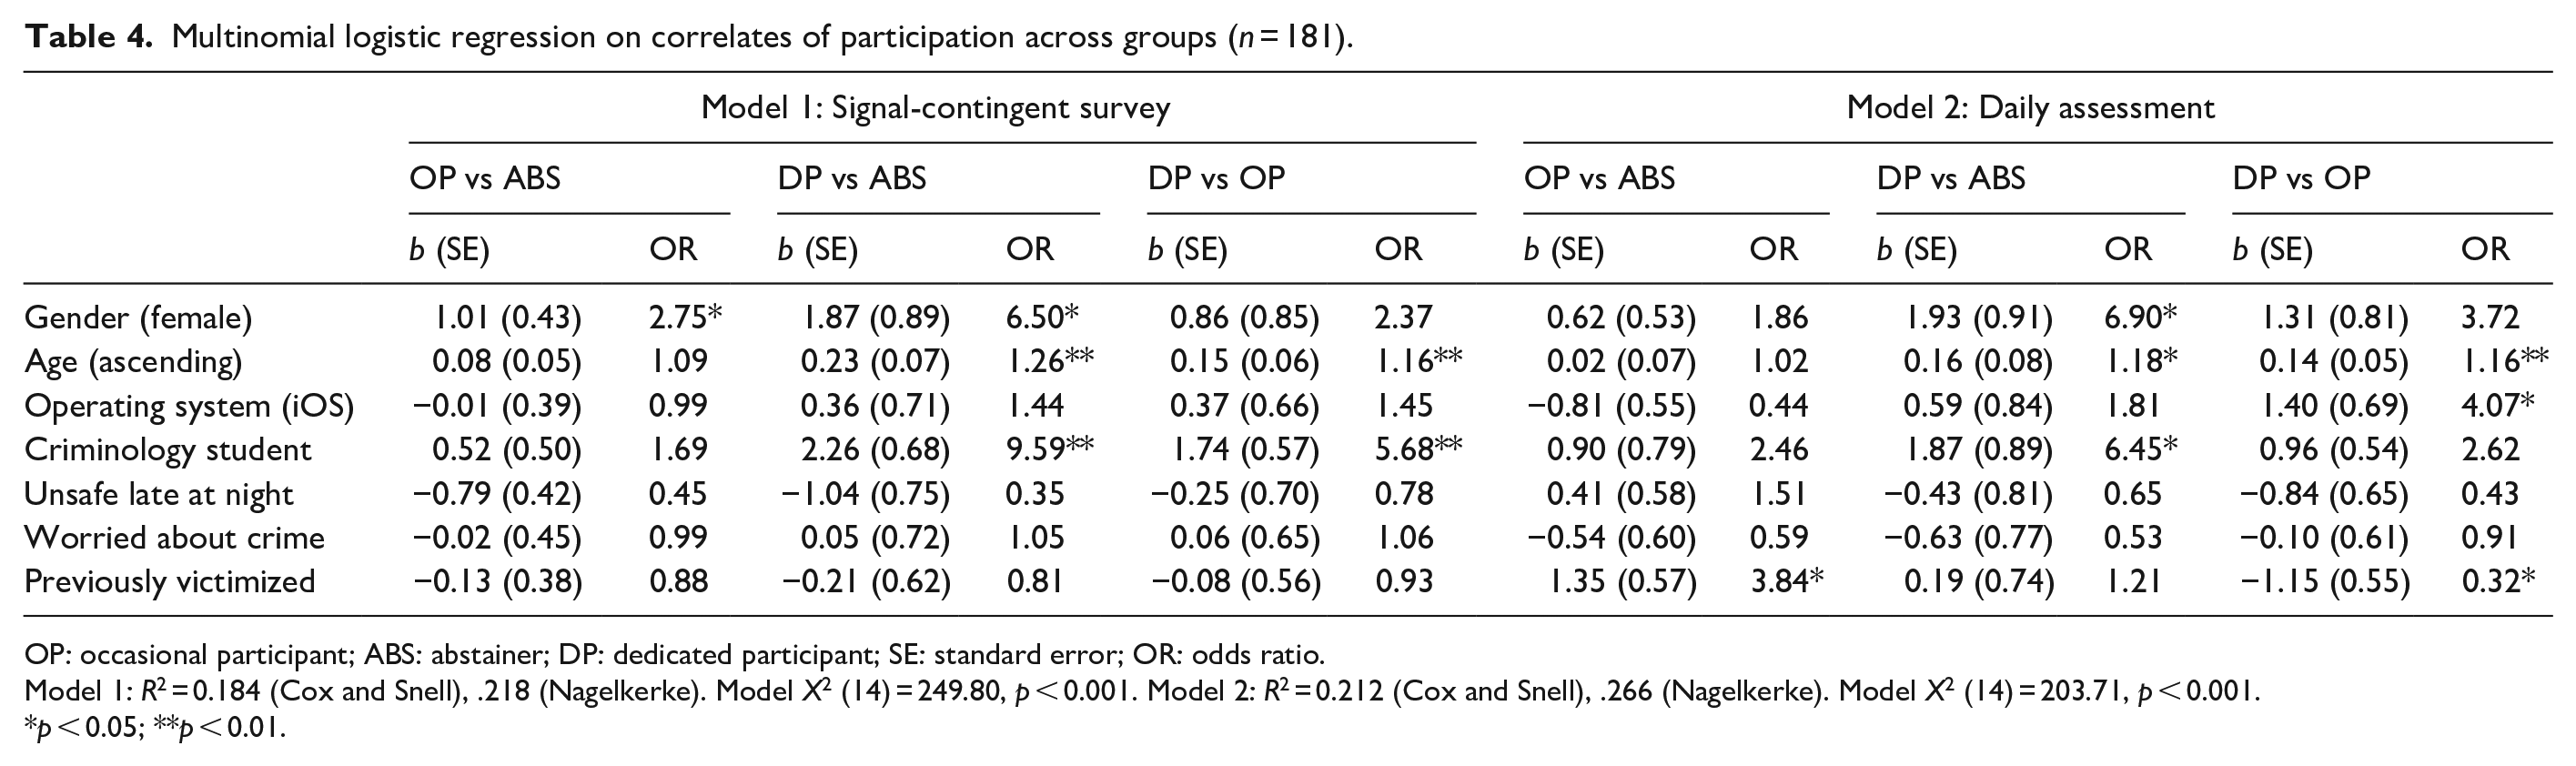
OP: occasional participant; ABS: abstainer; DP: dedicated participant; SE: standard error; OR: odds ratio.
Model 1: R2 = 0.184 (Cox and Snell), .218 (Nagelkerke). Model X2 (14) = 249.80, p < 0.001. Model 2: R2 = 0.212 (Cox and Snell), .266 (Nagelkerke). Model X2 (14) = 203.71, p < 0.001.
p < 0.05; **p < 0.01.
The results from the second analysis (participation in the daily assessment) are somewhat different, since the only significant predictor separating the OP group from abstainers is previous victimization (see Table 4). However, being female, older and a criminology student significantly increases the odds of being a member of the DP category compared to being an abstainer, which is identical to the results from the first model. However, while this final comparison suggests that being older is significantly correlated with membership of the DP group compared to the OP group, being a criminology student (OR: 2.62; p = 0.07) and female (OR: 3.72; p = 0.11) indicates a similar relationship but do not reach statistical significance. On the other hand, using the iOS system increases the odds of being classified as a DP compared to an OP, while previous victimization decreases these odds.
Summing up, the most prominent results from the two regressions indicate that being female, older and a criminology student are all generally associated to greater participation in the current study. This has been established both with regard to the signal-contingent survey and the daily assessment. However, since the grouping of participants may affect the results, we also conducted a sensitivity analysis where the grouping of participants was slightly different (results from all sensitivity tests are reported in Online Supplementary Appendix A). Inspired by Labhart et al. (2019), groups were defined by dividing participants answering at least one survey into two equal groups, based on the cumulative share of reported surveys. For the signal-contingent survey, this resulted in a DP group consisting of 17 participants answering 25 or more surveys (n = 650; 49.8%) and an OP group consisting of 114 participants answering between 1 and 23 surveys (n = 655; 50.2%). For the daily assessment, this procedure resulted in the same group affiliation as used in the main analysis above. The only noteworthy difference from the main analysis found in the sensitivity analysis is that feeling unsafe late at night significantly decreases the odds of belonging to the OP group compared to the abstainers. However, regardless of procedure, categorizing participants into groups generally entails limitations (due to loss of variation in the dependent variable). For this reason, bivariate Spearman’s correlation analyses were also conducted between the independent variables used in the regressions, with the dependent grouping variable being replaced by the original count variable (i.e. the number of reported signal-contingent surveys and daily assessments). The results show that the only factors that are significantly correlated with a higher number of reported surveys are being female, older, and a criminology student. Furthermore, since 10 participants were omitted from the main analysis due to missing values on gender, two additional bivariate correlation analyses were conducted in which these participants were considered as either male or female, respectively. These results did not, however, differ significantly from the analysis presented above. The main multinomial logistic regressions were also reproduced with these variables. The only noteworthy difference is that imputing missing values on gender with female in the daily assessment slightly decreases the OR and increases the p value to fall on the insignificant side of the significance threshold (OR: 5.09; p = 0.07).
Discussion
Feasibility of STUNDA and implications for future research
The results from this study corroborate conclusions from previous research that surveying dimensions of crime fear through a smartphone application, such as STUNDA, is technically feasible (Chataway et al., 2017, 2019; Irvin-Erickson et al., 2020; Solymosi and Bowers, 2018; Solymosi et al., 2015). However, the results from this study further contribute to existing research by providing a more finely grained analysis of feasibility indicators, particularly in terms of correlates of participation.
The results show that participants provided roughly 1300 signal-contingent surveys comprising rich information on each specific situation, including experiences of fear of crime in situ. In addition, participants reported approximately 950 daily assessments on experiences of fear of crime during the past 24 hours, including 135 unsafe situations in near retrospect, and a total of 21 event-contingent surveys. These results show that it is possible to integrate three different experience surveys, based on different sampling approaches, in one study design. Future research is advised to consider different experience sampling techniques since a mixed approach of this kind is probably reasonable when studying a phenomenon whose incidence rate is unknown. The inclusion of the daily assessment, which to our knowledge has not been used in previous experience research on fear of crime, proved to be a useful complement to the signal-contingent survey by providing information about daily experiences of fear of crime and to capture unsafe situations in retrospect. The inclusion of a daily assessment may also help explain the rather limited number of event-contingent surveys reported by participants, since unsafe situations occurring over the day were likely captured by the daily assessment. Yet, since there is no previous knowledge regarding the incidence of fearful situations, these results may reflect the actual experiences among the participants. Perhaps it takes a quite fearful situation to spare the time and effort needed to report it, thus underreporting situations that are not ‘fearful enough’. Furthermore, the daily assessment produced a considerably higher estimated compliance rate and a lower number of abstainers than the signal-contingent survey, suggesting that the former was experienced as more easily accessible, and perhaps also perceived as less intrusive, by the participants. Although the daily assessment risks suffering from memory biases due to its retrospective character, it may still be preferable to global assessments of fear of crime over longer reference periods.
Despite a considerable total number of reported surveys, the average participant only answered these for a handful of days before dropping out. Although this may be due to a perceived heavy workload, both signal-contingent surveys and daily assessments were completed on average within a minute, which is less than the recommended 2- to 5-minute completion time when participants are prompted at multiple times over a day (Palmier-Claus et al., 2011; Reis et al., 2014). Based on the average completion times, a participant who answered the baseline survey, three signal-contingent surveys and one daily assessment for 14 days would spend a total of about 1 hour and 15 minutes on actively answering surveys, which intuitively seems both reasonable and feasible given the richness of the data provided. These results thus indicate that smartphone-based experience studies may be less burdensome for the participants by comparison with other similar methods (see Solymosi and Bowers, 2018). However, the burden of participation is not simply a matter of effective time use but is also affected by the intrusiveness of being prompted multiple times during the day. As a result, in order to minimize dropout, future studies should consider allocating more resources to incentives that may stimulate participation. Although these may be (monetary) micro-incentives, which have been suggested as a promising way forward (Van Berkel et al., 2017a), they might also take the form of in-app incentives such as ‘gamification’ (Van Berkel et al., 2017b), weekly updates about the study (Lathia et al., 2013) and feedback on compliance rates (Conner and Lehman, 2012).
Another important observation in this study is that the amount of reported surveys, days of participation and estimated compliance rates varied heavily within the sample. Although similar phenomena have been observed in previous research using comparable methodologies (e.g. Labhart et al., 2019) and outcomes (e.g. Chataway, 2019), this study aimed to unravel why participation varies within the sample. The statistical analyses revealed that being female, older and a criminology student generally increased the odds of greater participation. This is in line with previous research finding that being female is related to higher levels of compliance (Rintala et al., 2019; Vachon et al., 2019) and that being older is associated with higher compliance (Rintala et al., 2019). One possible interpretation of these results, particularly the positive association between being a criminology student and participation in the surveys, is that participants with an ‘interest’ in the studied outcome (e.g. fear of crime) are more prone to accept a fairly intrusive and intensive study design. Many previous studies using similar methods are indeed based on populations with some kind of interest in the study outcome rather than on more general populations in which motivation to participate may be lower (Courvoisier et al., 2012).
Interestingly, however, such an interpretation of the results may also be challenged by the finding that baseline measures of previous victimization and a general worry about becoming the victim of a personal crime did not indicate increased participation. It cannot therefore simply be assumed that those most affected by crime and fear of crime are more prone to provide data on fear of crime. Thus, other interpretations may be needed, such as the potential presence of a stronger sense of having a responsibility to participate among women, those of higher age and criminology students. Overall, these findings indicate that target populations must be selected carefully in future research. Perhaps general population samples are less suitable using the suggested method, at least when implemented in a non-incentivized study design. Instead, focus should perhaps be directed towards potentially DP with a specific interest in participating. Future research should also further examine other correlates of participation than those included in this study, such as area-level factors (e.g. level of collective efficacy), individual characteristics (e.g. personality traits) or other situational or contextual factors (see Van Berkel et al., 2020).
Another noteworthy result is that using the iOS operating system was associated with greater participation in the analyses (however, only significantly associated in one group comparison). It is therefore not possible to rule out that the type of smartphone used by the participants affected their participation. For instance, Android users may have suffered unknown technical and/or user interface issues which were not detected by the pilot test group. While participants using the iOS operating system provided more reports relative to Android users in this study, it may still be important to include both platforms since there may be differences across individuals using different platforms. In Sweden, the iOS platform is more common among women, younger persons and those with higher incomes (Andersson, 2019). There may also be differences in sociodemographic factors, and in personality characteristics to some extent, across users of different platforms (see, for example, Götz et al., 2017).
Finally, although fear of crime has been used as an example of a phenomenon that may benefit from being studied using an instrument such as STUNDA, researchers interested in the situational dimensions of any phenomena could benefit from using the suggested methodology. However, in relation to fear of crime research specifically, it seems safe to conclude that this study shows that smartphone applications can be developed to provide answers to new and largely unanswered research questions pertaining to situational dimensions of fear of crime. However, using the methodology proposed here to study fear of crime is not a matter of dismissing traditional approaches to collecting data on fear of crime. STUNDA incorporates both conventional approaches (the baseline survey) and experience methods. This may provide a means of producing a more complete picture of the characteristics, prevalence and frequency of fear of crime.
Limitations
One major shortcoming of the data collection process in STUNDA is that experience sampling, and signal-contingent surveys in particular, interrupts participants in their daily lives, introducing a risk of bias that certain situations (e.g. activities that it is not possible and/or desirable to interrupt) will not be sampled (Scollon et al., 2003). Participants might also simply be biased when choosing whether or not to respond in certain situations (Raento et al., 2009). Such bias may also be present in this study as participants were generally less prone to answer signal-contingent surveys during the early time slot, and especially during early morning hours. STUNDA uses the daily assessment (and the event-contingent survey) to sample situations in near retrospect, which may reduce this problem. A similar issue regarding the representativeness of experiences is related to the hours examined by the signal-contingent surveys in this study. Although the full range of hours (07:30–22:30) was based on feedback from the pilot test group, the decision to not cover a full 24-hour day risks missing important aspects (Shiffman et al., 2008). Future studies should look to find ways of dealing with this issue, perhaps by letting participants activate and deactivate signals based on personal diurnal rhythms. Other studies have used intervals stretching into the late night hours (Sumaya and Darling, 2018), showing that such an approach is possible, which is highly relevant for fear of crime research as fear may be more prevalent and intense at night.
Another limitation involves the inability of this study to precisely calculate compliance rates. It is impossible to know whether a respondent missed a prompt (e.g. by not having the phone around) or whether it was actively ignored. Participants may simply deactivate notifications, or their operating systems may have deactivated notifications if the participants ignored them repeatedly, forcing the participants to actively restart the app to reactivate the notifications. Future research could attempt to deploy a signalling schedule based on push notifications from an external server, which might resolve the latter issue to some extent and also provide more reliable data regarding the number of notifications being sent to the participants.
Conclusion
This article has outlined methodological considerations and feasibility aspects from an exploratory and multi-methodological experience study. Two conclusions can be drawn in relation to feasibility. First, the development of STUNDA in terms of technical feasibility is clear; there are no severe technological problems associated with the use of smartphone-based research for studying situational dimensions of fear of crime (or any other social phenomenon) that would limit research possibilities. It thus seems safe to conclude that it is technically feasible to develop a research tool like STUNDA.
Although the results from this study imply that STUNDA provides a feasible means of collecting data (on fear of crime), the overall results are somewhat inconclusive. There are clearly many differences in, for instance, the duration of participation and compliance rates across participants and across surveys, which this study has attempted to examine by considering factors that may affect participation. Perhaps the feasibility of collecting data through the methodologies used in STUNDA, and other similar applications, is higher in relation to specific groups that are more likely to participate. In sum, this study thus highlights that it is feasible to create a tool to study variations in fear of crime across time and space, while still raising questions regarding the feasibility of using such an app in relation to different individuals, making it uncertain whether the methodology can be implemented in a general population. Still, using smartphone applications such as STUNDA may be very useful for unravelling experiences of fear of crime, or any other phenomenon with a situational dimension, as it unfolds in daily life. By outlining the details of how STUNDA was created and used, we hope that this study can spark interest and provide ideas among scholars aiming to launch studies on situational phenomena.
Supplemental Material
sj-pdf-1-mio-10.1177_2059799120980306 – Supplemental material for Feasibility of gathering momentary and daily assessments of fear of crime using a smartphone application (STUNDA): Methodological considerations and findings from a study among Swedish university students
Supplemental material, sj-pdf-1-mio-10.1177_2059799120980306 for Feasibility of gathering momentary and daily assessments of fear of crime using a smartphone application (STUNDA): Methodological considerations and findings from a study among Swedish university students by Karl Kronkvist and Alexander Engström in Methodological Innovations
Supplemental Material
sj-xlsx-2-mio-10.1177_2059799120980306 – Supplemental material for Feasibility of gathering momentary and daily assessments of fear of crime using a smartphone application (STUNDA): Methodological considerations and findings from a study among Swedish university students
Supplemental material, sj-xlsx-2-mio-10.1177_2059799120980306 for Feasibility of gathering momentary and daily assessments of fear of crime using a smartphone application (STUNDA): Methodological considerations and findings from a study among Swedish university students by Karl Kronkvist and Alexander Engström in Methodological Innovations
Footnotes
Appendix
The estimated compliance rates for the signal-contingent survey were calculated using the following formula
In this equation (equation (1)), ECRSignal is the signal-contingent estimated compliance rate, where the numerator ni is the total number of signal-contingent surveys reported by participant i and the denominator is the estimated received notifications. Here, x is an expected number of notifications, tx is duration from day of registration, y is a dummy variable stating whether participants were active (1), that is, answered at least one signal-contingent or daily survey, or not (0) at tx, and z is a dichotomous drop-out variable.
For the upper estimated compliance rate, xit1 is the expected number of notifications for participant i on the day of registration based on which time slot the baseline survey was completed in. If completed before or during the first time slot (00:00–12:30), the participant received a value of three (3), in the second time slot (12:31–17:30) a value of two (2) and during the third time slot (17:30–22:30) a value of one (1). Participants registering the baseline survey after 22:31 received a value of zero (0).
Furthermore, xit2 is the expected number of notifications received on day 2, where participants who were active on the day of registration (i.e. yit1) and on day 2 (i.e. yit2), participants who were active on the day of registration but not thereafter, and participants who were not active on the day of registration but who were active on day 2, all received three (3) notifications. Participants who were not active on the day of registration or day 2 received three notifications minus the value of xit1.
The main body of received notifications is based on the sum of active days from day 3 and onwards (i.e. yit3 . . . yitx) multiplied by three, the maximum number of signal-contingent survey notifications received per day. The drop-out variable (zi) provides each participant with an extra three “final” notifications, excluding abstainers and participants who were not active beyond t1.
The formula for the lower estimated compliance rate is identical to the one above, but with a modification in the definition of active days (yitx). Here, the day following an active day, as defined above, is also considered active. This applies for all days except the last day of being active.
For illustrative purposes, the time-series above represents the participatory pattern of a fictitious participant answering a total of 10 signal-contingent surveys across 10 days, where the row values represent being non-active (0) or active (1) by answering at least one signal-contingent survey or daily assessment. In the equation below (equation (2)), the left-hand formula is used to calculate the upper signal-contingent estimated compliance rate using this example, and the right-hand formula the lower
The main difference in this example is the estimated number of received notifications between t3 and t10. The upper estimate only considers days on which a signal-contingent and/or daily assessment was answered as active, while the lower estimate considers these and the next day as active days (marked with an asterisk in the time-series). The signal-contingent estimated compliance rate interval for this participant thus ranges between 37.0% and 47.6%.
The estimated compliance rates for the daily survey are calculated as follows
Here (equation (3)), ECRDaily is the daily assessment estimated compliance rate, where ni is the total number of reported daily assessments by participant i and xit1 is the expected number of daily assessments, fixed to one (1), on the day of registration. For the upper rate, yitx represents an active day, that is, on which at least one signal-contingent or daily survey was answered, and zi a drop-out value of one (1). For the lower rate, active days are defined as they were for the lower rate for the signal-contingent survey as described above. Using the same example time-series, but with a participant answering five daily assessments, the upper rate is calculated to the left and the lower rate to the right below (equation (4))
The main difference between the upper and lower estimates is the expected number of daily assessments. The upper estimate (to the left) only considers days on which a signal-contingent and/or daily assessment was answered as active, whereas the lower estimate (to the right) also considers the following day as active. Thus, the daily assessment estimated compliance rate for this fictitious participant ranges between 55.5% and 71.4%.
Example data with calculations are provided in Online Supplementary Appendix B.
Acknowledgements
The authors would like to thank their student co-workers for participating in the pilot study and providing valuable advice and comments. The authors would also like to thank the anonymous reviewers for their thoughtful and inspiring comments on this paper.
Declaration of conflicting interests
The author(s) declared no potential conflicts of interest with respect to the research, authorship and/or publication of this article.
Funding
The author(s) received no financial support for the research, authorship and/or publication of this article.
Supplemental material
Supplemental material for this article is available online.
Notes
Author biographies
References
Supplementary Material
Please find the following supplemental material available below.
For Open Access articles published under a Creative Commons License, all supplemental material carries the same license as the article it is associated with.
For non-Open Access articles published, all supplemental material carries a non-exclusive license, and permission requests for re-use of supplemental material or any part of supplemental material shall be sent directly to the copyright owner as specified in the copyright notice associated with the article.